There are essentially two styles of trading that can be deployed in the market. The first is what is referred to as a discretionary based trading style, and the second is what is known as a system based trading style. In this lesson, we will focus on the former, the discretionary trading style, with the intention of helping you to evaluate for yourself, whether it aligns with your personal psychology.
What Is A Discretionary Trading Style?
A discretionary trading methodology is characterized by a decision making process in the market that is based on discretion or judgment by the individual trader or investor. It is in direct contrast to systems trading, wherein all trading activities are governed by a set of rules that have been predefined and programmed within an algorithmic trading model.
As such, a discretionary trader has much more leeway and flexibility in their trading business. Having said that, many discretionary traders have a detailed trading plan that outlines various conditions for entering into, managing, and exiting a trade. But even with these outlined conditions, the discretionary trader is free to make overriding decisions on any trading related matters, and will have the final say in that decision.
There are pros and cons to both styles of trading, and the question is not necessarily which is the better style. Instead, the more important question is which style of trading is better suited for you based on your personality.
That is to say that some traders are much more comfortable when they are in control of the decision-making process from beginning to end. Other traders prefer to have a more automated process and allow a trading system to execute all orders in the market based on their predefined rules that has been coded into their algorithm.
Discretionary traders typically rely on trading techniques and strategies that generally have room for interpretation such as chart pattern analysis, support and resistance, Elliott wave, Fibonacci analysis, cyclical analysis and more.
System traders require more empirical or mathematical based data which can be programmed into an algorithm. As such, system traders will generally utilize technical indicators such as Stochastics, Williams %R, Average True Range, and more. Additionally they may use price smoothing indicators such as moving averages and price bands such as Keltner channels, or Bollinger Bands.
Discretionary trading has its pros and cons. Some of the advantages of using a discretionary trading style includes the ability for traders to quickly adapt to changing market conditions, and remain in complete control of how they react to such changing conditions.
This can be a great advantage for the experienced discretionary trader, who has the ability to sense if something is awry in the market and take that information and quickly adjust their positions or portfolio. The less experienced discretionary trader may however lack this sense of intuition in the market and may even be adversely affected by changing market conditions because they are unable or unwilling to react accordingly.
Tools For The Discretionary Swing Trader
There are many different tools that discretionary traders can use. Below you will find a list of four important discretionary trading tools for swing traders that focus on the Futures and Forex market.
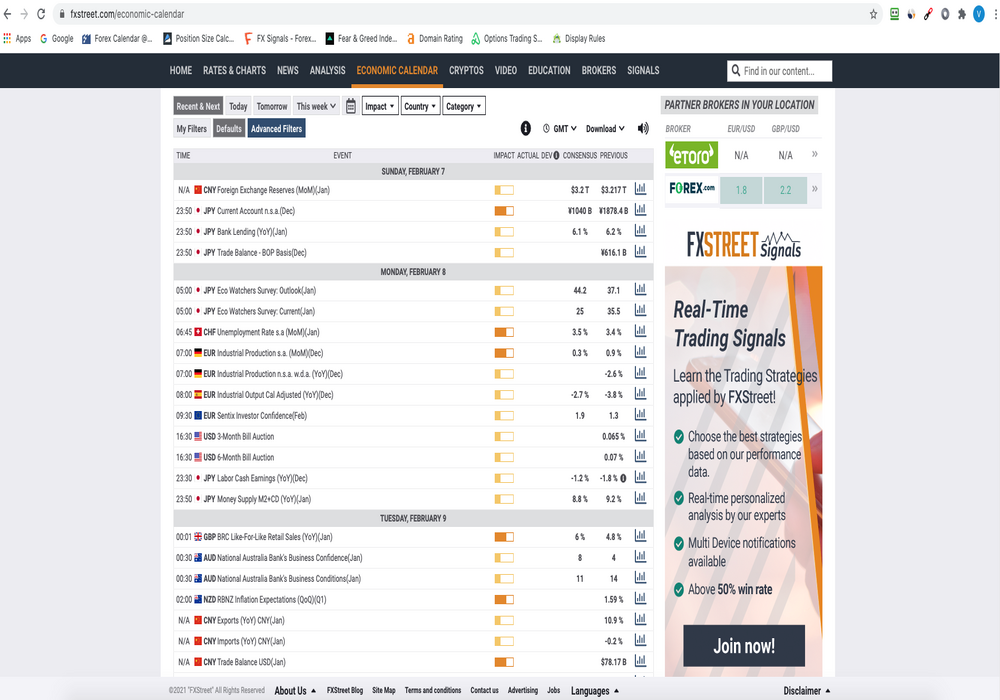
Economic Calendar – Having access to an economic calendar is of vital importance to any intermediate term trader. By knowing the scheduled economic news releases for the current day and upcoming several days can help you better navigate your swing trading efforts.
Being abreast the day’s and week’s current events can help you to reduce risk in your open positions, and eliminate trade setups that could be adversely affected by an important economic or fundamental news release. Below is a useful economic calendar for discretionary currency traders provided by FXStreet.
Correlation Table – A correlation table enables a trader to better assess risk within a portfolio of positions. That is to say that you should always consider the effect of adding a new position to your current holdings. This is because some currency pairs and asset classes are highly correlated and thus can lead to a situation wherein you may be inadvertently overweighting a particular position in your portfolio.
The correlation table or matrix can provide valuable insights into new and developing correlations in the market. This awareness can help you steer clear of any unintentional portfolio overbalancing.
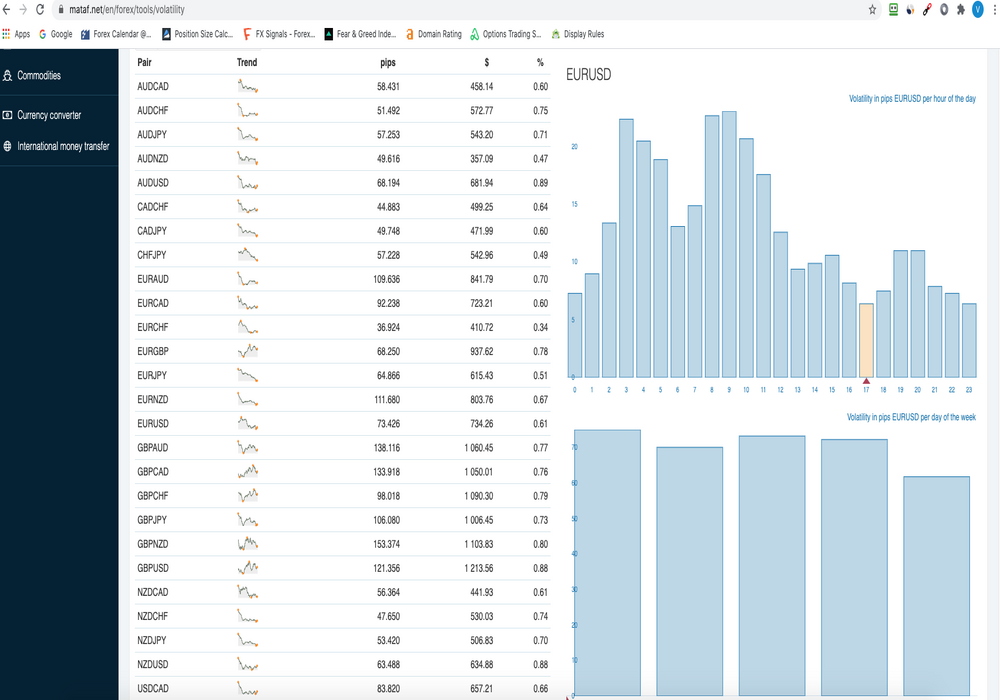
Volatility Analyzer – Discretionary swing traders should have a viable method for analyzing volatility within the market. There are ways to analyze current and future volatility. One of the more popular ways to analyze volatility is by simply looking at the average daily range indicator. This indicator provides insights into the daily high low range within a given market, and traders can use that data to compare against historical tendencies.
The VIX indicator is an excellent gauge of overall market volatility and fear within the stock market. Below is a Volatility Analyzer for discretionary forex traders provided by Mataf.net.
Commitment of Traders – The Commitment of Traders report is put out by the CFTC every Friday afternoon. It details the current futures and options positions of three major market participants including large hedgers which are often called commercials, large speculators which are typically investment funds and hedge funds, and other non-reportables, which are typically smaller retail traders and investors. There is a treasure trove of valuable information within this weekly report.
When you know how the different players in the market are positioned, you can use that information to make better trading decisions. Although this report is completely free, many traders underestimate its value. Furthermore, most beginners will find that analyzing the data within it can be quite challenging. Nevertheless, it is an important tool that can benefit most if not all discretionary swing traders. As such, it is well worth looking into.
Tools For The Discretionary Day Trader
Now let’s discuss a few important tools that discretionary day traders can use. Below you will see a list of four valuable tools for discretionary day traders that focus on stock index futures and individual stocks.
Market Profile – Market profile is a discretionary analytical method for understanding order flow in the market. Essentially, the market profile helps a trader organize the day’s trading activity in a way that makes it more amenable to finding areas of balance and imbalance in the market. Said another way, it can help in assessing fair value versus overextended market conditions. Market profile takes into account three primary pieces of data. This includes time, price, and volume.
TICK and TRIN Indicators – The TICK and TRIN indicators are sentiment based indicators that are very useful in gauging overbought and oversold conditions within the broad stock market index such as the S&P 500, Dow 30, and the NASDAQ 100. When these indicators reach an extreme level, there is a strong tendency for prices to revert back to the mean.
For example, when the TICK indicator reaches an upper threshold, that is indicative of an over extended price move to the upside, which should result in a downward correction towards the mean. Similarly, when the TICK indicator reaches a lower threshold, that is indicative of an overextended price move to the downside, which should result in an upward correction towards the mean.
News Feed – Every discretionary day trader needs to have a reliable newsfeed to stay on top of the latest news and economic releases for their trading instruments. Some newsfeeds are built directly into a traders platform, while others can be a standalone application. Some newsfeeds are better than others. So it’s essential that a discretionary day trader do the required due diligence to select the best newsfeed for their particular budget. Some of the more reputable day trading newsfeeds include the following – Benzinga Pro, Bloomberg, Yahoo Finance, Market Watch, Wall Street Journal, CNBC markets, and The Financial Times.
Scanning Software – Scanning software is particularly useful for stock day traders who employ momentum based strategies. With thousands of stocks listed on the major exchanges, it’s nearly impossible to manually monitor all potential trading opportunities. As such, a stock scanning software can be a vital tool for discretionary day traders to ensure that they do not miss any major trade setups within their watchlist.
One of the better-known stock scanning software is in the market is Trade Ideas. Within Trade Ideas a trader can scan dozens of different preset scans to find the best trade opportunities during the day. Additionally, a user can customize and build their own stock scanning criteria based on their specific parameters.
A Discretionary Trading Strategy
Let’s now illustrate a simple discretionary trading method that can be applied to the US Stock Market Indexes. This strategy works best on the S&P 500, Dow 30, NASDAQ 100, and Russell 2000. It can be applied in both the equity market via the specific market index ETF, or in the futures market using the micro or the e-mini index futures contracts.
This discretionary strategy utilizes a mean reversion approach, and takes advantage of a certain tendency that occurs within the stock market. More specifically, when the market gaps down on the open following a test of an important resistance area, there is a good likelihood that the price will return to the closing price of the previous day, essentially filling the price gap.
Now, it’s important to note that this is a long only strategy, and as such, we will only be looking to buy gap downs at the open following a test of a resistance level.
So here are the rules for this gap fill trading strategy using the 15 minute chart of the day session.
- Price has recently tested an important swing high or resistance level.
- Shortly after the resistance level test, typically on the following day, the price gap downs at the open.
- The length of the gap should be greater than the average price bar of the last 10 bars prior to the gap down.
- Once these conditions have been met, you would enter a market order to Buy as soon as possible after the open.
- The stop loss would be placed at a distance below the opening price that is equivalent to the length of the gap.
- The take profit exit would be placed at the close of the previous session, which is essentially the price prior to the opening gap.
Again, we will only execute the strategy within the major US stock indexes and only when a gap down occurs after a test of an important resistance level. The reason that we only reserve the strategy to the long side is because this particular pattern isolates a period wherein market participants become overly bearish and panicky.
This results in an in ordinate amount of order flow to the short side. This condition is typically short-lived, as professionals push prices back to its fair price levels. This pattern does not work as well on gap ups after a test of a major support level. As such, we avoid trading that scenario altogether.
Discretionary Trade Setup Example
Let’s look at an actual example of this discretionary trade set up on the SPY, which represents the S&P 500 ETF. Below you will find the 15 minute chart of the SPY based on the day session. The day session starts at 9:30 AM Eastern and ends at 4 PM Eastern.
It’s important that you do not include any price data outside of this trading session in implementing this trading strategy. The 4 PM closing price is very important as it relates to this methodology, and as such, you must be careful to set your chart parameters to this closing time for the day session.
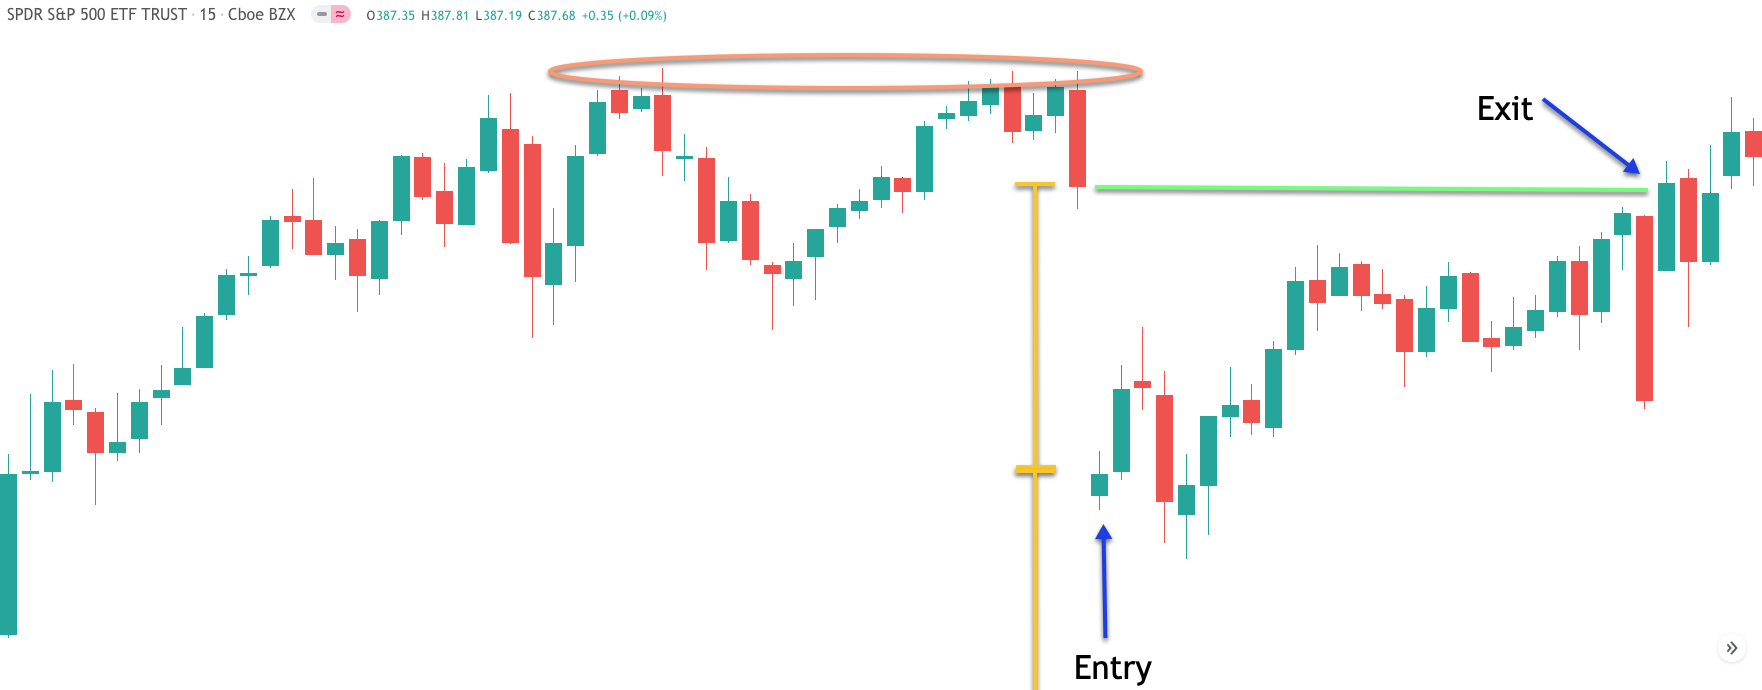
Analyzing the beginning of price chart above, you can see that there is a relatively steady price move higher. The price action created a swing high which was later retraced. The price then put in a swing low, and then a subsequent swing high was created. The second swing high retested the initial swing high, which was a relatively important resistance level created on the price chart. Shortly after this retest, the prices move lower off of the resistance level and closes near the low of the last 15 minute bar for the session.
The following day the opening price gaps lower, and is substantially below the close of the previous day. If we measure the length of the gap and compare it to the average price bar over the previous 10 bars, we can confirm that the length of the price gap is greater than the average price bar over the last 10 bars. As such, all the conditions for this set up have been met. As such we would place a market order to buy as soon as possible after the open.
We would protect our position by placing a stop loss order below the entry price, which would be equivalent in distance to the length of the gap. The upper yellow bracket represents the length of the gap, and the lower yellow bracket represents that same length below the opening price. Notice we are not able to see the end of that second lower bracket since it is well below our chart image. But that is where the stop loss would need to be placed.
Clearly, the price action never got anywhere close to that stoploss level. Instead, the price began to move higher fairly quickly, and continued to do so during the session until it eventually reached our target point. Remember, the target point for this trade set up would occur at the close of the previous day. The green horizontal line represents this previous day’s closing price, and thus our target point.
Another Discretionary Trade Example
Moving onto another example of this strategy, let’s now turn our attention to this 15 minute SPY chart below.
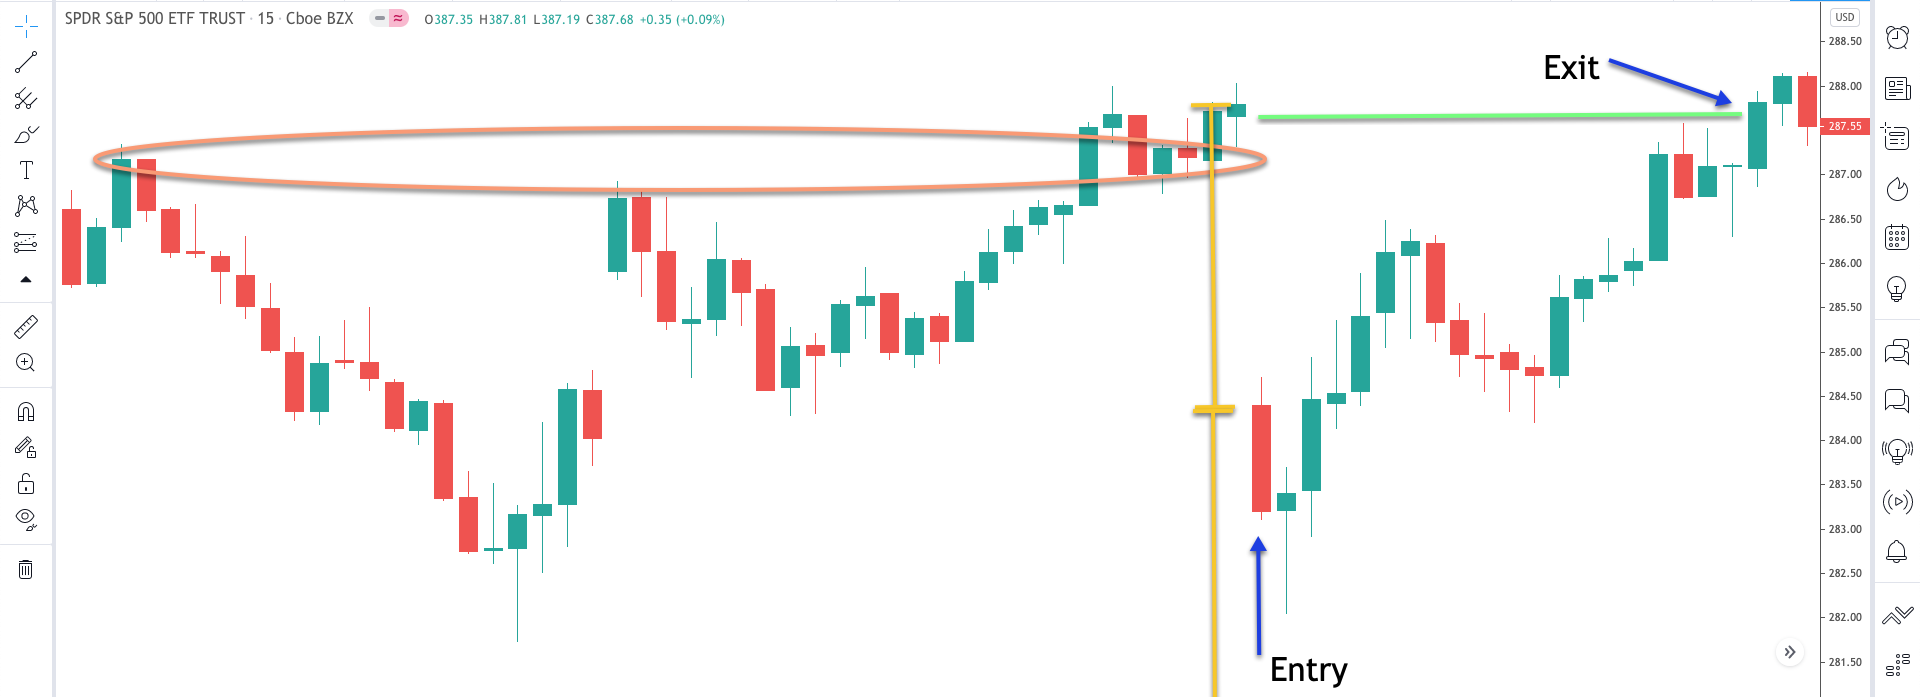
Notice here, that price started off by creating a swing high, which led to a sharp move lower. Subsequently, the price continued to move higher testing the initial swing high level. Then we can see another minor retracement to the downside, which was followed by another test of that resistance level. Prices moved slightly above the resistance zone during the final test, and the closing price for the session occurs near the top of that price range.
The next day the price gaps down at the open. We can see that the length of this gap down is greater than the average price bar within the last 10 bars. As such, we can prepare for a long trade since all of the necessary conditions of the trade setup have been met.
A market order to buy would be placed as soon as possible following the open. The stoploss would be placed below the entry that is equivalent in distance to the length of the gap. Finally, the take profit target would be set at the prior day’s closing price.
We can see that the price within the initial 15 minute bar moved lower after we would’ve entered into the position. The price within the second bar also declined and made new lows for the day, however, demand soon entered the market pushing prices higher during that second price bar.
That second bar resulted in a hammer candlestick formation. This is indicative of price rejection to the downside, and provides for a bullish implication. Immediately following the formation of the hammer candle pattern, the price began to rise, and made sufficient gains during the day to reach the prior day’s closing price. This coincided with our target point, allowing us to exit the trade for profit.
Summary
In this lesson, we’ve defined what discretionary trading is, and compared it to systems trading. We looked at some of the pros and the cons of discretionary trading, and presented a discretionary trading strategy built for various stock market indices. Deciding whether a discretionary based trading strategy is right for you will depend on your personal strengths, weaknesses, and preferences.
The best way to know whether this is a style of trading that suits your personality is to start implementing discretionary based strategies in the market along with a few system based strategies as well. You will be able to compare and contrast the advantages and disadvantages of each as it relates to your own level of comfort. By going through this surveying process, you will be better prepared to align yourself with the trading style that suits your temperament the best.