The Bollinger band squeeze play is a high probability trading set up that offers a solid risk to reward profile. There are a few variations of the squeeze set up that you can trade depending on your preference. We’ll discuss some basic foundations of the Bollinger band study, the importance of understanding the cyclical nature of market volatility, and present a few techniques for successfully trading the Bollinger band squeeze.
What Is The Bollinger Band Squeeze Play?
To understand the underlying logic behind the Bollinger band squeeze set up, it’s important to have some background on the cyclical nature of volatility expressed in the financial markets. We will be diving more into volatility expansion and contraction in the upcoming section. But for now, we can simply define the Bollinger band squeeze trade as one wherein we are trying to take advantage of a price move that occurs after a period of relative calm in the market. Essentially, we would be looking to trade a breakout from a tight consolidation. But in this particular Bollinger breakout strategy, our consolidation range is very clearly defined.
The primary indicator used for trading the squeeze set up is the Bollinger band. The Bollinger band is a volatility based band wherein the upper and lower bands are constructed using the 20 day simple moving average line, and has a default setting of two standard deviations on either side of the centerline. One of the most noticeable characteristics of the Bollinger band is that the majority of the price action will be contained within the upper and lower boundaries. The bands will expand and contract based on the recent market activity.
There are two variations of the squeeze set up. The first uses the Bollinger band width indicator alongside the standard Bollinger band study, and the second variation uses the Keltner channel. We will be discussing each of these variations and illustrate a few trade examples as we progress further along. Regardless of the method used to trade the squeeze set up, the ultimate goal is the same. That is to say that we need some mechanism by which we would define a consolidation, and a process for validating a breakout from that consolidation that is most likely to lead to an impulsive price move following the breakout. We need to try to achieve this, while at the same time, reducing the chance of fakeouts.
Volatility Expansion and Contraction In The Markets
We can gain a deeper appreciation of the Bollinger squeeze trading set up once we take some time to understand the importance of volatility in the markets. Volatility is considered to be mean reverting within the financial markets. This is to say that there is a distinct ebb and flow in the markets.
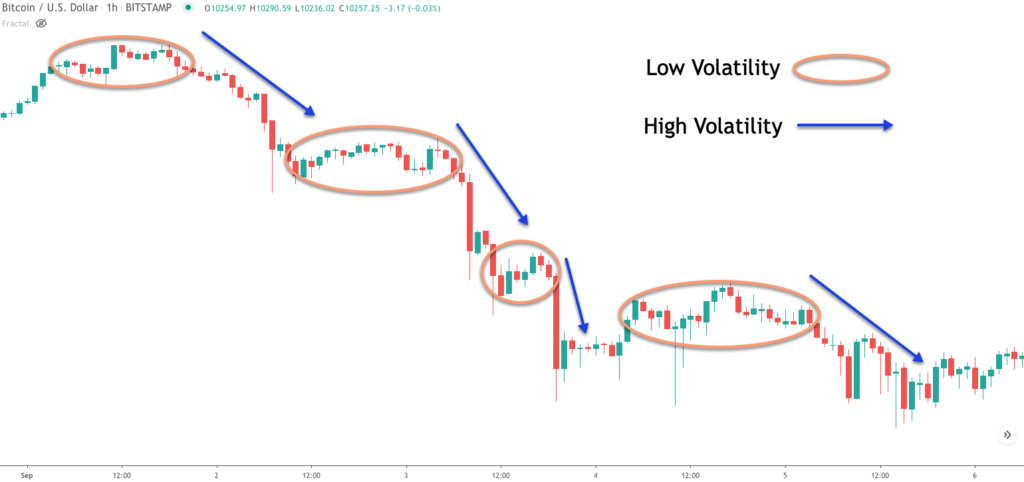
Prices move from periods of relative quiet, or low volatility, to periods of relative excitement, or high volatility. This is a cyclical process and is ever present. Traders who understand this characteristic can use that knowledge to gain an edge in their trading. The tendency for the markets to move through this cycle of expansion and contraction is much more predictable, then the actual directionality of market moves. Essentially, it is very difficult to predict where prices are going next. Most people do not fare better than a 50% chance of doing so. On the other hand, predicting volatility cycles can prove to be a much more fruitful effort.
If we think about this from the intuitive level, we can understand why a Bollinger volatility breakout would make sense. We know that markets do not move in one direction forever. Instead there will be periods wherein the markets trend, followed by periods wherein the markets move sideways. The order flow is constantly moving from areas of balance or price equilibrium to periods of imbalance or trend moves. This phenomenon is present regardless of your chosen trading timeframe. This ebb and flow occurs at the very smallest timeframe to the very longest time frame as well. This is because the markets are fractal in nature and as such the self-repeating patterns of market volatility will occur at all degrees of trend.
The Bollinger band squeeze set up that is the purpose of this lesson is just one of a myriad of ways that a trader can take advantage of the volatility contraction and expansion footprints that are ever present on the price charts. Some other technical methods that also seek to drive profits using a volatility-based model include narrow range bars, opening range breakout, options implied volatility analysis, and VIX analysis.
Notice on the chart below how periods of low volatility are followed by periods of high volatility.
Bollinger Band Basics
Bollinger bands were created by John Bollinger, a well-known commodity trading advisor. The primary benefit of using Bollinger bands is that it helps in evaluating the overall volatility within a specific market. Let’s now take a closer look at the default Bollinger band settings.
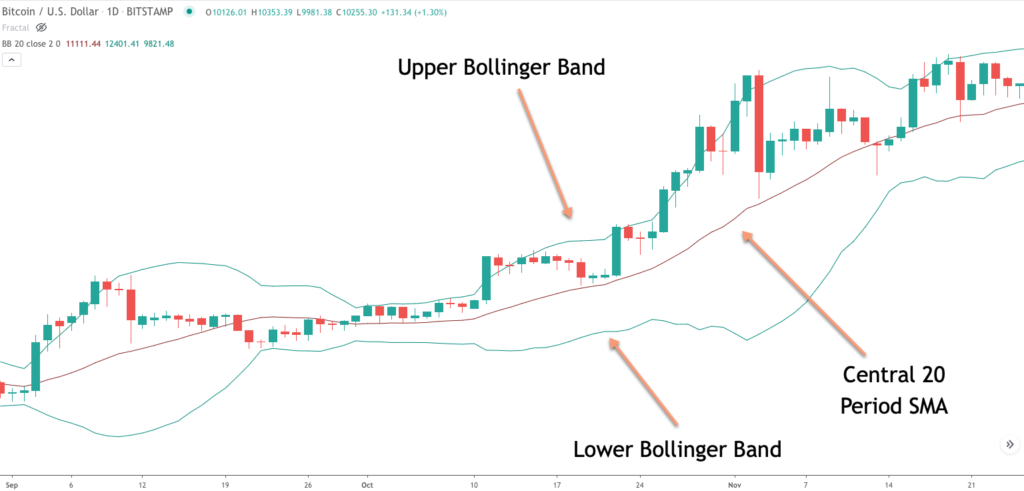
The Bollinger band is comprised of three lines. The central line is a simple moving average line with a 20 period lookback. The upper line of the Bollinger band is computed as being two standard deviations above the central SMA line. And similarly, the lower line of the Bollinger band is calculated as two standard deviations below the central SMA line.
One of the important characteristics of Bollinger bands is that as markets become more volatile the bands will tend to widen. And when the markets become less volatile the bands will tend to narrow. This is an important feature within the Bollinger band that we should keep in mind, especially as it relates to the Bollinger band squeeze set up that will be demonstrating shortly.
Take a look at the image below which shows these three components of the Bollinger band.
A trader can use the Bollinger band study in a number of different ways. Mean reverting traders sometimes utilize Bollinger bands to define statistically significant upper and lower limits that prices are likely to trade within. For example, in a range bound market, a trader may consider a price that reaches the upper limit of the Bollinger band as a sign of an overbought market. And conversely, a trader may consider a price that reaches the lower limit of the Bollinger band as an indication of an oversold market.
Trend following traders can also make use of the Bollinger band indicator. One popular method that is employed by trend traders is to use the centerline of the Bollinger band as a signal to enter with the underlying trend.
For example if the price crosses below the center Bollinger band from above, then a trend trader may opt for a short trade. At the same time, if the price crosses above the centerline of the Bollinger band a trend trader may take that as a signal to go long.
These are just a few of the techniques that Forex and futures traders can employ using this versatile indicator. Our goal here is to discuss one specific Bollinger band technique for trading the markets. This of course is identifying and interpreting a potential Bollinger squeeze set up.
Bollinger Band Width Indicator
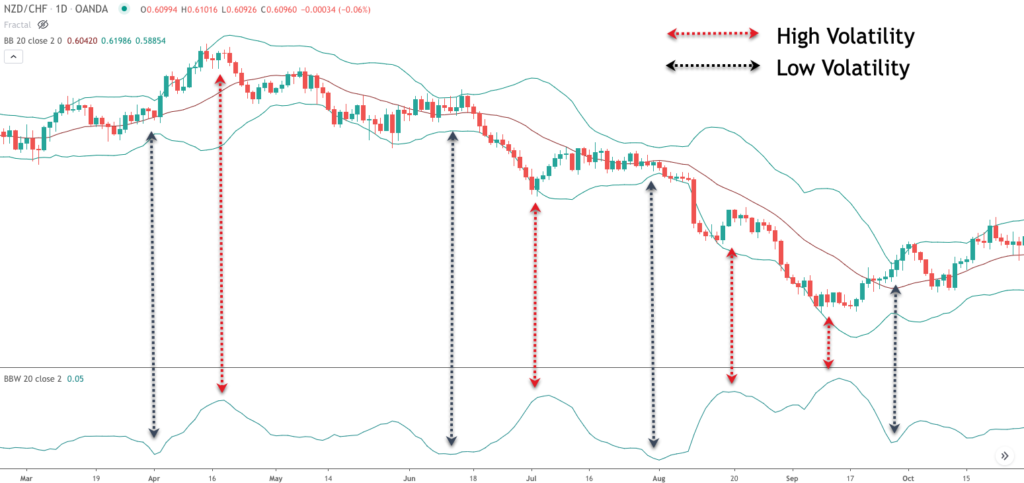
Now that we have a good understanding of the Bollinger band indicator, let’s move on to the Bollinger band width indicator. The Bollinger band width indicator or BBW is a derivative study of the Bollinger band itself. Essentially, the BBW measures the width of the Bollinger band. The band width provides us a good indication of the overall volatility condition in the market. Generally, a low band width correlates with lower market volatility, whereas a larger band width correlates with higher market volatility.
The formula for the band width is as follows:
Band Width = (Upper Band – Lower Band) / Middle Band
The calculation for band width is quite simple, however, it can provide us with a very quick reference point in evaluating current market volatility compared to historical market volatility. As we’ll see shortly, the Bollinger band squeeze play relies on finding periods in the market where the band width is relatively low in an effort to ride the expanding volatility that is likely to follow.
Most trading platforms will have the standard Bollinger band indicator as part of its library of technical studies. The Bollinger band width indicator, BBW, however, is not included within many charting platforms. You will need to check with your particular platform to ensure that you have access to the BBW indicator. If not, you will need to search online to find one that is either available for free or for sale.
Below you will find a price chart with the traditional Bollinger band study applied to the price chart, along with the Bollinger band width indicator attached to the lower pane of the chart. Notice how periods of low volatility correspond to lower readings on the BBW indicator, and how periods of higher volatility correspond to higher readings on the BBW indicator.
Bollinger Band Squeeze Strategy With BBW indicator
As we’ve alluded to earlier there are two primary techniques for trading the squeeze band set up. The first method utilizes the Bollinger band overlay in conjunction with the band width indicator. This method was originally introduced by John Bollinger. The second method for trading the tight squeeze band set up uses a combination of the Bollinger band study and Keltner channels.
In this section, we will focus on the first method, which incorporates the band width indicator. But it’s important to note that the strategy that we will present for both is a unique variation and not necessarily the same methods as presented by the original creators. The underlying logic is the same. That is to say that our goal is to capture a trend leg following a breakout from a tight congestive market phase.
So here are the rules that set up a long squeeze play:
- Bollinger band width must be at the lowest point in the last 100 periods
- A bullish price move must be present prior to the consolidation phase.
- Enter a buy at the market following the first candle that closes above the upper Bollinger line.
- Stop loss to be placed below the most recent swing low.
- Take profit target set at the first down fractal following the breakout.
Here are the rules that set up a short squeeze play:
- Bollinger band width must at the lowest point in the last 100 periods
- A bearish price move must be present prior to the consolidation phase.
- Enter a sell at the market following the first candle that closes below the lower Bollinger line.
- Stop loss to be placed above the most recent swing low.
- Take profit target set at the first up fractal following the breakout.
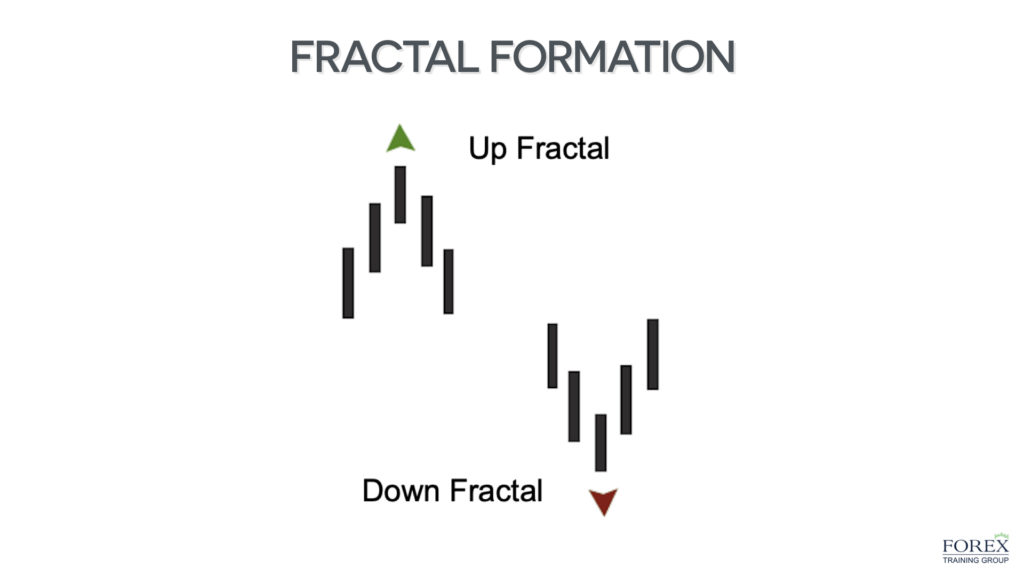
We’ve gone over all of the technical indicators required for executing this type of Bollinger squeeze setup. However, there is one facet of the strategy that we have not explored in detail. What I am referring to is our take profit target. For the long squeeze play, our take profit will be the first down fractal following the breakout, while the take profit target for our short squeeze play will be the first up fractal following the breakout.
If you’re not familiar with up or down fractals, then the illustration below should provide some insights. Essentially a down fractal formation is a five bar structure wherein the middle bar has a higher high then both of the two bars on either side of it. Similarly, a up fractal formation is a five bar structure where in the middle bar has a lower low than both of the bars on either side of it.
Bollinger Band With BBW Indicator – Trade Example
Let’s now look at a practical chart example that illustrates our strategy detailed above. The chart below is for the Australian Dollar-US Dollar currency pair based on the daily timeframe.
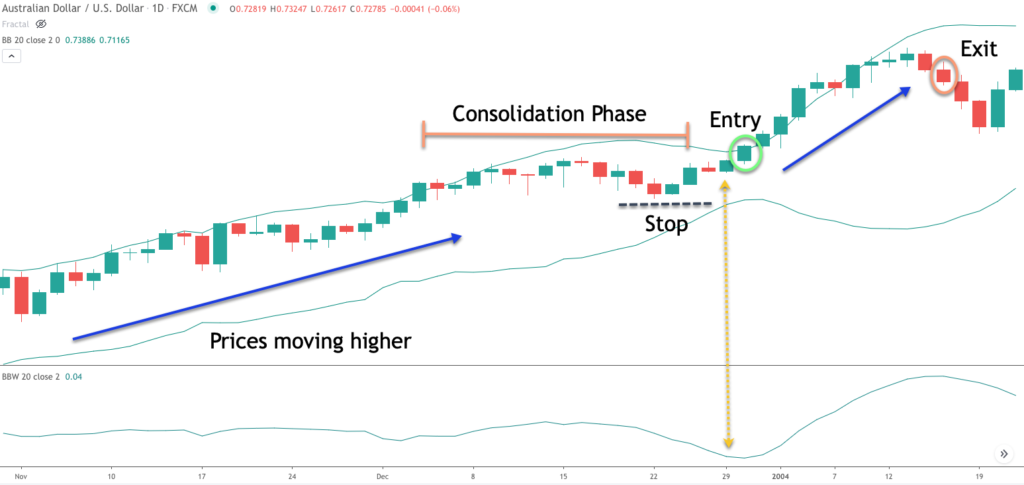
The Bollinger bands are shown as the two green lines that are overlaid on the price chart. The Bollinger band width indicator is shown on the lower pane as a single green line. The default settings have been used for both the Bollinger band and the Band width indicator.
We can see that prior to the consolidation phase, towards the center of this price chart, prices were moving higher steadily. You’ll also notice that the band width indicator on the lower pane was also relatively flat during the uptrend. However, during the latter stages of the consolidation phase, there was a sharp decline in the BBW indicator. Specifically what that tells us is that the width of the Bollinger bands was contracting. In fact, at the point where the vertical yellow line has been shown, the band width was lower than the previous 100 days in this particular case.
Now that we have confirmed that the price has been moving higher prior to the consolidation phase, and that the band width is registering a reading that is lower than the last 100 periods, we can prepare for a potential long entry. The long entry signal would come upon the first candle close above the upper line of the Bollinger band. You will see that entry trigger circled on the price chart. Immediately following this event, we would enter an order to buy at the market. The stop loss would be placed at the most recent swing low, as can be seen by the dashed black line denoted, Stop.
Finally, for the take profit, we would monitor the price action until we were able to locate the first down fractal following our entry signal. If you refer to the far right of this price chart you can see the candle circled in orange which completes the first up fractal pattern following the Bollinger squeeze breakout entry. Just to recap, an up fractal is a five bar pattern wherein the high of the middle bar is higher than the two bars at either side of it. If you look closely at the price chart you will notice that the circled orange bar does in fact complete that down fractal pattern.
Bollinger Band Squeeze Strategy With Keltner Channel
The second variation of the squeeze strategy that we will detail was popularized by John Carter, in his book, Mastering the Trade. His squeeze play strategy relies on combining the Bollinger band with the Keltner channel study.
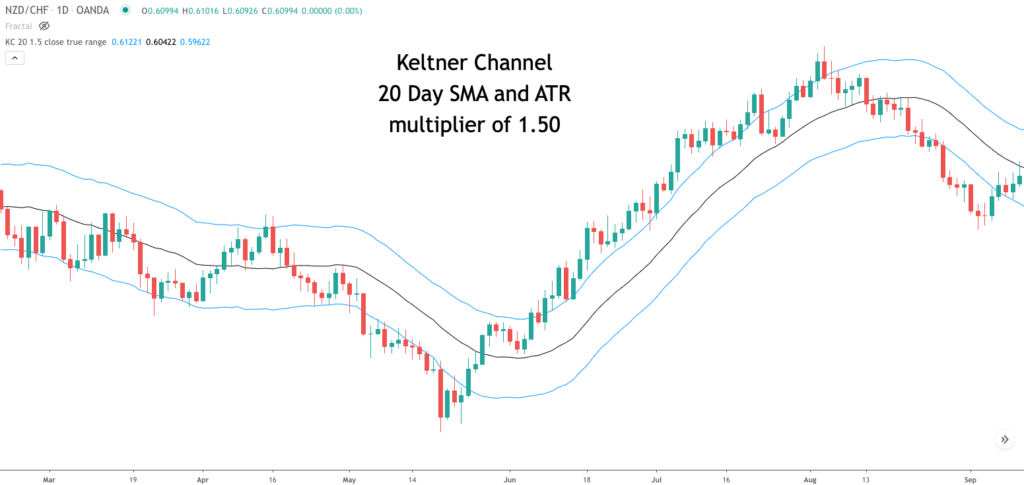
The Keltner Channel indicator is essentially a moving average band whose upper and lower lines are based on the average true range. The default settings for the Keltner channel is the 20 day simple moving average with an average true range multiplier of 1.5.
Similar to the Bollinger band, the Keltner channel is also a volatility based indicator. The primary difference between the two is in the calculation of the upper and lower limits. While the Bollinger band utilizes a standard deviation calculation, the Keltner channel utilizes an average true range input. Both of these indicators are included in most charting platforms. Alternatively, you could consider building your own Bollinger band squeeze indicator.
Below you will find an example of a Keltner channel drawn on the price chart.
So in this second variation of the squeeze play, the band width will be replaced with the Keltner channel. More specifically, this variation of the setup is confirmed when the Bollinger bands are enclosed within the Keltner channel. When this event occurs, it is an indication that the market range has narrowed and a consolidation phase is in progress. We will incorporate the same rules for our squeeze strategy presented earlier, with the exception, that we will replace the band width indicator with the Keltner channel indicator. Let’s take a look at these revised rules:
So here are the rules that set up this type of long squeeze play:
- Upper and lower lines of the Bollinger Band must be contained within the Keltner Channel
- A bullish price move must be present prior to the consolidation phase.
- Enter a buy at the market following the first candle that closes above the upper Bollinger line.
- Stop loss to be placed below the most recent swing low.
- Take profit target set at the first completed down fractal following the breakout.
Here are the rules that set up this type of short squeeze play
- Upper and lower lines of the Bollinger Bands must be contained within the Keltner Channel
- A bearish price move must be present prior to the consolidation phase.
- Enter a sell at the market following the first candle that closes below the lower Bollinger line.
- Stop loss to be placed above the most recent swing low.
- Take profit target set at the first completed up fractal following the breakout.
Bollinger Band Squeeze With Keltner Channel – Trade Example
Let’s now take a look at the second variation of this squeeze set up on the price chart. On the chart below you will find the British Pound to Canadian dollar currency pair based on the daily timeframe.
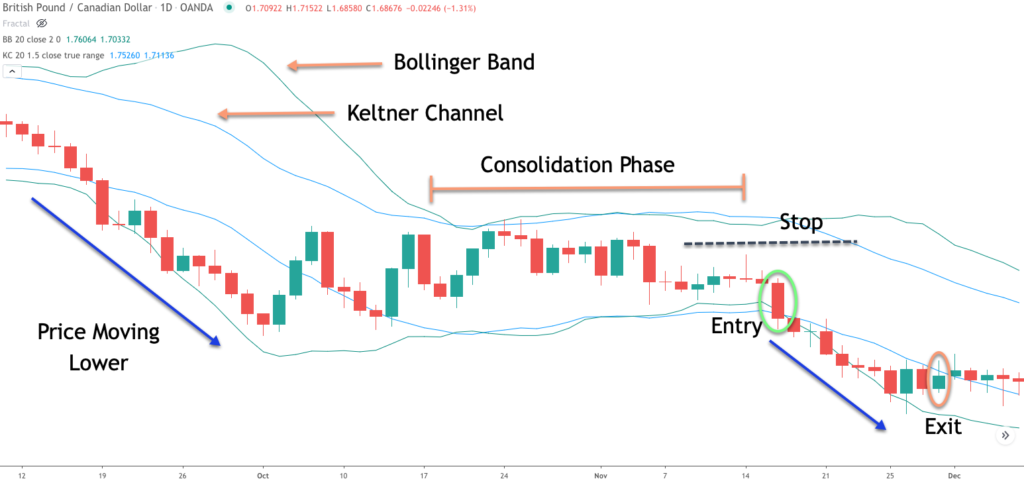
We showed a bullish example of the squeeze set up using the band width indicator earlier. Here we will take a look at a bearish example using the Keltner channel variation. We’ll be using the default Bollinger squeeze setting for both the Bollinger band and Keltner channel.
Keep in mind that the default setting for the Bollinger band is a 20 period simple moving average as the centerline with a two standard deviation that comprises the upper and lower bands. For the Keltner channel, the default setting is the 20 period simple moving average with a 1.5 X ATR multiplier. The green bands represent the Bollinger band indicator, and that blue bands represent the Keltner channel.
As we can see from the chart, the GBPCAD cross currency pair was moving lower sharply before entering into the consolidation phase. Notice how during the consolidation phase prices began to move in a sideways manner. At the same time we can see a transition in the behavior of the Bollinger bands. Specifically, the Bollinger bands were initially located outside of the Keltner channels during the downtrend. However, as a sideways price action ensued, the Bollinger bands began to tighten, and eventually was completely engulfed by the Keltner channels.
When this took place it would have alerted us to a potential short trading opportunity. The actual sell entry signal would be triggered upon the first candle close below the lower Bollinger band line. The green circled candle shows where the sell entry signal occurred. Immediately following the close of this candle we would have put in a market order to sell.
The stop loss order would be placed just above the most recent swing high. The black dashed line above the sell entry depicts where that placement should have been. At this point, we would follow the price action lower and wait for a completed up fractal to signal our trade exit. The orange circle bar at the lower right of the price chart shows the candle that completes the first up fractal formation following the entry signal. To recap, an up fractal is a five bar formation wherein the low of the center bar is lower than both of the two bars on either side of it.
Summary
Bollinger bands are one of the most versatile trading tools available to forex traders. It is just as popular with contrarian traders as it is with trend following traders. We presented one type of trading set up that incorporates the Bollinger band indicator, specifically the squeeze trade. It’s a high probability set up that is fairly simple to implement. Additionally, it works equally well across many different time frames and instruments. I would encourage you to setup a Bollinger band squeeze scan within your trading platform and back test different variations of it to gauge the results for yourself.