The trend is your friend is a catchy saying that describes one of a few market conditions that can generate profits. But, all good things come to an end, and adjusting your trading strategy when different market conditions arise, is an important part of your overall trading business.
We have all experienced a situation where our best trading strategy starts to underperform, as a new market condition starts to emerge. Out of the blue, the choppy range bound market environment is replaced by a smooth trend and our range bound strategy begins to lose money. It’s important to keep your eye on the ball, and make sure that you recognize various market phases, especially if your strategy is geared toward taking advantage of a trend or range.
There are a number of different types of markets conditions, as well as, macro events that will generate specific market environments. For example, ahead of a binary event, such as a monetary policy meeting, or a vote for President, you might see a consolidating market. Ahead of this type of event traders will settle in to a low volatility market condition, ahead of something that could generate significant high volatility in forex.
Types of Market Environments
There are four distinct market trading environments, where you could evaluate a specific security to determine if price action is range bound with low volatility, range bound with high volatility, trending with low volatility and trending with high volatility. Different trading strategies will work well in conjunction with the type of market environment you are facing.
Range Bound Market Conditions
Range bound trading takes advantage of markets that are in a congestion phase and a well-defined trading range. You might wonder why a currency pair would become range bound as opposed to trending higher or lower.
The answer is based on supply and demand. Currency pairs move for many reasons, which include fundamental factors such as interest rate differentials or technical patterns. As a currency pair moves to the upper end of a range, it needs a catalyst to drive it higher, and once that catalyst emerges, the exchange rate is free to test a new range.
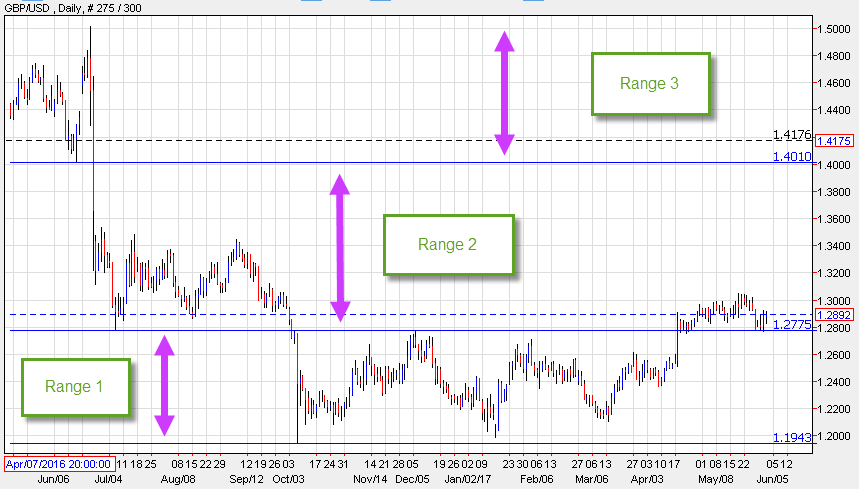
The chart of the GBP/USD shows market congestion that causes an exchange to trade in a range, until there is an impetus that allows it to move to a different range. This is an example of a range bound market that experiences both high and low levels of volatility. In mid-2016 the currency pair was trading in range 3, and enjoying low volatility until the Brexit vote in June of 2016. The surprise results generated downside volatility and a movement of the currency pair out of a stable range and into range 2. The exchange rate spent approximately 3-months in range 2, until a new impetus moved the exchange rate even lower.
During this period, the new British Prime Minister, Teresa May, announced that the UK would move for a quick Brexit from the EU, which led many economists to downgrade their assessment of the UK economy. For nearly 6-months the GBP/USD exchange rate was trading in Range 1. It was capped by resistance which was former support following the move lower from Range 3 to Range 2. In April of 2017, the GBP/USD moved back into Range 2, following an announcement that the UK would have snap elections in June of 2017. Market participants at the time believed that the PM would not call for elections unless she believed that she would win, which would create a mandate for an early exit from the EU.
So, how to you trade a range bound market? One of the most efficient strategies is a mean reversion strategy. A mean reversion strategy is one where you are looking for the price of a security to revert back to a medium or long term mean after it has stretched to the outer end of its distribution. An example of a mean reversion strategy is a Bollinger band strategy.
What is the Bollinger Band Mean Reversion Strategy?
The Bollinger band study was developed by John Bollinger as a way to measure the distribution of prices over a specific period of time. What Bollinger was trying to do is see have far the proverbial rubber band could stretch before it snapped back.
The Bollinger bands capture the range of prices over a period, and encapsulating a distribution of prices. The default mean that Bollinger initially used was the 20-day moving average. By adding a 2-standard deviation change, over the past 20-day period, to a 20-day moving average, and subtracting a 2-standard deviation range, you create a confidence band where 95% of all prices fall during the prior 20-day period. In theory, an exchange rate should only move out of the Bollinger range, 5% of the time which means you might be experiencing an anomaly.
Most charting packages provide customers with a Bollinger band indicator where you can change both the moving average that is used to calculate the Bollinger band, along with the standard deviation that is used to calculate the bands.
Some sophisticated charting packages even allow you to make the Bollinger band highs different from the Bollinger band lows. For example, you might want to see a Bollinger band high that is 3-standard deviations above the 50-day moving average and a Bollinger band low that is 1 standard deviation below the 50-day moving average. Additionally, you can use different points to generate an average, such as the high, low open or close. You can also use, intra-day data, as well as, weekly or monthly data points.
Types of Bollinger Band Trading Strategies
The most widely used Bollinger band strategy is a mean reversion strategy. The idea is to purchase a currency pair when the exchange rate touches the Bollinger band low and sell a currency pair when the exchange rate touches the Bollinger band high.
A more conservative approach would be to wait for the close, after the Bollinger band high or low was breached that confirms a breakout failure. You might wait until you receive a confirmation of a close back below the Bollinger band high or a close back above the Bollinger band low to transact.
The key to a successful mean reverting strategy using a technical approach like the Bollinger band indicator is to apply it when the exchange rate you are trading is transitioning from a trending phase to a consolidation phase or when the market is already in a well-defined range.
Measuring Volatility in Mean Reverting Strategies
The Bollinger bands are a measure of historical volatility and uses the standard deviation to calculate the Bollinger high and Bollinger low. Historical volatility is calculated by multiplying the standard deviation by the square root of time. If you measure the difference between the Bollinger band high and the Bollinger band low, you can evaluate volatility. This differential is translated into an indicator known as the Bollinger band width.
Historical volatility describes how much a currency pair has moved over a period, and is generally referred to in percentage terms. For example, if a currency pair has a historical volatility of 10%, this means that the change in the security over the period you are measuring would equate to a move of 10% over the past year.
What you want to get out of historical volatility is to try to determine if a currency pair is likely to move higher or lower, once its reaches the Bollinger band high or Bollinger band low. The Bollinger band width tells you if the security you are evaluating is consolidating or accelerating.
If the Bollinger band width is increasing, then volatility is climbing, and if the exchange rate of a currency pair is approaching the Bollinger band high or low, it might be prudent to hold off on placing a mean reversion trade, if volatility is on the rise. If on the other hand the Bollinger band width is declining then volatility is declining and pulling the trigger on a mean reversion trade might be prudent.
Mean reversion strategies make money until the market environment changes. Once this occurs and the market breaks out, you are at risk that the currency pair you are evaluating starts to trend. You don’t want to trade a mean reversion strategy when a market is trending, so you need some specific trade tools that will help you determine that the environment has changed.
 Is the Trend Really Your Friend?
Trend trading is prudent way to trade, as you can generate significant earnings during periods when a currency pair trends. Unfortunately, a trend is not easy to find, and does not happen often.
Trending markets occur approximately 30% of the time and the other 70% of the time a currency pair is consolidating in a range. As we have discussed, new information is usually the impetus that breaks a currency pair out of a trading range, as investors who are caught on the wrong side are forced to either sell their securities or buy back short positions. Once a security breaks out of a range, it moves in search of a new range and during this period the market trends.
The definition of a trend is the movement in one specific direction over a period that continues to perpetuate. Trends obviously move until they stall or stop, and there are many techniques that you can use to identify a trend.
A trend trading system is usually relatively simple but the risk management surrounding these strategies is more complex. A simple moving average strategy such as a moving average crossover strategy, provides traders with a scenario that describes a period when you are in the middle of a trend.
For example, a short-term trend is in place when the 5-day moving average crosses above or below the 20-day moving average. A long-term trend occurs when the 50-day moving average crosses above or below the 200-day moving average. Some of these long-term crossover strategies have names. When the 50-day moving average crosses above the 200-day moving average, a “golden cross” has occurred. When the 50-day moving average crosses below the 200-day moving average, a “death cross” has occurred.
If you are a mean reversion trader, you want to be cognizant of these moving average crossover points, and avoid situations when a currency pair breaks out, and a moving average crossover occurs. You need to be quick to realize that the market environment has changed.
The initial break out can occur when a currency pair pushes through resistance and volatility rises along with volume. Volume in the currency market is tough to measure, but you can use the futures market or currency ETF to gauge volume. It’s important to gauge market conditions that occur when the market breaks down through support or surges higher through resistance when volume is heavy. You must take note of this combination as it usually means the breakout is well subscribed. Following a break out from a tight consolidation is a great time to start initiating a trend trading approach.
Another way to measure a market environment is to evaluate momentum. Momentum is how quickly an exchange rate is accelerating. When markets break out and begin to trend, momentum accelerates. When a currency pair consolidates, momentum generally begins to decline. One way to measure where momentum is accelerating or decelerating is to use a momentum indicator. One of the more widely used is the moving average convergence divergence (MACD) index.
The MACD index uses multiple exponential moving average to determine if the exchange rate of a currency pair is accelerating or decelerating. It does this by comparing the difference between two moving averages relative to a moving average of that difference. A moving average is the average of a price over a certain period. For example, a 5-day moving average averages the past 5-days. On the 6th day, the first day in the calculation if dropped. You can use any price to generate a moving average, but most of the time, the default is the closing price.
The MACD uses an exponential moving average to calculate momentum. An exponential moving, alters a moving average but putting more weight on the current prices and less weight to deferred prices. For example, the calculation of a 20-day exponential moving average, would derive a moving average that is more focused on the last 5-days of the calculation then the prior 15-days.
The most common way to use the MACD is the crossover buy or sell signal. A signal is generated when the MACD line, which is known as the spread, crosses either above or below the MACD signal line which is the moving average of the spread.
Seasonal Tendencies in the Market
Believe it or not, there are times when the markets trade in a specific direction based on the time of year. These are called seasonal tendencies. The seasonality of a financial instrument is usually based on a fundamental reason.
For example, in the late winter and early spring, oil refiners begin to switch their production to summer gasoline, where consumption increases substantially. The summer grade gasoline is more expensive to produce, and generally the price will rise during this period.
You can see in the seasonality chart below, that the performance of gasoline prices over the late winter and early spring is relatively stronger. Over the past 13- years, gasoline prices have increased by 11.4% in February in 12 of the past 13-years.
This information is important especially if you have a mean reverting strategy and decide to trade gasoline. Your mean reversion trading strategy on gasoline prices would probably perform better in June, where the historical seasonal performance is flat.
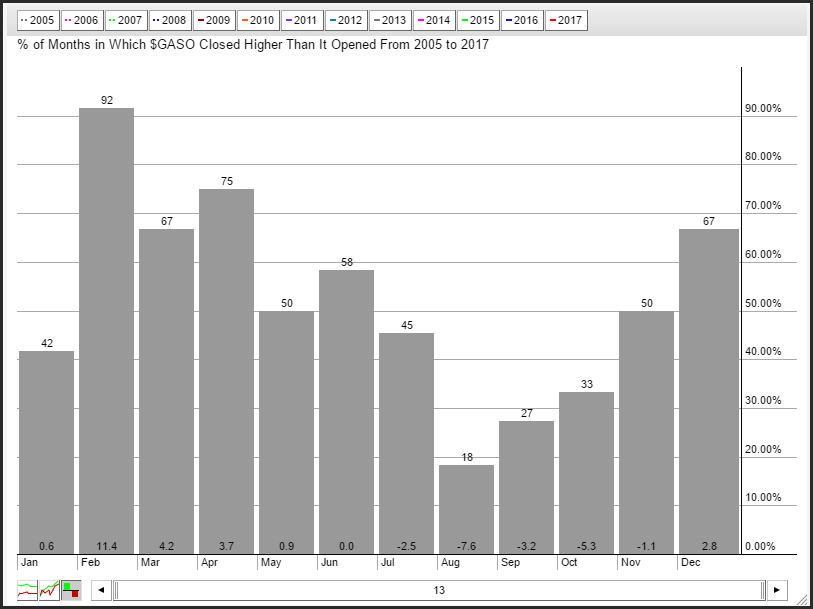
Source- Stockcharts.com
Summary
Most of use spend time developing a trading strategy that is focused on our entry and exit price. Rarely do traders spend much time thinking about how the performance of their strategy will change with different market environments.
The key to adjusting your trading strategy based on the market environment is to understand that there are different market phases. Markets consolidate and are range bound most of the time, and then break out and trend, approximately 30% of the time. It’s important to monitor the type of market environment you’re in, and have a way to determine when the market environment has changed.
You can use a combination of studies to determine if the market is changing. By combining volatility, momentum and seasonality, and watching price action to see if a currency pair is breaking out and starting to trend, you can pinpoint situations when the market environment is changing and have a plan on how you should adjust your approach to the emerging market condition.