Many traders rely on technical indicators and oscillators within their trading methodology. Most of the popular indicators are based on momentum. This includes indicators such as RSI, Stochastics, and MACD. One of the lesser-known momentum based technical indicators is the Williams %R indicator. In this lesson, we will learn all about Williams %R and the best application of it in the markets.
Williams Percent Range Indicator
The Williams %R indicator was developed by Larry Williams, who is a veteran trader and technical analyst. Williams %R is considered a momentum based indicator, and is very similar in its construction to the Stochastics oscillator.
Essentially, Williams %R compares and instruments closing price to its high to low range over a specified period of time. The default time period is 14 days when studying the daily chart, or 14 periods when studying any other timeframe. The primary use of the Williams %R technical study is to measure overbought and oversold levels within the price action.
Williams %R Formula
Williams %R is calculated in the following manner:
Williams Percent R = ( highest high minus close ) / ( highest high minus lowest low )
Wherein:
The highest high is equal to the highest price in the look back period, which is typically set to 14.
The close is equal to the most recent closing price.
The lowest low represents the lowest price within the look back, which is typically set to 14.
Williams %R indicator provides us information on the current price in relation to the highest high over the specified look back, with a default setting of 14.
The overbought zone within the Williams %R indicator falls between the -20 and zero reading. Similarly, the oversold zone within the Williams %R falls between the -80 to -100 reading.
Below you can see a price chart plotted with the Williams %R at the bottom.
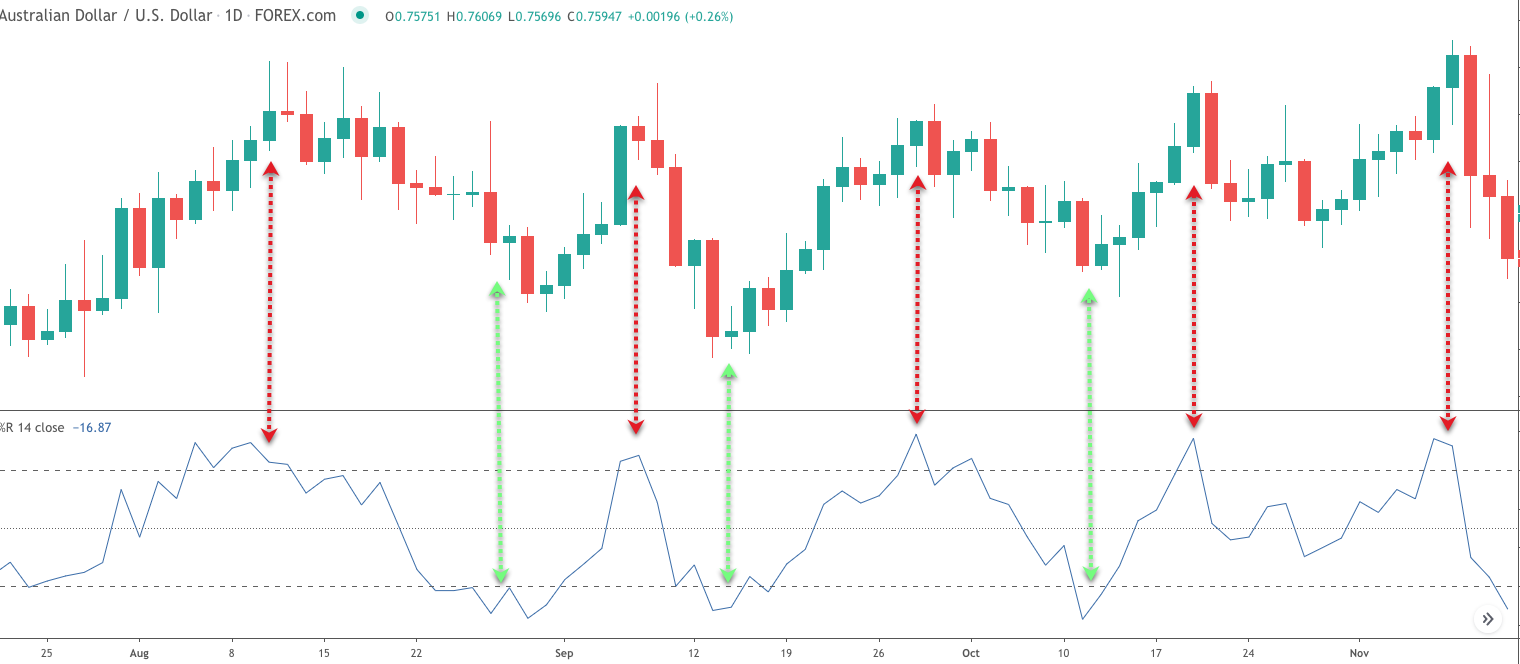
The red arrows correspond to overbought reading in the oscillator, indicating potential selling opportunities, while the green arrows correspond to oversold readings in the oscillator, indicating potential buying opportunities.
There are several different ways to utilize the Williams Percent R indicator within your trading. One of the more popular methods for using Williams %R is as an entry signal as the price pulls back during a trend phase. More specifically, within the context of an uptrend swing traders will often look for a minor decline to enter into the bullish trend phase by waiting for an oversold reading in the Williams %R indicator.
And along the same lines in the context of a downtrend, swing traders will often look for a minor rally to the upside to enter into the bearish trend phase. In this case they would wait for an overbought reading in the Williams %R indicator before executing the short trade entry.
Williams %R Signals
As we’ve touched upon earlier, the Williams %R acts as an oscillator and rotates between the extreme readings of zero and -100. Aside from the scaling, both the fast stochastics and the Williams %R generate the same line within each respective indicator.
There are a few key signals that are provided by the Williams Percent R oscillator.
Here are some of the more common signals:
- A reading above -20 would indicate an overbought market condition, suggesting a potential bearish correction.
- A reading below -80 would indicate an oversold market condition, suggesting a potential bullish correction.
It’s important to keep in mind that when engaging in oversold or overbought signals using the Williams %R indicator, that you have some additional confirmation before entering into a trade. This is because a market can remain overbought or oversold for extended periods of time, and as such it’s prudent to use this indicator in conjunction with some other technical confirmation for increasing the probability of success on a trade.
- A cross above the -50 threshold from below indicates increased bullish momentum, which could result in a price increase.
- A cross below the -50 threshold from above indicates increased bearish momentum, which could result in a price decrease.
The -50 threshold crossing is not as significant a signal as the overbought or oversold reading for the Williams %R indicator. Nevertheless, it is worth watching out for, as it can mark a point where additional demand may enter the market in the case of an upside cross, or additional supply that may enter the market in the case of a downside cross.
Below you can see an example of Williams %R -50 threshold crossings.
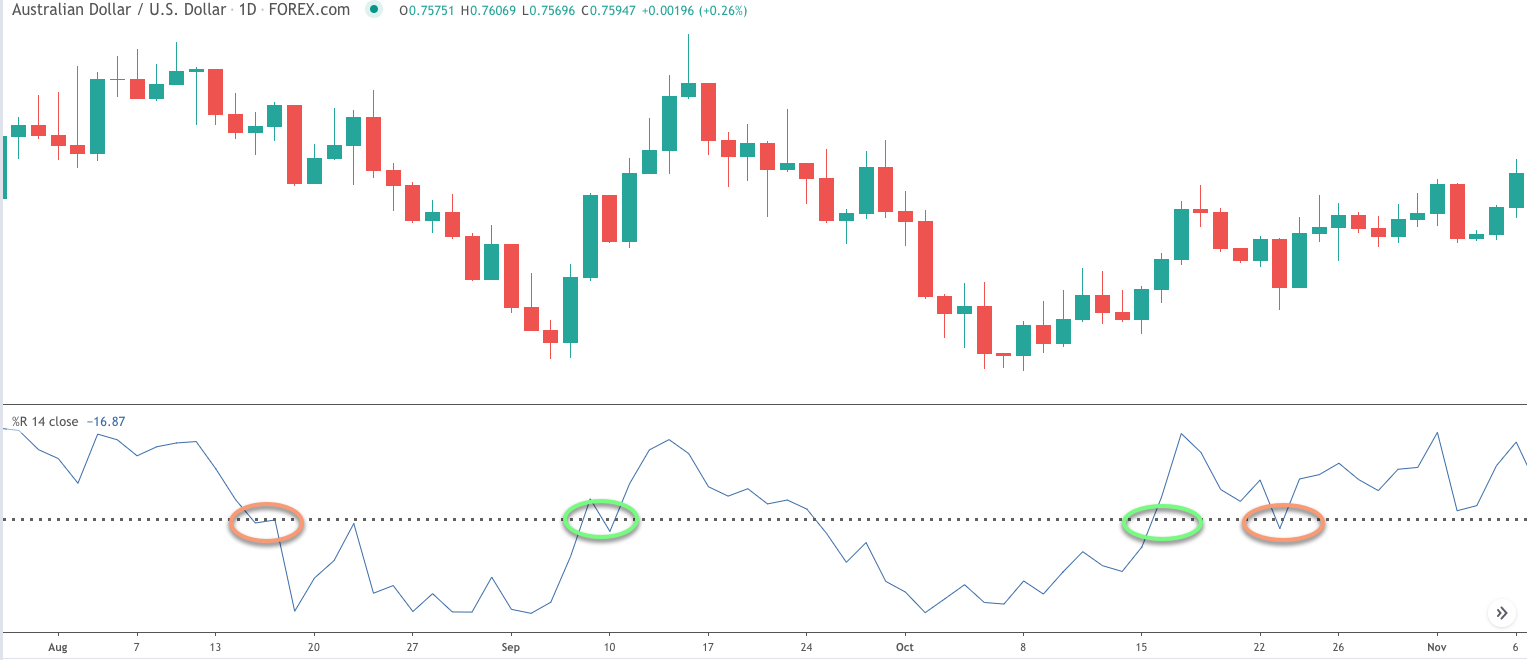
The green circled areas represent a cross above the -50 level to the upside from below. And the orange circled areas represent a cross below the -50 level to the downside from above.
- A regular bullish divergence signal occurs when the price makes a lower low, while the Williams Percent R indicator makes a higher high.
- A regular bearish divergence signal occurs when the price makes a higher high, while the Williams Percent R indicator makes a lower high.
Regular divergence patterns are very powerful trading signals that can foretell a potential reversal in the market. Essentially, a bullish divergence sets up a potential buying opportunity as momentum wanes to the downside.
Similarly a bearish divergence sets up a potential selling opportunity as momentum wanes to the upside. The Williams %R indicator can be used as the momentum based indicator for measuring these types of divergence signals.
Williams %R Trading Strategy
Let’s now try to create a trading strategy built upon the Williams %R indicator. The strategy that we will be describing is a simple pullback trading strategy within the context of a trending phase.
We will utilize a total of three variables as the conditions for entering into this trade set up. The first will be the Williams %R indicator, which we will use the find areas where the market is experiencing a short-term rally within a downtrend, or a short-term decline within an uptrend.
In addition to this, we will utilize the Keltner channel technical study. The Keltner channel is an envelope based indicator that is overlaid on the price chart. It consists of three lines, with the central line being the 20 period Exponential moving average.
The upper line is calculated as the EMA + 2 times the average true range. The lower line is calculated as the EMA – 2 times the average true range. The Keltner channel is a very versatile trading indicator that can be used in a myriad of ways. For our purposes here, we will use it as part of our entry signal and as a trailing stop. There will also be a trend component to this William percent range strategy. That is to say we will need a way to recognize whether the market is trending or is trading in a sideways, range bound manner.
For trend identification, we will be keeping it as simple as possible. Instead of relying on a trend based indicator, we will simply analyze the price action and decide whether the market is in a trending phase or a consolidation phase. If the market is identified as being in a trending phase, then will move forward with the trade evaluation process.
So now that you know the primary components of this trading strategy, let’s go ahead and outline this Williams %R trading strategy in detail.
Below are the conditions and trade management details for entering into a long position using the strategy.
- The Williams %R reading must be in oversold territory. The oversold territory is defined as being between -80 and -100.
- The price action must clearly show that an uptrend is in effect prior to the Williams %R oversold reading.
- The price must be trading below the middle line of the Keltner channel at the time of the Williams %R oversold reading
- Wait for price to close above the middle line of the Keltner channel.
- Enter a long position on the candle following the close above the middle line of the Keltner channel.
- The stoploss should be placed below the recent swing low preceding the long entry.
- The exit will occur when the price closes back below the middle line of the Keltner channel.
Below are the conditions and trade management details for entering into a short position using the strategy.
- The Williams %R reading must be in overbought territory. The overbought territory is defined as being between -20 and 0.
- The price action must clearly show that a downtrend is in effect prior to the Williams %R overbought reading.
- The price must be trading above the middle line of the Keltner channel at the time of the Williams %R overbought reading.
- Wait for price to close below the middle line of the Keltner channel.
- Enter a short position on the candle following the close below the middle line of the Keltner channel.
- The stoploss should be placed above the recent swing high preceding the short entry.
- The exit will occur when the price closes back above the middle line of the Keltner channel.
Williams %R Strategy on Euro Futures
Now that we’ve outlined the rules for this Williams percent range strategy, let’s turn to an example to see how it looks like in action. Below you’ll find the eight hour chart of the Euro FX futures that trades at the CME.
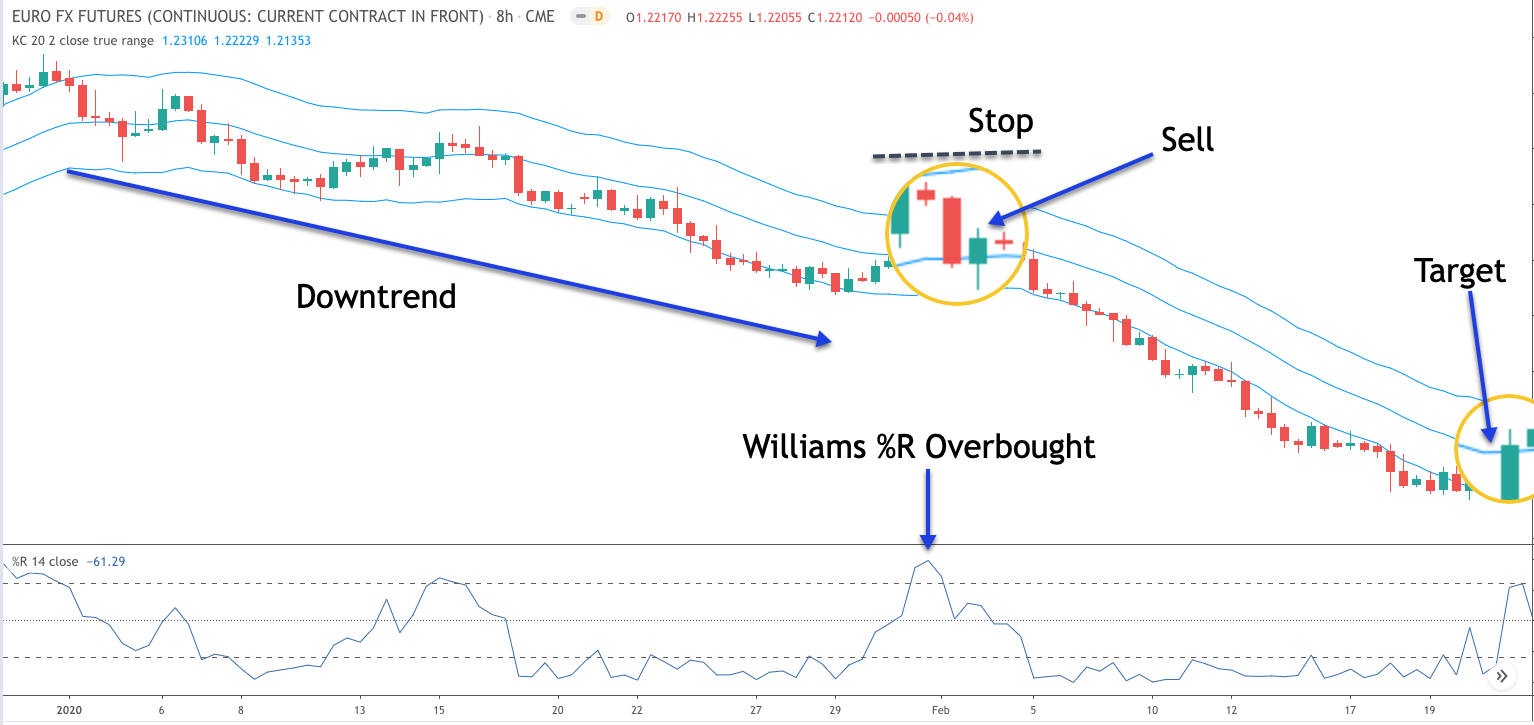
The three blue lines that overlay the price represents the Keltner channel bands. For this strategy, will be focusing on the middle line primarily. The Williams percent R oscillator is shown at the bottom pane below the price. The upper dotted line on the Williams %R shows the minimum threshold for the overbought reading. The lower dotted line shows the minimum threshold for the oversold reading.
Towards the center right on this price chart you can see that an overbought reading registered on the Williams %R oscillator. Notice how the %R line crosses above the upper dotted line showing that the price is entering into an overbought zone.
In order for us to consider a possible short trading opportunity here, we must confirm that the price action leading up to this overbought reading displays a bearish market trend.
If you look at the price action leading up to this overbought reading, and the downward pointing blue arrow, we can clearly see that there was a downtrend in place. And so, our trend filter has been met in this case. Now in addition to this, we want to confirm that at the time of the Williams %R overbought reading, that the price was trading above the center line of the Keltner channel. This too can be confirmed and is shown within the magnified area near the center of the chart.
With these conditions now satisfied, we can prepare for a short trade in the Euro FX futures. The signal to go short would occur once the price closes back below the center line of the Keltner channel. We can see that there is a strong bearish candle that closed below this critical centerline. As such, the sell entry would be entered at the market at the start of the following bar as shown by the blue arrow labeled, Sell.
Now we will turn to the trade management process. The first thing that we will need to do once our sell order has been executed, is to put a hard stop in the market to protect ourselves in case of an adverse price move to the upside. The stop loss should be set at the swing high preceding the sell entry signal, as illustrated by the dashed black line above the entry.
Finally, we would want to monitor the price action closely, as it begins to move in our favor, which in this case is lower. As we can see immediately following the sell entry signal, the market began to selloff quite sharply which led to prices moving below the lower line of the Keltner channel.
When this happens it’s usually a pretty good sign that the market is experiencing a strong bearish impulse phase. The signal to exit would occur when prices move back above and close above the centerline of the Keltner channel. You can see where that occurred by referring to the blue arrow marked as, Target.
Williams %R Indicator Strategy on USDSGD
Let’s move onto another example that illustrates this trading strategy. This time we will be referring to the USDSGD currency pair. The chart below shows the price action of this pair based on the four hour timeframe.
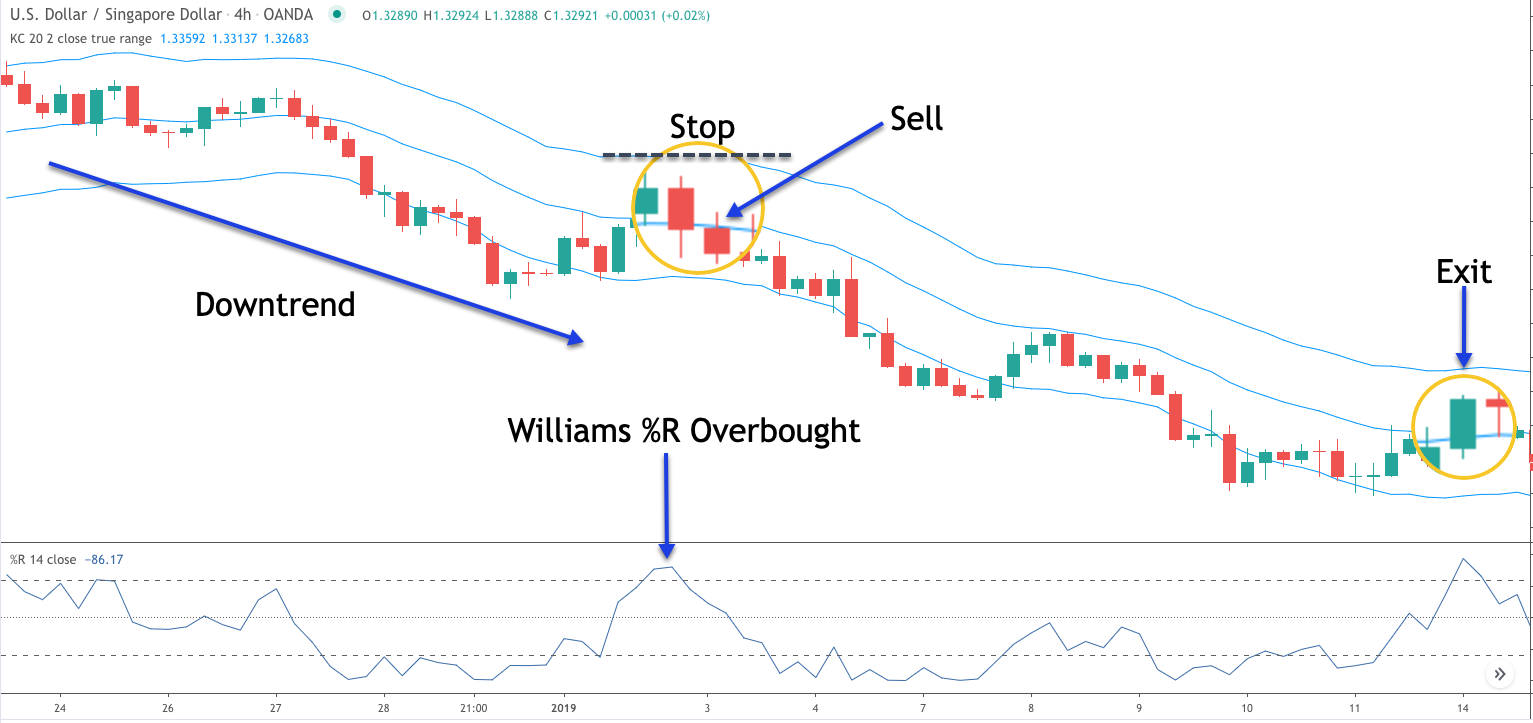
If you glance at the lower portion of this chart, you will see where the Williams percent R oscillator triggers an overbought reading. Notice how the line crosses above the upper threshold. At the same time, we can see that there was downtrend leading to this Williams %R overbought condition.
Finally, you’ll notice that the price was trading above the centerline of the Keltner channel at the time the Williams %R breached the upper threshold. With all of these conditions now being met, we could prepare for a short trade in the USDSGD currency pair.
The actual sell entry will be triggered at the close below the centerline of the Keltner channel. And a market order to sell will be immediately placed at the start of the following candle as can be seen by the blue arrow designated as, Sell.
The stop loss would be placed above the most recent swing high preceding the sell signal. You can see that level marked above by the black dashed line. Now, with the stop loss order in place, we would monitor the price action closely and wait for the exit signal. The exit signal occurs when the price closes above the centerline of the Keltner channel.
As you can see from the price action, there was a nice bearish move that ultimately moved below the lower line of the Keltner channel. This would’ve given us additional confidence that the market was poised for further weakness. The price then made a minor upside retracement, however, it failed to close above the important centerline.
Instead, the market pushed lower and made new lows before beginning to consolidate. After the sideways consolidation, the price began to move higher and eventually was able to cross above the Keltner channel centerline, which would have taken us out of this trade with a profit.
Summary
The Williams %R indicator is a valuable technical study that can be used to find entry points within an uptrend or a downtrend. During this type of trending phase, you would look for a short-term retracement and couple that with an extreme reading on the oscillator. Additionally Williams %R can also be used to trade range bound markets in a similar fashion.
Either way, traders should take some caution when implementing the Williams %R indicator. Although it is helpful in gauging potential shifts in momentum and possible price reversals, you should always use the Williams %R signal in conjunction with additional technical studies to get the best use from it.