There are four primary trading horizons that Forex traders typically fall into. This includes the ultra-short-term scalping timeframe, the intraday day trading timeframe, the intermediate swing trading timeframe, and the longer-term position trading timeframe. In this lesson, we will focus on learning all about the swing trading timeframe.
What Is Swing Trading?
There is some confusion as to what the term swing trading refers to, so let’s start off by clearly defining and understanding what we mean by a swing trading approach. The term swing trading refers to a generalized timeframe in which a trader regularly executes their specific trade setups. In the conventional sense, a swing trader is said to hold onto a position for several days up to several weeks. As such, it is a trading horizon longer than the day trading timeframe, and one which is shorter than the position trading timeframe.
Swing traders seek to profit from intermediate-term price swings. This is in contrast to trend traders who seek to capture longer-term price trends. Swing traders typically prefer to trade in and out of larger trend structures rather than hold onto a position for an extended duration of time. Although most swing traders are fairly active in the market, they are not nearly as active as day traders or scalpers, who are likely to take multiple positions intraday and prefer to be flat at the end of each trading session.
Because of the characteristics noted, swing traders will gravitate towards trading timeframes such as the daily chart, the eight hour chart, and the four hour chart. Additionally, unlike trend traders who can have a relatively wide and asymmetrical reward to risk profile on their trades, swing traders on the other hand will often work with a much more conservative RVR. For example, a trend trader may risk $500 with a profit potential of $2000 or even higher. That would equate to a 4 to 1 or higher reward to risk profile. Swing traders on the other hand will often only realize reward to risk profiles of 3 to 1, 2 to 1 or sometimes a bit lower.
Another characteristic that is quite common among swing traders is that a large majority utilize technical analysis as their primary market analysis approach. Since this group of traders tends to trade minor to intermediate price swings, it makes sense that they have a greater reliance on market timing via technical analysis.
Swing Trader Time Frame
As we’ve touched upon briefly earlier, the primary timeframe that swing traders use to scan for trade setups is the daily, eight hour, or four hour charts. Having said that, it’s important consider a multi-timeframe analysis approach when executing any type of trade set up. A multi-timeframe analysis method usually incorporates a top-down analysis methodology.
So the clarify further, a swing trader who utilizes the daily chart as their primary trading timeframe to scan for their trade setups, should confirm that the next larger timeframe chart, in this case, the weekly chart, is in alignment with their trade set up. After which, it is recommended that the trader zoom into the next lower timeframe from your trading timeframe, which in this case would be a four hour chart, to fine-tune the trade entry.
The main take away here regarding multi-timeframe analysis is, regardless of the specific trading timeframe that you utilize for finding your trade setups, you should always confirm the bigger picture by going to the next higher timeframe. In addition, you should refer to the next lower timeframe from your trading timeframe to pinpoint the best entry point.
Here are some combinations of swing trading time frames, and the associated higher timeframe for trend analysis, and lower timeframe for fine-tuning entries.
- Swing trading timeframe – daily chart
- Trend analysis – weekly chart
- Trade entry execution – 240 minute chart
- Swing trading timeframe – 480 minute chart
- Trend analysis – daily chart
- Trade entry execution – two hours chart
- Swing trading timeframe – 240 minute chart
- Trend analysis – daily chart
- Trade entry execution – 60 minute chart
- Swing trading timeframe – 120 minute chart
- Trend analysis – 480 minute chart
- Trade entry execution – 30 minute chart
Depending on your specific swing trading methodology, you may need to revise this a bit. But generally speaking, the above outlined swing trading time frames are the ones that you will likely focus on for the most part. They are the most widely watched among swing traders, and thus offer the best clues as to what other traders are thinking and positioning themselves. Personally, the best forex swing trading signals that I see come from the daily chart.
 Best Forex Pairs For Swing Trading
Now that we’ve taken some time understanding the forex market and defining what swing trading is, let’s now discuss what the best currency pairs are for this style of trading.
Before we reveal the best pairs to utilize within an FX swing trading approach, let’s take a moment to understand the characteristics that create an ideal swing trading environment. As swing traders, we want to trade those instruments that have a high level of trading activity in terms of volume and thus offer great liquidity. Additionally, we want to ensure that the currency pair has sufficient volatility. We can measure a currency pair’s volatility using a technical study such as the Average Daily Range, ADR, or the Average True Range, ATR.
Liquidity is important because it provides us the ability to trade in and out of our positions with minimal slippage cost or market impact. The most liquid forex instruments include the major currency pairs, and a few cross currency pairs. As for the requirement that are chosen instrument have a sufficient amount of volatility, what that essentially means is that we want to ensure that the instrument has enough movement for a trade to make sense. This condition will further narrow the prospect list.
Below are the five best Forex pairs for swing trading based on having both high liquidity, and high volatility characteristics.
EURUSD – This is the most liquid currency pair within the foreign exchange market. It is widely traded throughout the globe, and the price movements within this pair make it ideal for a swing trading approach.
GBPUSD – The British Pound to US Dollar currency pair is very actively traded. It often has a strong correlation to the EURUSD currency pair.
AUDUSD – This is a favorite among traders in Australia and the Far East. It’s a very stable currency pair and is sometimes heavily influenced by commodity prices.
EURJPY – This is a very liquid cross currency pair that is often characterized with large daily price swings which can sometimes exceed 200 pips. It is a favorite among more active swing traders looking to capture short-term price trends.
GBPJPY – The Pound to Yen currency pair is highly volatile, and is most active during the European and Asian sessions. The broker spreads on this pair tend to be a bit higher than the others mentioned above, but it’s daily range is more than sufficient to compensate for that.
Benefits Of Swing Trading
There are many benefits to a swing trading approach, and it’s a great starting point for those interested in getting engaged in the currency markets. Let’s take a look at a few of the most beneficial aspects of a swing trading methodology.
Minimal Time Commitment – Most swing trading strategies can be managed in less than an hour a day. This is something that is hard to grasp for many beginning traders, but it is certainly true if you have a focused process in place. When you’re generating your trade setups from the relatively higher time frames, your day-to-day market analysis will not change much. It’s mostly a matter of being patient and waiting for the right trading set ups to emerge, and then having the conviction to execute on them.
Lower Transaction Costs – Many forex swing trading systems will only trade several times per week. As such, you can expect to generate approximately 75 to 150 trades per year. This is the normal range of activity for most swing traders. Compare that to day traders who will routinely take several trades per day. This can result in anywhere from several hundred to even a thousand trades or more per year. When you factor in the total transaction costs including the indirect costs of bid ask spreads, slippage, and commissions, a swing trading methodology will clearly be less expensive.
More Reliable Trade Setups – With a swing trading approach, you will be focusing on holding positions for as little as a few days to as long as a few weeks. The price patterns that occur on the various swing trading time frames are much more reliable compared to those that occur on both the smaller day trading timeframe, and the larger position trading timeframe. The day trading timeframe is filled with noise which can make it extremely difficult to trade efficiently. The position trading timeframe can be heavily influenced by both fundamental and geopolitical factors which can also make it more challenging.
More Types Of Strategies To Test – The majority of long-term position trading systems tend to be trend following in nature. They will typically look for some sort of momentum breakout, and seek to enter in the direction of the breakout for a potential trend move. Many daytrading systems are based on a volatility breakout methodology, or some sort of mean reversion technique based on short-term sentiment extremes. Swing traders will find that there are many different types of trading styles, and methodologies that they can study and use to build their own customized swing trading EA or model.
Swing Trading Forex Using Price Action
There are many different swing trading indicators and tools that can be employed. Some of these technical indicators are momentum based, others volume-based, or sentiment based to name just a few types. And there are countless variations that can be studied and tested.
Some traders, however, prefer to keep it simple and rely exclusively on price action analysis. Price action trading is a timeless market analysis technique and one that is very well suited to the swing trading time frames.
So what exactly is price action analysis? Essentially, when we speak of a price action method we are referring to a market analysis approach wherein we are studying price and it’s resulting patterns on either the bar or candlestick chart. As you may be aware, most trading indicators are derivatives of price itself, and thus the information that we gather from such indicators has a delayed or lagging effect. As such, it’s often best to rely directly on the price itself for executing potential trade setups.
Let’s discuss a few simple components of a swing trading approach based on price action.
Horizontal Support and Resistance – Support represents a key price level below the current price. It’s an area where we should expect demand to enter the market, which could lead to either a minor stall or possibly a reversal to the upside. Resistance represents a key level above the current price. It is a level where we could expect to see supply enter the market, which may lead to a minor stall or possibly a reversal to the downside.
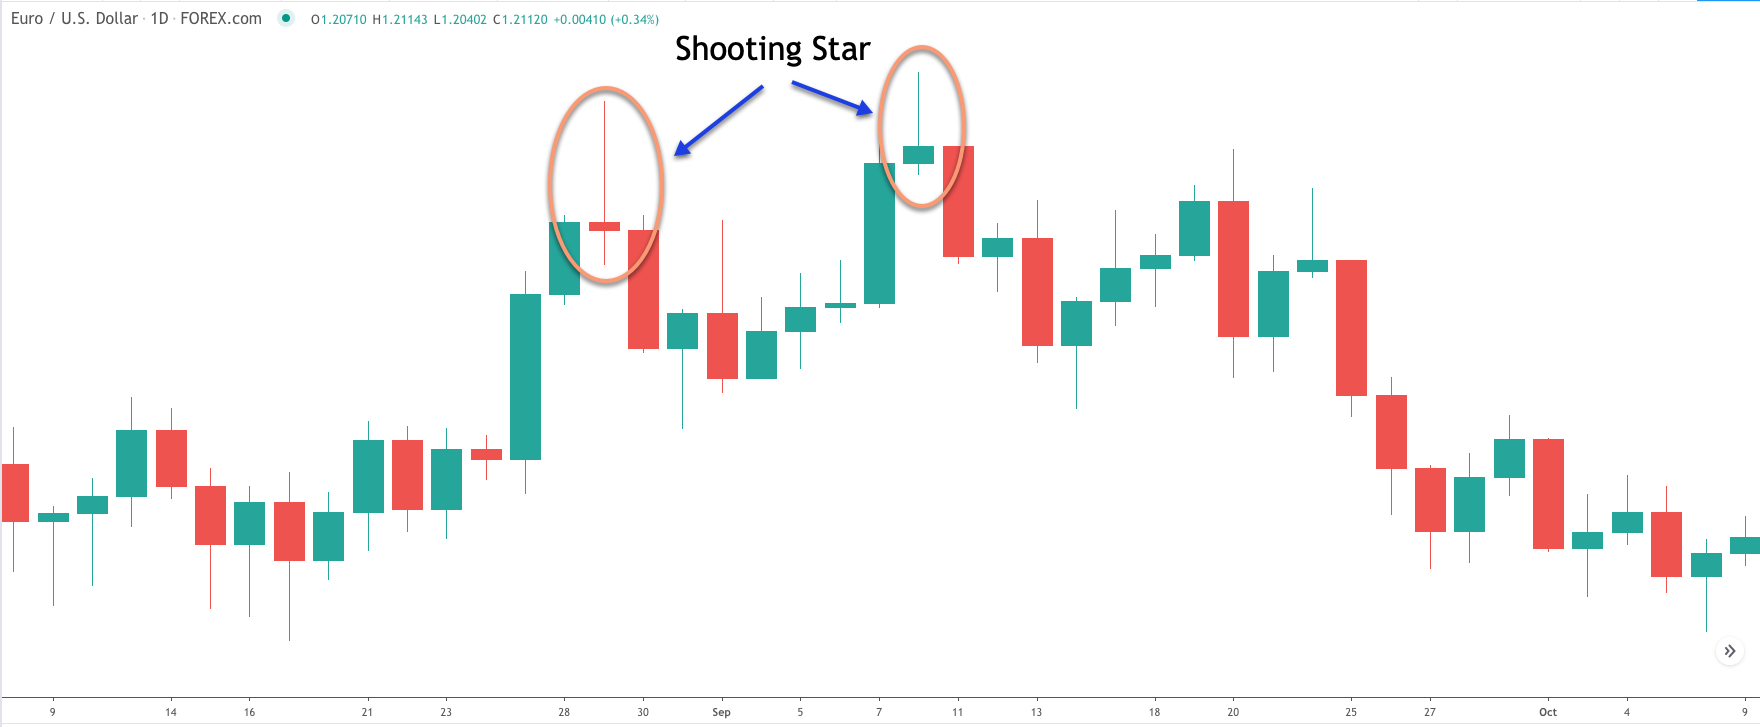
Candlestick Patterns – In his classic trading book entitled “Japanese Candlestick Charting Techniques”, Steve Nison illustrates scores of different candlestick patterns that are often seen within the financial markets. Candlestick patterns are usually one, two, or three candle formations that can provide short-term clues into future price action.
Below are a few examples of the shooting star candlestick pattern, which has a bearish implication.
Price Gaps – In the Forex market, price gaps are most often seen at the start of the trading week. This is because the foreign exchange market is open 24 hours a day, 5 days a week. And thus it’s usually after the weekend where a major price imbalance can lead to an opening gap up or gap down price move.
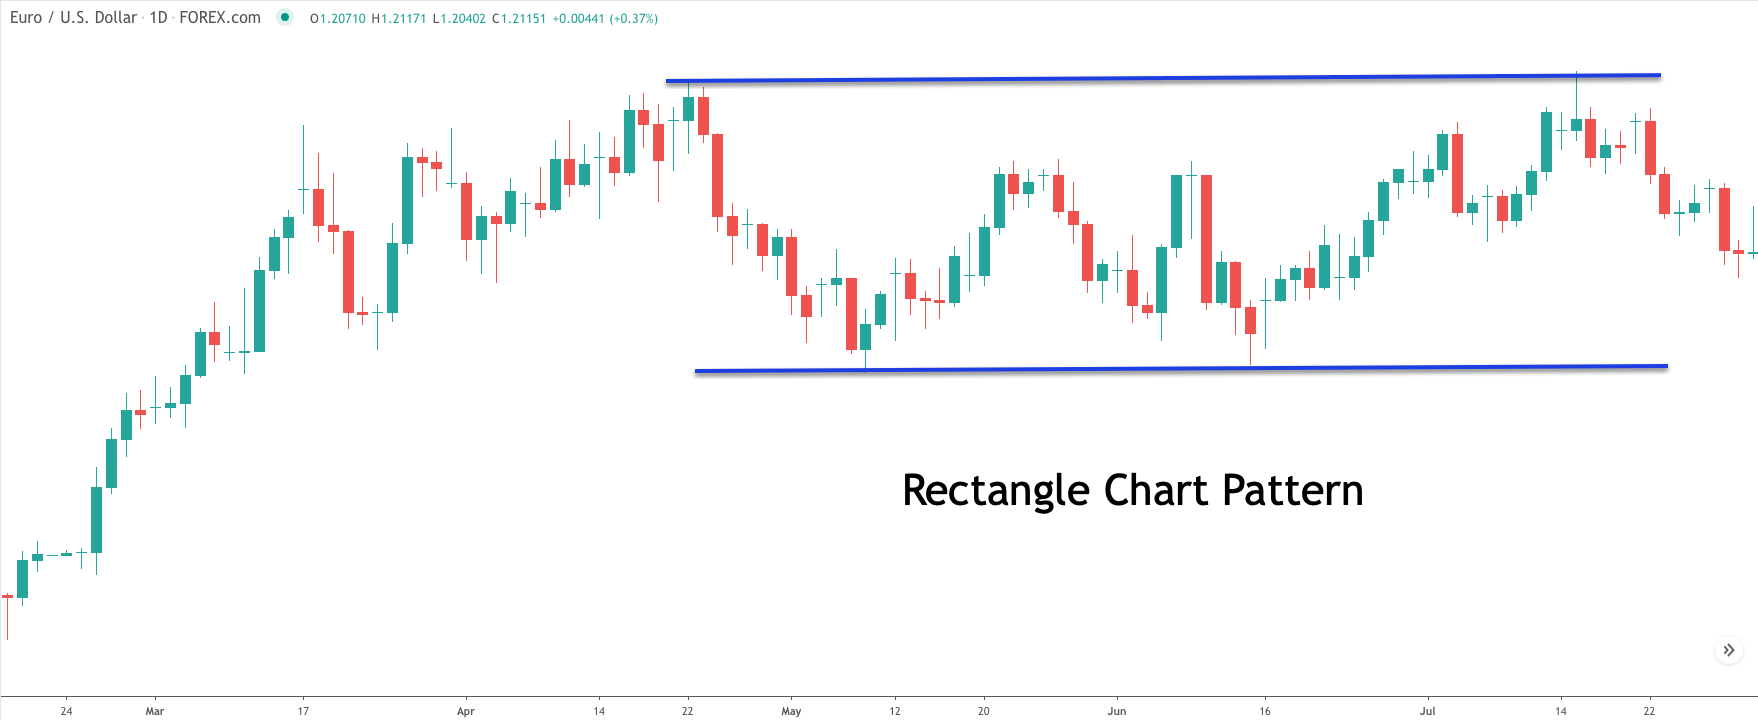
Chart Patterns – Classical chart patterns such as rectangles, triangles, pennants, and flags are still some of the most reliable formations that FX and CFD swing traders use. In addition to classical chart patterns, there are other chart patterns based on harmonic Fibonacci relationships. These include the Gartley pattern, Bat pattern, Crab pattern, and Butterfly pattern to name just a few. Below is an example of a rectangle chart pattern.
Forex Swing Trading Strategy
In this section, we will describe a swing trade strategy that incorporates a very specific chart pattern. The formation that I referring to is the Bat pattern. The Bat pattern is a pattern within the harmonic family of patterns. It is a reversal pattern that is often seen within the Forex market. It is a particularly reliable set up when it occurs on a major currency pair or cross currency pair.
The Bat pattern consists of four distinct legs labeled the XA leg, AB leg, BC leg, and the CD leg. Within the structure the AB leg should retrace the XA leg by either the 38% or 50% retracement level. The extreme of point C should be contained within the extreme of point A.
Additionally, the entire move from A to D should retrace the XA leg by approximately 88%. Although there are other Fibonacci relationships as well that exist within this pattern, these are the major requirements of the Bat pattern formation.
The expectation is once the price reaches the D point of the structure, there should be a reversal in the market. More specifically, in the case of a bearish Bat pattern, prices should trade up to the D point and reverse from there. Conversely, if the structure is a bullish Bat pattern, prices should trade down to the D point and reverse from there.
This strategy is best applied to the major currency pairs, and should be traded on either the 240 minute, 480 minute or daily timeframe.
So here are the rules for swing trading a bearish Bat pattern:
- Locate a potential bearish Bat pattern, and confirm that the B point is close to either the 38% or 50% retracement of the XA leg.
- As price moves within the CD leg, enter a limit order to sell at the 86% retracement level of the XA leg.
- A stop loss should be placed one pip above the swing high at point X.
- The target should be placed one pip above the swing high at point B.
- If the target or stop loss is not reached within 35 candles following the entry, then exit the trade on the 36th candle.
These are the rules for swing trading a bullish Bat pattern:
- Locate a potential bullish Bat pattern, and confirm that the B point is close to either the 38% or 50% retracement of the XA leg.
- As price moves within the CD leg, enter a limit order to buy at the 86% retracement level of the XA leg.
- A stop loss should be placed one pip below the swing low of point X.
- The target should be placed one pip below the swing high at point B.
- If the target or stop loss is not reached within 35 candles following the entry, then exit the trade on the 36th candle.
Currency Swing Trading Example
Now that we have outlined the rules for the swing trading strategy based on the Bat pattern, let’s illustrate the mechanics of the strategy on an actual price chart. Below you will see the price chart for the EURUSD currency pair based on the eight hour timeframe.
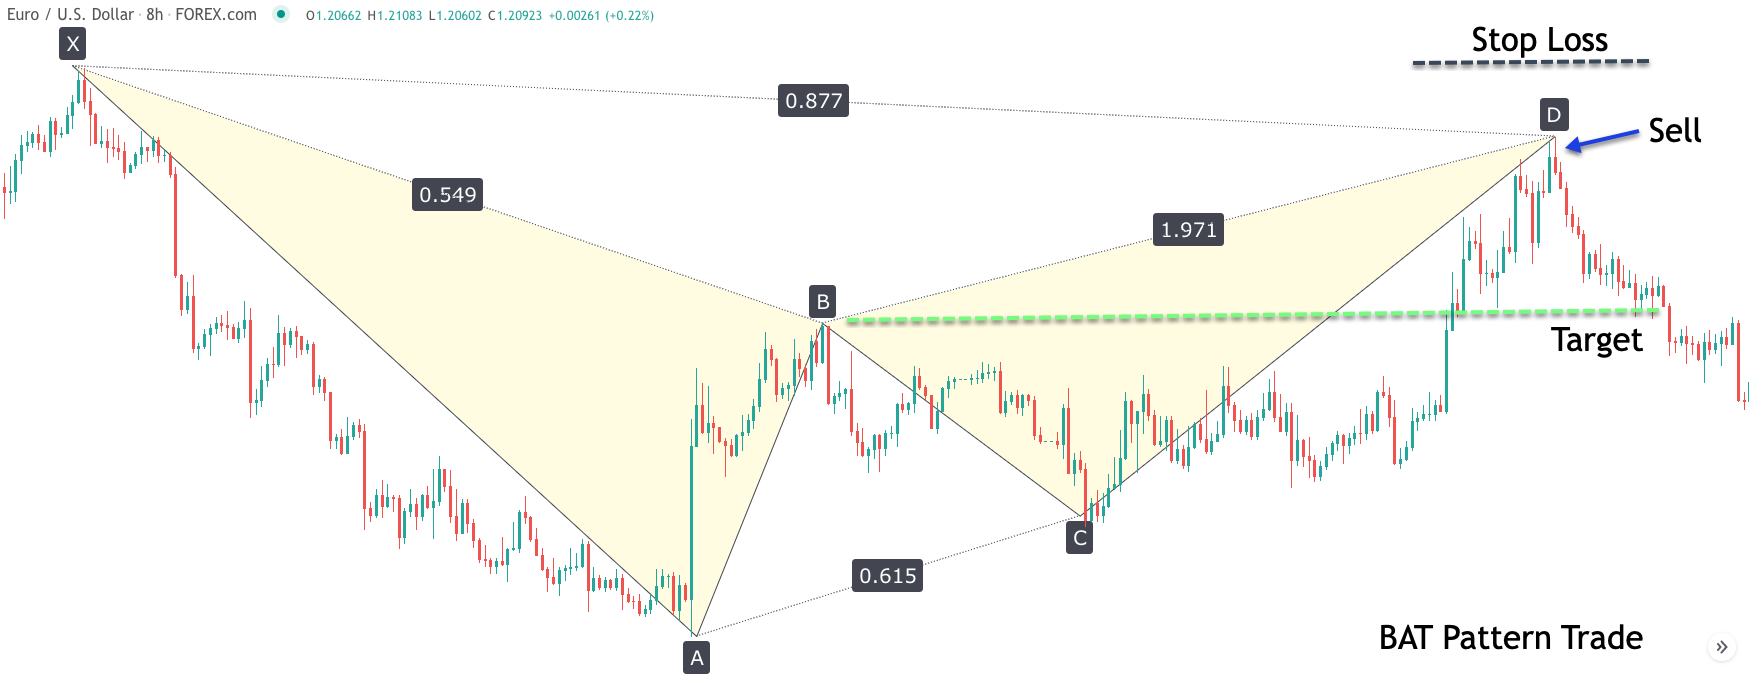
You can see the bearish Bat pattern highlighted here. Notice the four legs that comprise this formation. The first is the XA leg which moves lower, and then the AB leg which retraces the XA leg. Then, the BC leg moves lower to retrace the AB leg. Finally you can see the CD leg move higher as it retraces the entire move from point X to point A.
Once we have recognized a potential Bat pattern on the price chart, will need to validate the pattern by looking at the important relationships within the structure. Firstly, we like to make sure that the B point is at or near either the 38% retracement level or the 50% retracement level.
Looking at the chart once again, we can see that the B point ended at approximately the 54% retracement level. Although this is not the ideal Fibonacci retracement for point B, it is nevertheless close enough for us to validate the pattern and consider it a potentially tradable opportunity.
As the price was moving higher within the CD leg and we were able to confirm the B point, we would want to prepare for a potential short trade opportunity. Based on the Bat structure, we would expect the CD leg to terminate at or near the 88% retracement level of the XA leg. This is the ideal termination point for point D within the structure, and represents an excellent area for entering into the position.
Based on our trading rules, we prefer to leave a little bit of leeway in our entry level to compensate for the pattern falling short of the ideal 88% level. As such we would enter a short position here at the 86% retracement level. You can see that sell entry order marked on the chart.
As soon as our sell entry order was triggered, we would shift our attention to the trade management rules. And those rules call for the stop loss to be placed just one PIP above the swing high of the X point. This is represented by the black dashed line above the sell entry. In addition, we will set a hard target in the market as well. And that level will be set at a level that represents one PIP above the swing high of the B point, which is shown by the green dashed line below the entry signal.
Now it’s also important to remember that this Bat strategy calls for a time stop. That is to say that if after our entry order has been initiated, the price does not reach either our stoploss or target level within 35 bars, then we will need to close out the trade on the following 36th bar.
The reason that we have introduced this time stop into the strategy is because the price should react quickly and sharply at point D of this specific pattern. If it does not, then the probability of success on the trade begins to diminish. As such, our 35 bar rule provides sufficient time for the trade to materialize. And it certainly did in this case resulting in the price reaching our intended target before the 35 bar threshold.
Closing Thoughts
By now, you should have a good understanding of what fx swing trading is, and whether or not it’s a type of trading style that suits your personality. Though we have not touched upon selecting a trading style that aligns with your own psychology, it is of utmost importance. If you would like to explore the idea of swing trading further, you should start by demo trading your ideas, and make sure that you are at least profitable in your practice trading account before you commit funds to a live account.