The Keltner channel indicator belongs to a family of technical analysis tools called envelop indicators. Envelop indicators like Keltner channel uses one lower band and one upper band to create a dynamic channel around the price range of a financial instrument. Regardless of whether the asset is trading upwards, downwards, or sideways, envelop indicators can help define upper resistance and lower support levels.
A Keltner bands strategy can be a very powerful part of a technical trader’s arsenal. However, knowing how to use a Keltner channel trading strategy appropriately based on the asset’s price action and market context is the key to developing a successful Keltner band trading strategy.
Before we dive into explaining the inner workings of a Keltner channel trading system and discuss how to use Keltner channels, you should learn the basics of how to read any envelop based technical indicator first. Unless you fully understand the variables behind a technical indicator, you will not be able to fully comprehend what types of market conditions the indicator can work best in or how to apply the indicator to fit your trading strategy.
Understanding the Keltner Channel Formula
Keltner channel was introduced to the trading arena by a technical analyst named Chester W. Keltner, who first described the indicator in his book How to Make Money in Commodities, which was published in 1960. He initially used 10-day Keltner moving average bands to calculate the middle band of the Keltner channel instead of the modern variety that uses a 20-period exponential moving average in the Keltner channel settings.
In fact, the modern variety of Keltner channel, found as a built-in technical indicator in popular charting software, is the brainchild of world-renowned commodities and futures trader, Linda Bradford Raschke, who is the Founder and President of money management firm LBRGroup, Inc.
The Keltner channel calculation could be easily summarized with the following formula:
Middle Band = 20-Period Exponential Moving Average Value
Upper Channel = 20-Period Exponential Moving Average Value + Multiplied Value of Average True Range
Lower Channel = 20-Period Exponential Moving Average Value + Multiplied Value of Average True Range
You see, the current version of the Keltner channel is comprised by combining two separate technical indicators. The first component of the Keltner channel is a 20-period exponential moving average, which acts as the middle band. The second element of the Keltner channel is a multiplied value of the Average True Range (ATR) indicator, which is commonly set at a value of 2. This means that the upper and lower channels are always at a 2x ATR distance from the 20-period Exponential Moving Average middle band.
Unlike simple moving average (SMA), the Exponential Moving Average emphasizes recent price movement. Since the Exponential Moving Average reacts faster to the changing directional movement of the price, the Keltner channel can provide an accurate overall direction of the trend by smoothing the price action.
As you can imagine, the more volatile a Forex pair is, the wider the upper and lower channels will appear from the middle band. Therefore, experienced Forex traders often change the default Exponential Moving Average period of the Keltner channel and set it within the range of 10 to 40 to best match the currency pair’s historical price action characteristics.
In contrast, the Average True Range indicator measures the “average volatility” of the Forex pair based on a predefined number of periods, where the default look back timeframe is often set at the last 14-periods. However, depending on the charting software and availability of indicator settings, you can also change the ATR look back period in order to tweak the Keltner channel indicator further, since the price action and volatility of each Forex pair is unique.
Hence, you can make minor tweaks in its settings to fit a particular currency pair. However, most beginning and novice traders should stick to using the default Keltner channel settings until they have gained sufficient experience trading with Keltner channels.
Interpreting Envelop Based Technical Indicator Signals Like Keltner Channel
Besides the Keltner channel, several other popular technical indicators fit the description of envelop based indicators. For example, the Bollinger Band indicator is another popular example in this family of trading indicators.
The practical trading application of most envelop based indicators are quite similar, but depending on the particular indicator’s formula, the dynamic channels can represent a wide variety of interpretation of the asset’s price action.
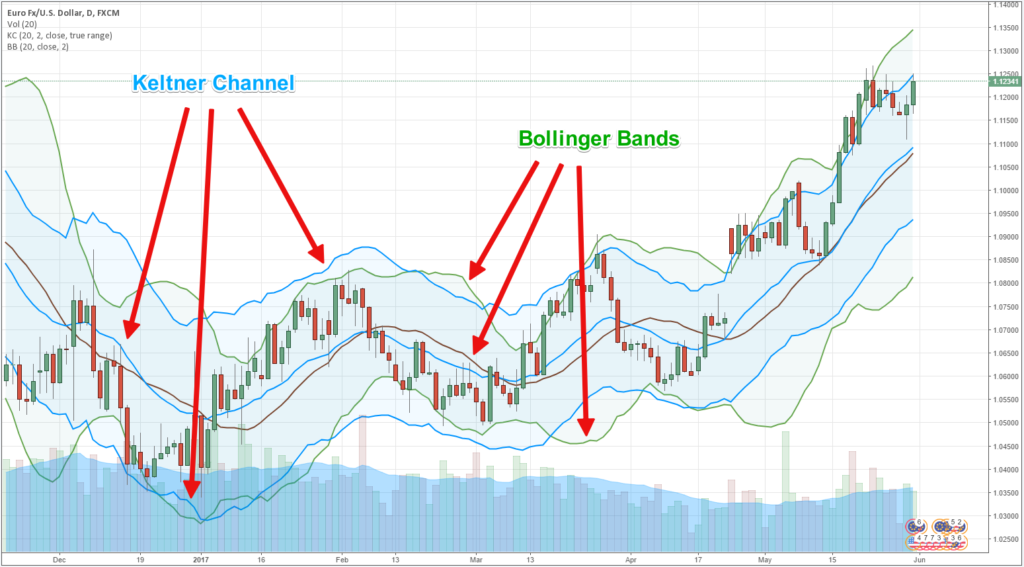
Figure 1: Keltner Channels and Bollinger Bands are Among the Most Popular Envelop Based Technical Indicators
For instance, while both Bollinger Bands and Keltner channels draw channels around the price range, the main difference between these two indicators is how the upper and lower, as well as the middle channel values are calculated. As demonstrated in Figure 1, the Bollinger Band indicator uses a 20-period simple moving average for the middle band and draws its channels or upper and lower bands at a distance of 2 standard deviations from the middle band. On the other hand, the middle band of Keltner channel calculation is based on a 20-period exponential moving average, where the upper and lower channels are drawn at an equal distance from an Average True Range value multiplier.
Unlike the Average True Range used in the Keltner channel, the standard deviation value of the Bollinger Band does not represent an average, and it creates more sharp edges on the chart. Hence, some Forex traders prefer the Keltner channel over the Bollinger Band, as it draws smoother channels that can sometimes offer higher quality signals.
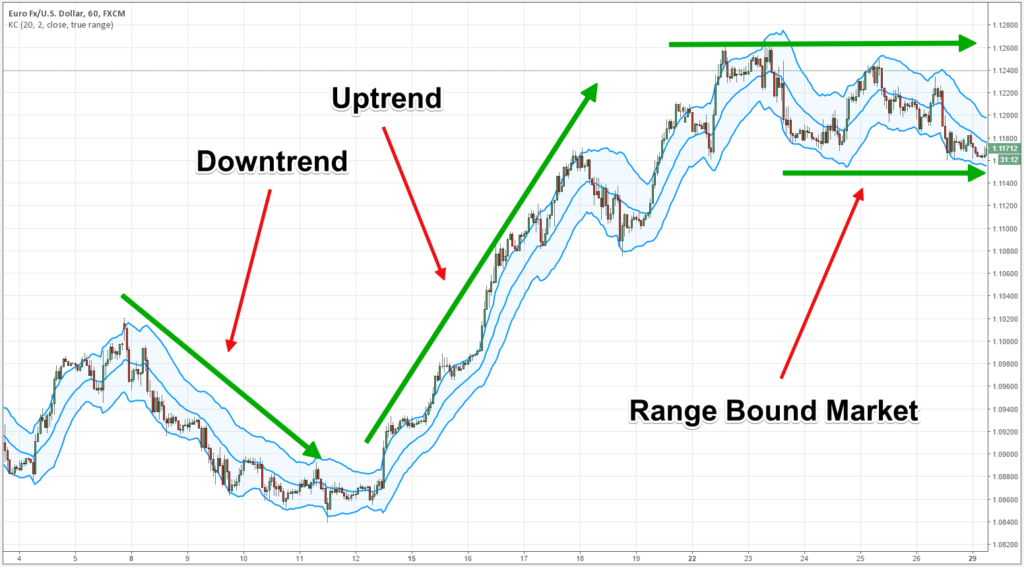
Figure 2: Keltner Channels Can Provide Overall Market Outlook and Generate Trading Signals
When the upper and lower channels of the envelop family of indicators move in an upward direction where the price continuously trades near the upper channel, Forex traders interpret this signal as an upward trending market condition. By contrast, when the channels are moving in a downward direction and the price continuously trades near the lower channel, the market is considered to be a downward trending market condition. However, when the Keltner channels remain flat, and the price starts bouncing between the upper and lower channels without showing any directional tendency, Forex traders consider such market condition as a consolidating or range bound market.
Currency price movements can typically stall and even tend to range for a brief period of time during uptrends and downtrends. During minor pullbacks that resume the prevailing trend, envelop based technical indicators help Forex traders recognize entry opportunities to add new or additional positions in the direction of the underlying trend.
Many times, you can quickly identify if the market is in an uptrend or downtrend, or consolidating within a range just by taking a look at the Keltner channels. Then depending on the underlying conditions, you would incorporate a Keltner channel trading strategy best suited for the particular market situation.
As discussed earlier, the upper and lower Keltner channels are always plotted at an equal distance from the 20-period Exponential Moving Average. As these channel extremes represent a multiplier of the average volatility of the currency pair, when the price goes above or below the Keltner channels, it signifies that the market is trading outside of the average or normal price range.
Forex traders can interpret such a market condition as a signal of a reversing trend or the start of a new trend depending on the price action and momentum around these dynamic S/R levels. However, if the Keltner channels remain flat and the price trades within the upper and lower bands of the Keltner channels without penetrating above or below, it signifies that the market is range bound.
One of the best aspects of the Keltner channel is that it not only provides traders with an overall technical market outlook about the on-going trend, but it can also signal a potential trend reversal when the price reverses and crosses the opposite channel. Using a Keltner channel strategy, you can generate actionable entry and exit trade signals that can offer a solid reward to risk ratio.
Examples of Trading Forex with a Keltner Channel Strategy
Many experienced FX traders prefer to combine multiple uncorrelated technical signals to confirm the trend before placing their live trade orders. When you are trading with a Keltner channel strategy, you should try to apply an additional technical indicator to bolster the strength of the Keltner signal.
In the following three examples, we will discuss how you can trade three different market conditions by combining a second technical indicator and build a comprehensive Keltner channel trading system.
Example of Using Keltner Channel for Trading Breakouts
One of the best applications of Keltner channel in Forex is using the indicator to trade breakouts. Breakouts occur when the price ends a previous consolidation and starts a new trend.
However, if you only rely on the Keltner channel to trade breakouts, you may find that you are seeing a lot of false signals. The best way to trade a breakout scenario with the Keltner channel would be to combine a trend signal indicator like the Average Directional Index (ADX).
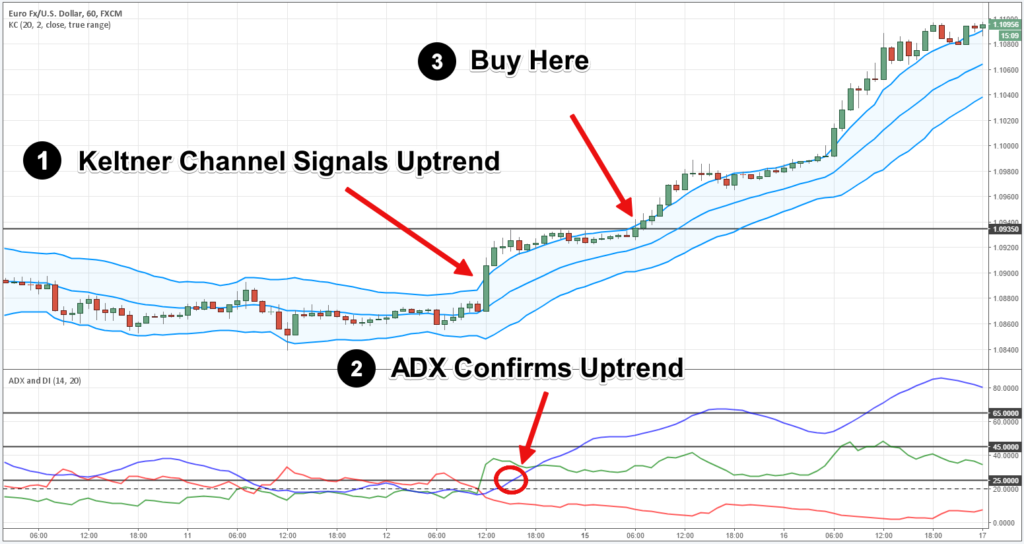
Figure 3 : Trading Breakouts with Keltner Channel and Average Directional Index
In figure 3, the EUR/USD price first broke out of the upper Keltner channel, which signaled that the previous consolidation period may have come to an end. However, savvy Forex traders would not merely place a BUY order at this point because the Average Directional Index indicator value (Blue line) was still below the reading of 25.
Many experienced Forex traders only consider a market to be trending when the Average Directional Index reading is above 20 to 25, and where the trend intensifies when the ADX indicator reading goes above 40 to 45 level.
Hence, once the Average Directional Index reading reached above the 25 level, then you could have considered placing the BUY order with your broker.
The trickiest part of trading breakouts using a Keltner channel strategy is to know exactly when you should time your market entry. You should try to identify a psychological resistance level during an uptrend and a support level during a downtrend, once the following two conditions are met.
- The price has penetrated and closed above the Upper channel or closed below the lower channel and started an uptrend or downtrend.
- Average Directional Index confirms the start of the trend by showing a reading above 25
On this occasion, we found the resistance to be around the 1.0935 level. If you had placed a BUY order once the EUR/USD price penetrated above the 1.0935 level, this trade would have proved to be a winner.
Example of Using Keltner Channel to Trade Retracement Pullbacks
Aside from breakout opportunities, the Keltner channel can also provide you with retracement signals. Moreover, if you are already in the trade, you can also use these retracement pullback opportunities to increase your position size.
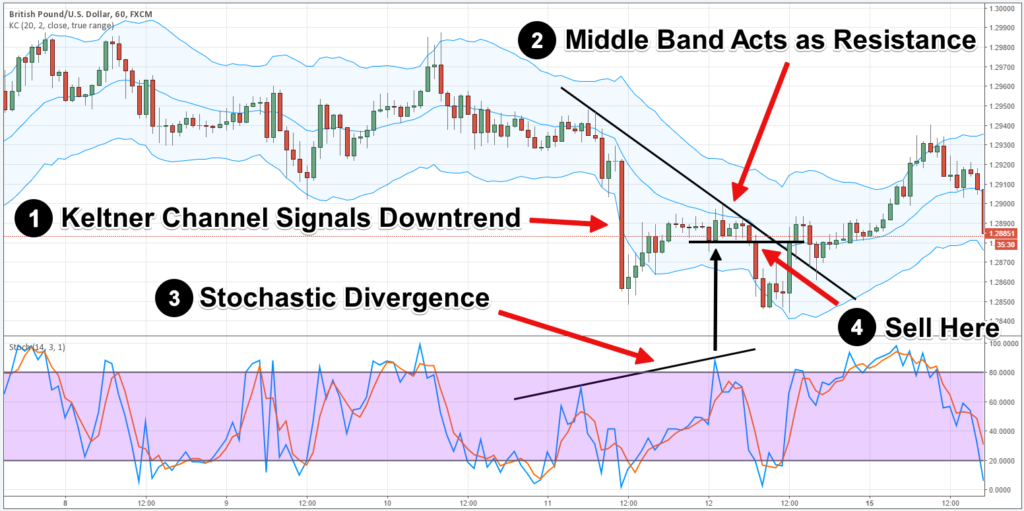
Figure 4: Trading Pullbacks with Keltner Channel and Stochastic Divergence
In figure 4, we have applied the Stochastic indicator in combination with Keltner channel to find a retracement pullback trading opportunity. To trade using this strategy, first, you need to wait for the price to confirm the trend by breaking above or below the upper or lower Keltner channel. On this instance, the GBP/USD price broke below the lower Keltner channel and signaled a downtrend.
Once the trend is confirmed, you should wait for the price to start a retracement and reach near the middle band of the Keltner channel, which is the 20-period Exponential Moving Average. The price can retrace back and reach all the way to opposite Keltner channel as well at times. The key here is that the price cannot break and close on the other side of the Keltner channel, which would signal a potential reversal of the trade.
The third thing you need to watch in this pullback strategy is the Stochastic indicator reading to gauge when the market is overbought or oversold. Here, the price reached near the middle band of the Keltner channel and the Stochastic indicator turned overbought, signaling a potential trend continuation to the downside.
In addition to that, we also found a stochastic divergence on the price chart, which significantly improved the odds of the trade. However, it is not necessary that you wait for a stochastic divergence to use this Keltner channel strategy. A stochastic overbought signal during a confirmed downtrend would be sufficient to confirm a potential trend continuation.
The trigger for this Keltner channel pullback strategy is a price penetration below the low of the bar that signaled the stochastic overbought condition. As you can see, we have identified this particular bar with the black arrow on figure 4. If you have placed a SELL order as soon as the GBP/USD price penetrated below the low of this bar, this trade would have yielded some handsome profits.
Example of Using Keltner Channel During a Range Bound Market
Besides trending markets, if you are looking to trade during a range bound market, you can still utilize the Keltner channel and Average Directional Index combination. The beautiful thing about combining these two indicators is that during a consolidation period, the upper and lower Keltner channels will act as resistance and support, where the Average Directional Index will confirm if the market is ranging or a new trend is likely to take place.
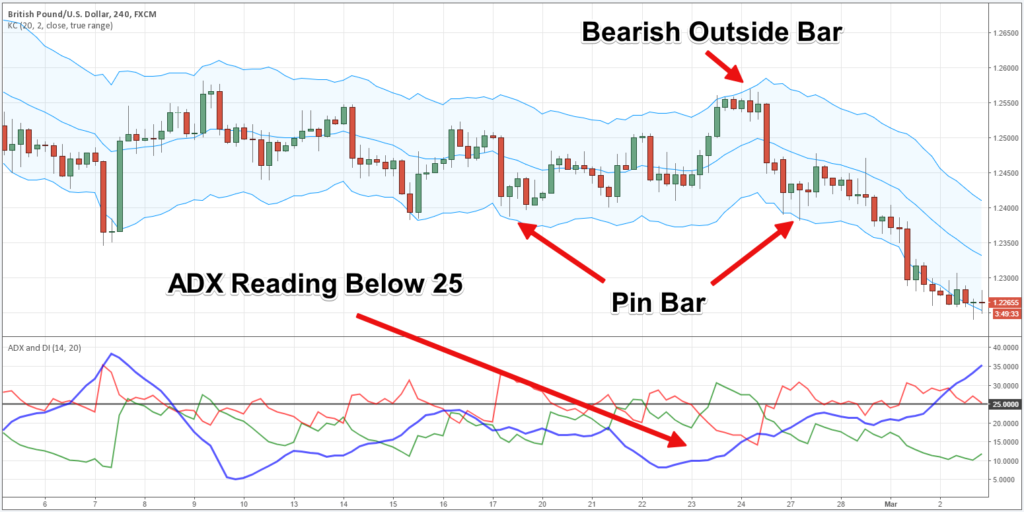
Figure 5: Trading a Ranging Market with Keltner Channel, Average Directional Index, and Price Action Bars
On figure 5, you can see that the GBP/USD price was trading sideways and the Keltner channels acted as support and resistance levels. As the Average Directional Index indicator reading remained below the 25 level, it confirmed that there is no underlying directional movement or trend in the market.
Such market condition constituted a textbook sideways or ranging market, and it provided a trade opportunity if you knew how to read price action bars. On two occasions, the GBP/USD produced two bullish pin bars after coming close to the lower Keltner channel, which acted as support. Moreover, the GBP/USD formed a bearish outside bar after coming close to the upper Keltner channel, which acted as resistance. If you had placed an order when the GBP/USD price broke these three price action bars, as identified with red arrows in figure 5, at least the first two out of three of these trades would have turned out to be profitable.
Conclusion
Like other envelop based technical indicators, Keltner channel has its positive points and shortcomings. However, if you spend some time understanding the formula behind the indicator and combine it with other technical indicators to develop a trading strategy fit for different market conditions, such trading systems can generate positive returns to your bottom line.
It is worth noting that as of this writing, the popular Forex charting software MetaTrader 4 platform does not include any built-in indicator for plotting the Keltner channels. In order to draw mt4 Keltner channel, you can opt to download a third-party developed Keltner channel indicator. There are several versions of the Keltner channel indicator readily available for downloading at the official forum of MetaTrader 4 platform, the MQL4 Programming Forum. Furthermore, you can also search for a custom Keltner channel indicator at various popular Forex forums, such as on ForexFactory forums.