Prices within all major financial markets tend to move in a fairly predictable manner. This is all described within the context of the Elliott wave principle. Essentially, the market is composed of what are known as impulsive price moves, and corrective price moves.
Knowing which stage the market is currently in will allow a trader to isolate the highest probability trade setups, and make better trade management decisions.
Elliott Wave Impulse Pattern
Motive waves refer to price moves that occur in the direction of the larger trend. There are two types of motive waves within the Elliott wave theory. The first is called the impulse pattern, and the second is called the diagonal pattern.
The diagonal pattern comprises of what are known as leading and ending diagonals. The more prevalent structure seen within the financial markets is the impulse pattern. It occurs much more frequently than either of the other two types of motive waves described.
The impulse structure can be seen as consisting of a total of five price moves, or waves as they are typically referred within the context of the Elliott wave theory.
Again, the impulse structure moves in the direction of the larger trend, and is easily recognizable once you know what to look for.
Below you can see the impulse structure.
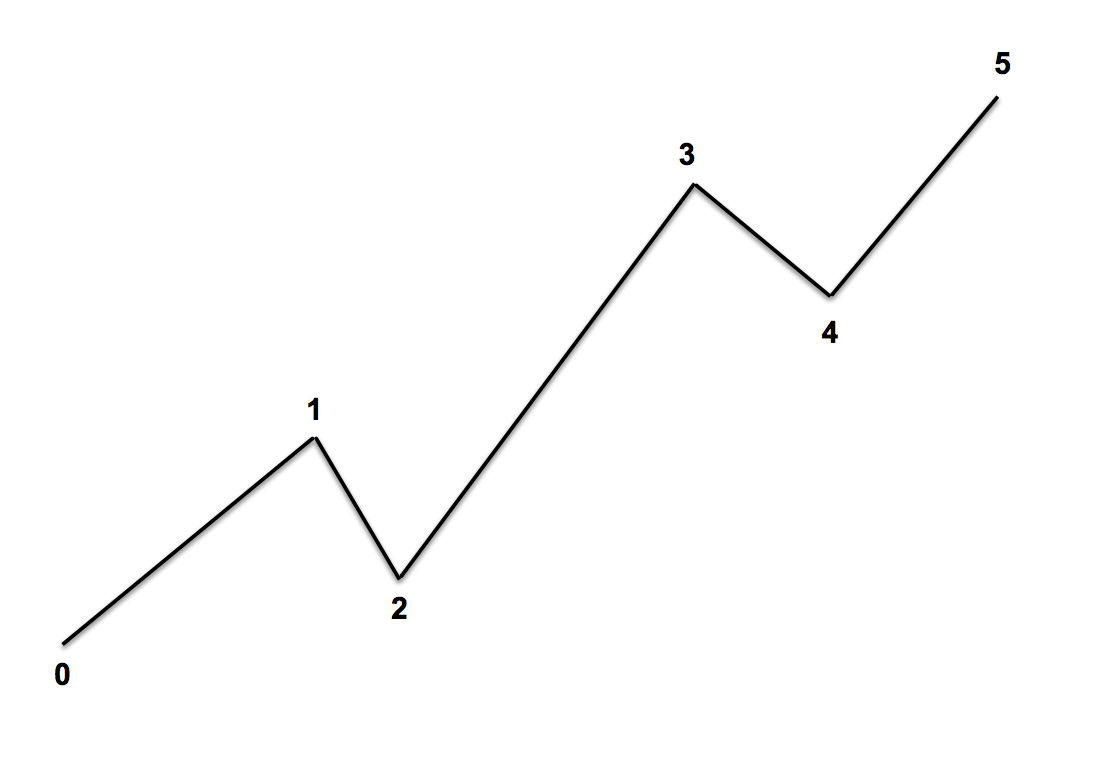
The image above shows an illustration of a bullish impulse sequence. This entire structure often starts near a major swing low, and that point is referred to as the start of Elliott impulse wave 1. As price moves higher in wave 1, it is often associated with a bear market rally. That is to say that the market has been in a relatively long downtrend prior to the upward price thrust in wave one. As such, most traders and investors believe this to be a minor retracement within the context of the downtrend.
When wave one ends, it will lead to a price move lower in wave two that will retrace a portion of the wave one move. However, wave two will not fall below the start of wave one. This is an extremely important rule within Elliott wave and one that can never be violated.
Wave two will often be a deep retracement to wave one. Typically we will see a 61 to 78% fib retracement within the wave two correction. After wave two complete, prices will begin to move higher once again. When the price breaches the top of wave one, more and more traders will begin to position to the long side, and start exiting much of their prior short positions. This will help propel price higher within wave three, and the momentum seen in this wave will be stronger than any other wave within the entire impulse sequence. We will often see parabolic style moves in wave three or price gaps in the direction of the wave three price move.
Elliott impulse wave 3 often ends at a 1.618 Fibonacci projection of wave 1. That is to say that the length of wave three is often 1.618 times the length of wave one. Once wave three ends, it will be followed by wave four which has characteristics of sideways price movement. The correction within wave four will be relatively shallow but the duration of the correction can be quite extended. Wave four is often associated with profit-taking, as those who made money in wave one and three, are now booking their profits.
The final wave within the impulse structure is wave five. Elliott impulse wave 5 will be less dynamic than wave three, and often we will see momentum divergences occur between wave three and five. This is because the wave five price move higher will be much more sluggish then the wave three move earlier. Wave five has a strong relationship to wave one. More specifically, the termination of wave five will often be correlated to the length of wave one. That is to say that wave five will terminate at a level at which it is equal in length to wave one.
Elliott Wave Corrective Patterns
The complete Elliott wave cycle consists of five waves of the impulse sequence, and three waves of the corrective sequence. As such, one completed Elliott wave cycle is often referred to as a completed 5-3 cycle. We’ve looked at what the Elliott impulse pattern appears as, now let’s discuss the corrective forms within the Elliott wave theory.
There are many more corrective wave patterns than motive wave patterns. The three primary types of corrections include the zigzag correction, flat correction, and the triangle correction. Additionally, these three corrective patterns can combine to form more complex corrective structures.
If you have spent some time scanning the various price charts, you will have noticed that there are periods within the price action that appear as trending legs where a good amount of directional price movement occurs. These directional price moves are typically impulsive in nature, and as such can be classified as impulse price structures. Now, after an impulse phase ends, it will be followed by a corrective phase.
Corrective phases appear as pauses within the directional price move. More specifically, corrective structures will retrace a portion of the prior impulse move. And these corrections can appear to be prolonged sideways forms, or can be seen as a sharper retracement against the prior impulse leg.
Below you can see a price chart that shows what an impulse move versus a corrective move appears like.
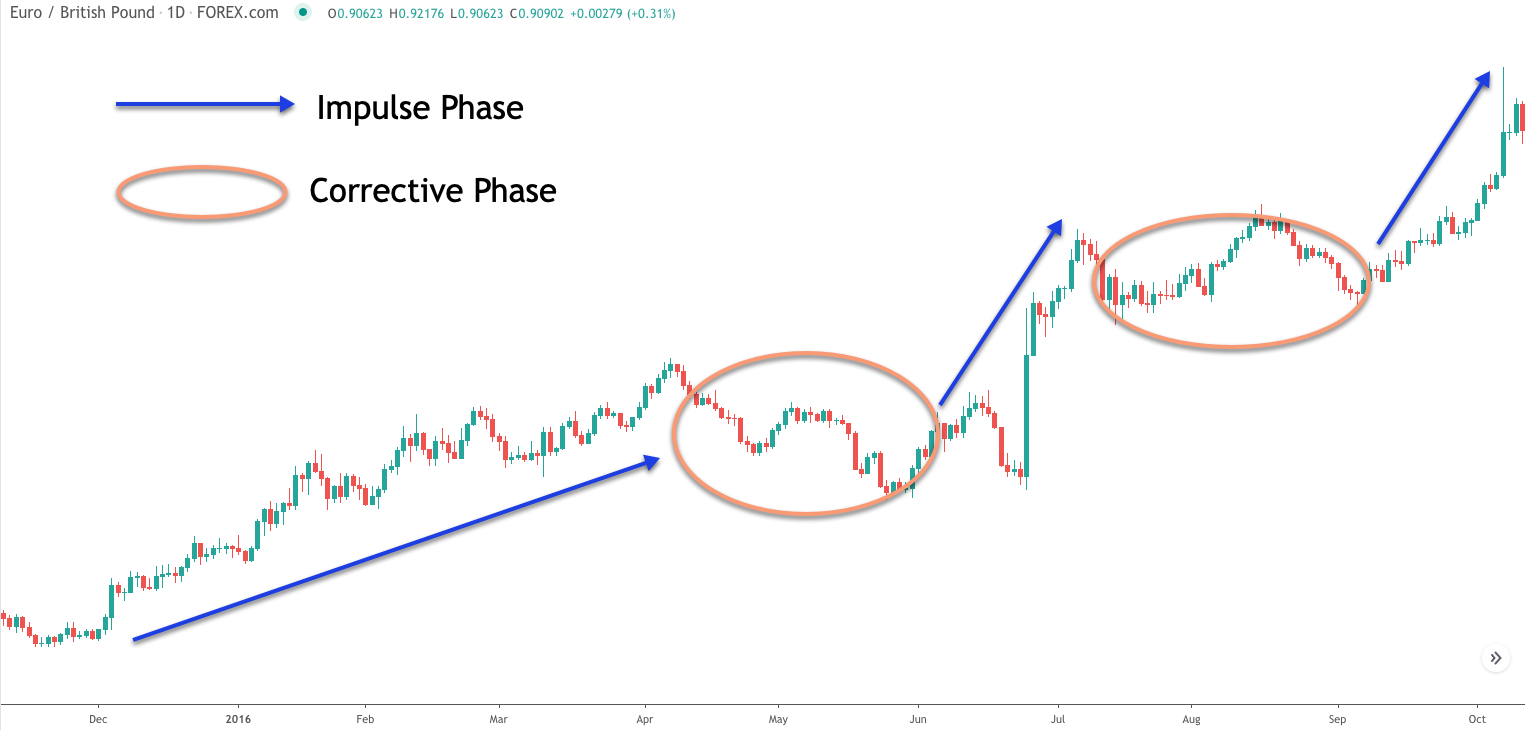
Notice the up trending market condition on the chart above. The blue arrow represents impulsive price action, which corresponds to one way directional price movement, in this case to the upside. Notice that following these impulsive price legs there are countertrend price moves that act to correct a portion of the gains made within the impulsive price legs. These countertrend price moves are what are referred to as corrective patterns within the context of Elliott wave. The price action within the orange circled areas represents these corrective price moves. As soon as the correction ends, price continues to move higher as it enters into the next leg within the impulse phase.
Zigzag Elliott Wave Pattern
Let’s now start detailing the Elliott wave correction rules. The first type of corrective structure that we will be looking at is called the zigzag pattern. This zigzag corrective pattern is one of the more prevalent formations seen within the markets. It is considered a simple ABC correction. It appears as a lightning bolt formation with three distinct price legs labelled as A,B,and C.
Below you can see an example of the Zigzag corrective pattern.
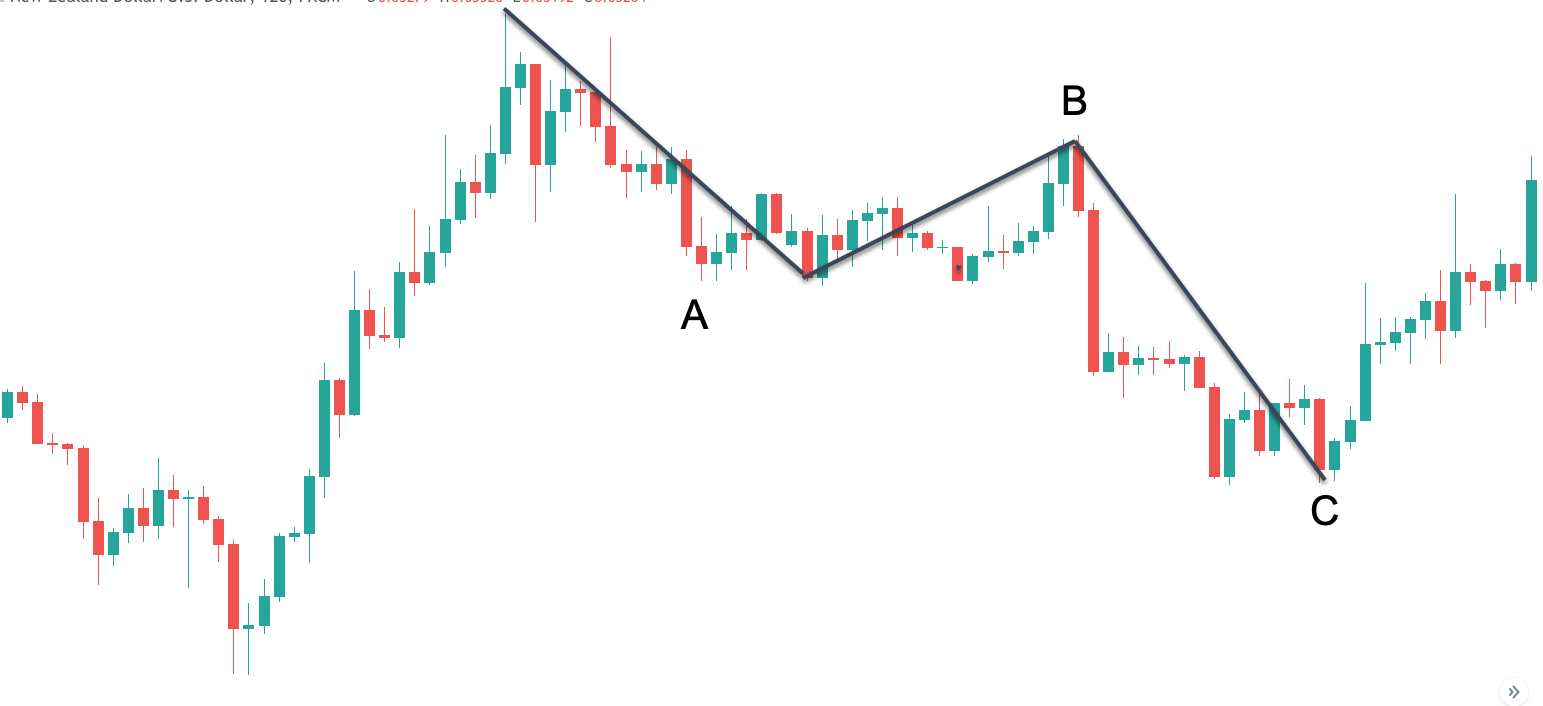
This zigzag pattern represents a bearish correction. As you can see here, the zigzag formation consists of three legs labeled as A, B, and C. Notice from the swing low near the far left of this price chart, that there was a strong impulsive price move to the upside. Following that, we can see a three wave correction against that impulse structure. This entire three wave sequence to the downside constitutes the zigzag pattern.
Notice how wave A of the zigzag pattern moves lower against the prior leg, followed by wave B of the zigzag pattern which moves counter to wave A. Finally wave C moves in the same direction as wave A. Wave C will move quite a distance below the swing low seen at Wave A.
The zigzag pattern will often be a sharp retracement against the trend as can be seen in this example. Additionally, wave A and C within the zigzag are often of equal length. Following the termination of wave C within a bearish zigzag correction, prices will begin to move higher as the new impulse phase begins. Keep in mind that what we are describing here is a zigzag pattern as a bearish correction. Zigzag patterns will also appear as bullish corrections in the context of a larger downtrend.
Another important feature of the zigzag correction is that it is a 5-3-5 formation. That is to say that wave A within the zigzag will subdivide into five smaller waves, wave B within the zigzag will subdivide into three smaller waves, and wave C within the zigzag will subdivide into five smaller waves. As such, if you were to zoom in on this zigzag pattern by going to a smaller timeframe chart, you would be able to recognize this 5-3-5 internal structure.
Elliott Wave Flat Correction
Along with the zigzag, the Elliott wave flat correction occurs quite frequently in the market. The flat corrective structure can be classified as either a regular flat, an expanded flat, or a running flat.
Each of these flat formations has the same implication. That is to say that a flat formation that appears as a bearish corrective will lead to a price move higher after the completion of the pattern. Similarly, a flat formation that appears as a bullish corrective will lead to a price move lower after the completion of the pattern.
The regular flat can be seen as a three wave affair labeled ABC, similarly to the zigzag pattern illustrated earlier. However, within the regular flat pattern the B wave will terminate near the start of wave A, and wave C will extend just beyond the end of wave A.
The subdivision within all flat patterns is a 3-3-5. That is to say that wave A will subdivide into three smaller waves, wave B will subdivide into three smaller waves, and wave C will subdivide into five smaller waves. Note that this is different from the zigzag structure which subdivides as a 5-3-5 structure.
Let’s look at an example of the regular flat corrective pattern.
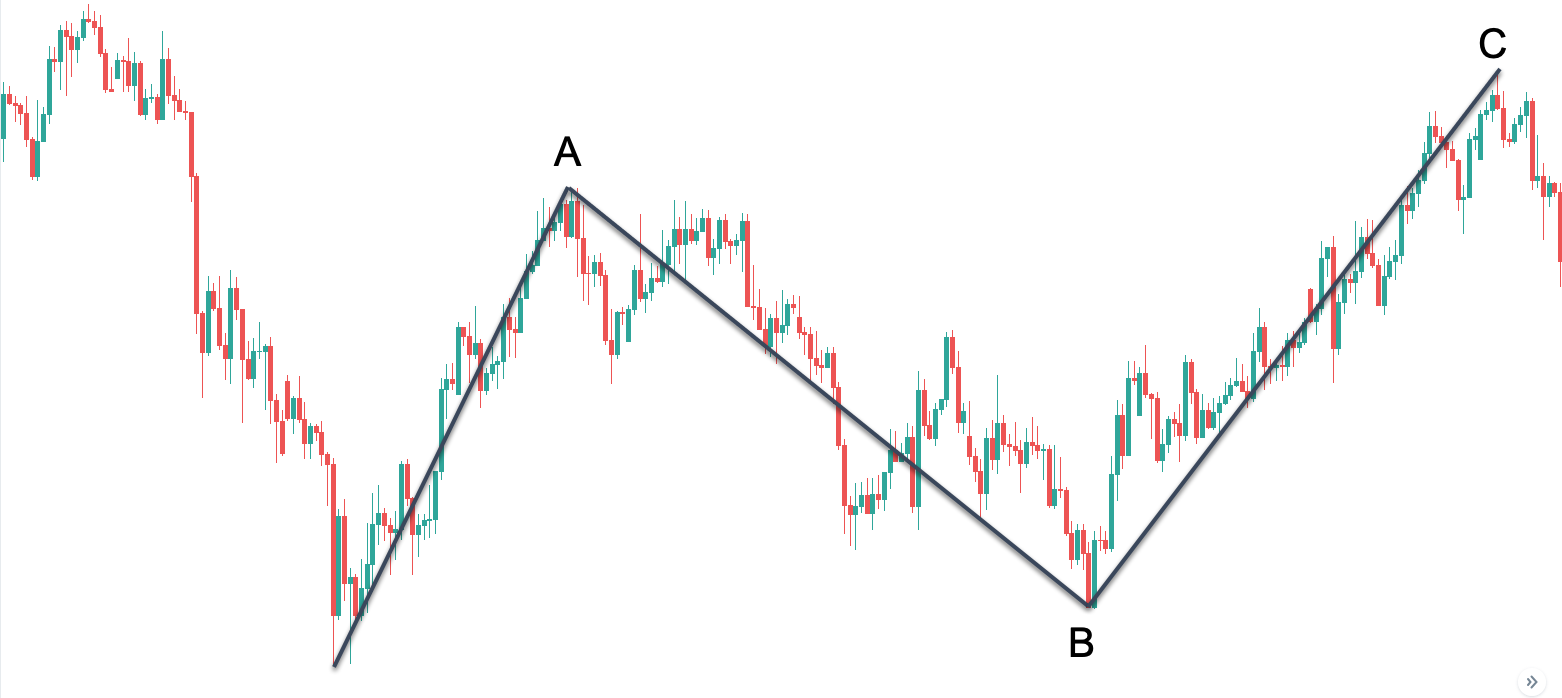
The above price chart illustrates an example of a regular flat that corrects to the upside. Notice how the price action on this chart starts with a strong bearish impulse move. Following that we can see the ABC corrective structure that retraces the price move of this bearish impulse move. The first wave within this flat pattern is wave A, and moves higher to correct a portion of the prior impulse. Then wave B retraces wave A and terminates near the start of wave A. Within a regular flat correction wave B will terminate near at least the 90% retracement of wave A.
You can see on this chart that in fact wave B was a very deep retracement of wave A, and one that can be seen to exceed this 90% threshold. Following the end of wave B, prices will move higher once again in the direction of wave A. We can see that wave C terminates just beyond the swing high of wave A. This entire sequence of events forms the regular flat correction pattern. Again keep in mind that we are looking at a regular flat correction that is correcting a bearish trend. However, the regular flat correction will also appear in the context of a bullish trend as well.
As we mentioned earlier there are a total of three variations of the flat correction pattern. The one that we’ve just looked at is referred to as the regular flat. The other two variations of the flat include the expanded flat and the running flat. Within the expanded flat wave B will extend beyond the start of wave A, and will move slightly beyond the end of wave A. Within the running flat variety, wave B will also extend beyond the start of wave A, but will fail to move beyond the end of wave A.
Elliott Wave Triangle
Elliott wave triangle formations are important corrective structures that are often seen within the larger wave 4 of the impulse sequence. Triangles are described within many traditional technical analysis textbooks, however, the Elliott wave theory provides the most granular description of the different triangle structures, and their inner subdivisions.
Within the context of Elliott wave, we can label three primary types of triangle structures. This includes the contracting triangle, the barrier triangle, and the expanding triangle. The contracting triangle is similar to the symmetrical triangle in traditional technical analysis. Within the contracting triangle we can draw two trendlines that connect the peaks and troughs of the triangle formation, and this appears as a contraction in price as it progresses within this type of triangle formation.
A barrier triangle is similar to an ascending triangle, or descending triangle in the traditional technical analysis terminology. However within Elliott wave, the ascending barrier triangle should only occur within the context of an uptrend, and the descending barrier triangle should only occur in the context of a downtrend.
Finally, we have the expanding triangle variety. Expanding triangles are often called broadening triangles within traditional technical analysis. And so, expanding triangles are the inverse of contracting triangles. That is to say that the price action within an expanding triangle, expands rather than contracts as the price progresses through its structure.
Below you can see an example of one of the more common triangle formations, the contracting triangle.
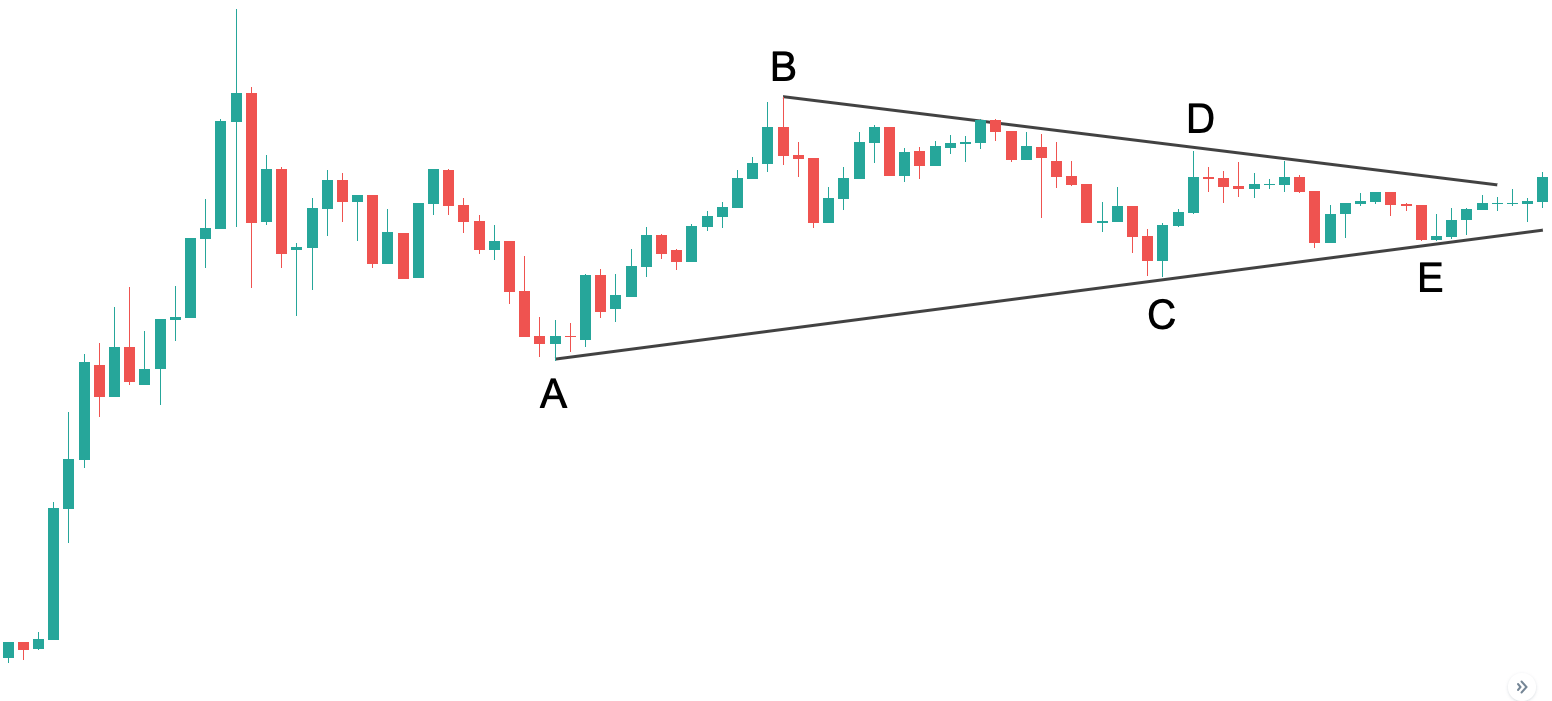
Notice here that this triangle formation is labeled as ABCDE. All triangles will be labeled in this fashion. That is to say that a triangle formation must have five legs within it to be classified as a valid triangle structure. Triangles are often referred to as 3-3-3-3-3 formations as well, because each of the legs within the triangle formation subdivide as three waves, and these waves are often seen as zigzag patterns.
Referring to the price chart, you can see that there was a strong bullish impulse prior to the triangle formation. Once the peak was put in, the price began to pull back in wave A of the triangle, and then progressed to form wave B, wave C, wave D and the final wave E of the triangle. Often wave E will end near the apex point, which is at the terminal point of the converging trendlines that contain the price action.
The proper way to draw the trendlines within Elliott wave triangle formations is by connecting the ends of wave B and D and then similarly at the other end, you would connect the ends of wave A and wave C. Within the contracting triangle, as can be seen here, these lines will then converge towards an apex. On the other hand, within the expanding triangle, these lines will diverge.
Triangles offer an excellent opportunity to trade in the direction of the larger impulse. At the termination of point E, we can expect one more price move higher in the case of a bullish impulse, or one more price move lower in the case of a bearish impulse. The termination point for this final leg can often be measured by taking the widest part of the triangle formation and then projecting that from the breakout point, which is a breach beyond the BD trendline.
Elliott Wave Complex Corrections
We have now discussed the three primary Elliott wave correction types. This includes the zigzag correction, flat correction, and triangle correction. Now, in some cases we will find that these three corrective forms can combine to form what are known as complex corrections. More specifically, these complex corrections can form what are called double three combinations or triple three combinations.
Double three combinations are combinations wherein two corrective structures combine to form a larger complex correction. Triple three combinations are combinations wherein the structure contains a total of three corrections.
Although complex corrections are advanced patterns that can be quite challenging to label correctly, the whole process can be simplified by understanding that these larger complex corrections are merely some combination of the three primary corrective forms described earlier.
Let’s look at an illustration that shows a Double corrective combination.
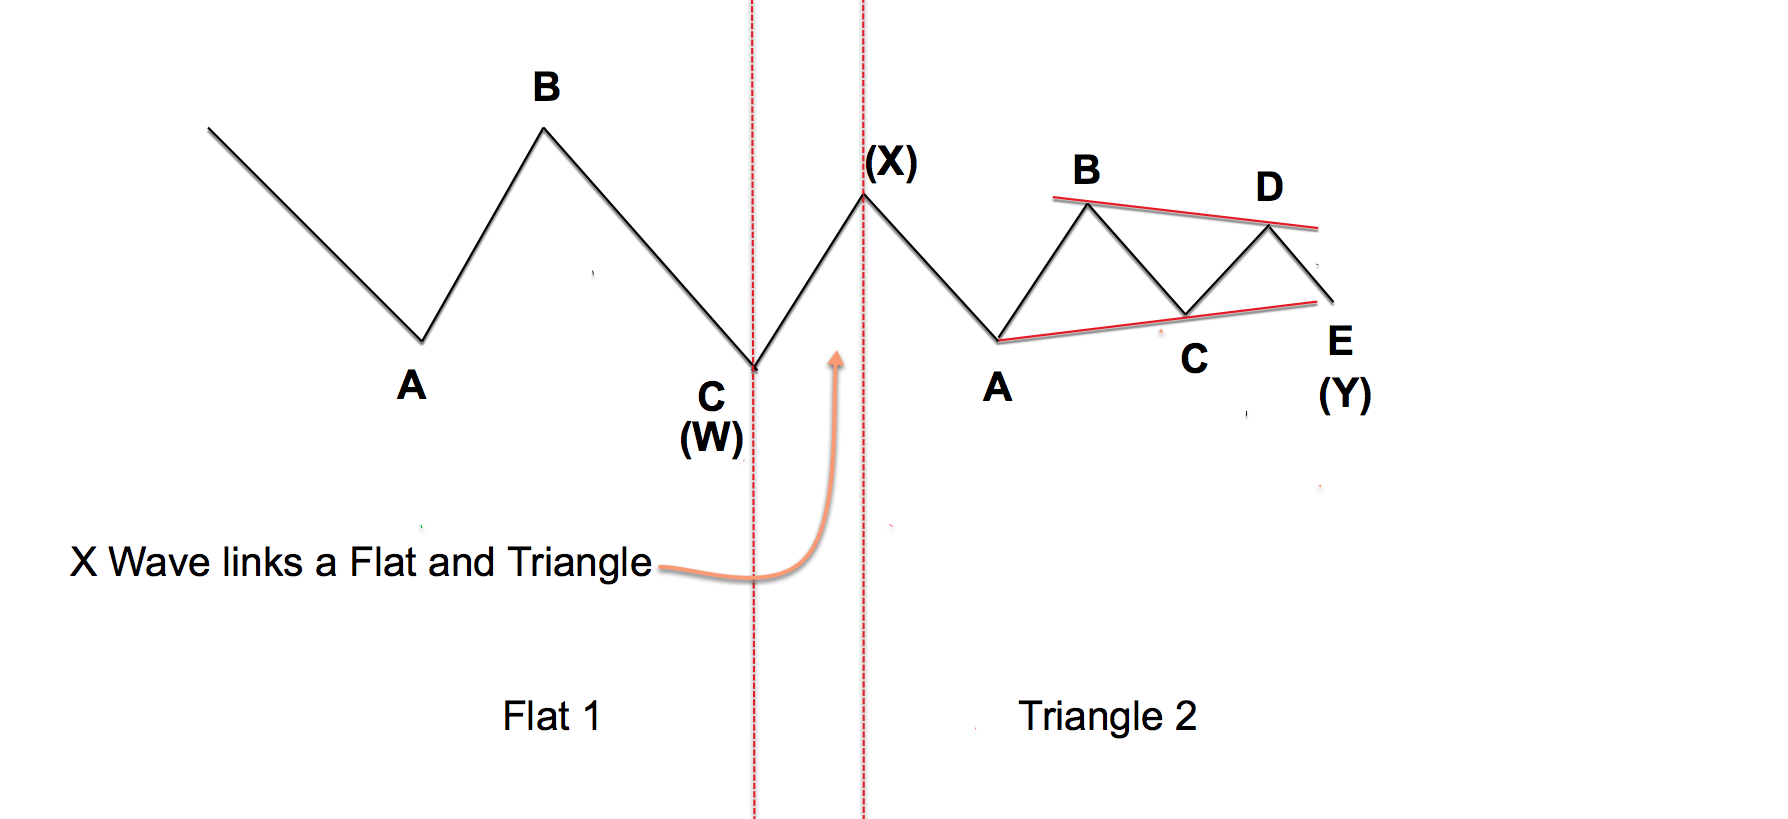
The illustration above depicts a Double three corrective combination that is comprised of a regular flat correction, and a triangle correction. If you look closely you can see the ABC legs that compose the first correction, which is a regular flat. Notice how wave B retraces at least 90% of wave A and then wave C extends just beyond the end of wave A.
Within a Double three combination the first structure is labeled as W.
The second structure within this combination is a triangle. Can you see the five legs that comprise this triangle formation? The second correction within a double three is labeled as Y. And the wave that connects these two structures is referred to as the X leg. You can see the connecting X leg shown within the two vertical lines.
And so, this entire double three structure that is comprised of a regular flat, and a triangle is labeled as WXY. Keep in mind that this is just one example of a double three combination. There are many different ways in which a double threes or triple threes can combine to form a larger structure. Within the context of a triple three combination, the labeling convention would be WXYXZ, where W,Y,Z are the three corrective structures, linked by the two X waves.
Summary
The Elliott wave principle is an advanced form of technical analysis. Although it takes a bit of practice to get acquainted with this analysis method, it is one of the best forms of market forecasting available to any serious trader.
Although a complete understanding of the Elliott wave theory is beyond the scope of this lesson, you should now at least have a good understanding of the nature of impulsive moves and corrective moves. Once you begin to appreciate that the markets are fractal, meaning that price movements generally occur in a repetitive manner at all degrees of trend, you will be better equipped to read the price action and predict with a good level of accuracy, where prices are likely headed next.