You will notice many different occurrences on your Forex charts, and one of the more interesting and common phenomenon is the gap formation. A gap is easily recognized on a price chart; it appears when the closing and the opening price, of the two neighboring candles, do not overlap. This creates a “hole” or “empty space” on the chart. In this lesson, we will go through the different types of gap formations that appear in the Forex market and what clues it may be hiding within it.
What is a Gap in Forex
A gap appears on the chart when the opening price of a candlestick moves sharply up or down away from the closing price of the previous bar, in such a way that there is no overlap in the trading ranges.
Typically candles on a Forex chart open at the same level where the previous candle was closed. When a candle period is completed, that candle will be closed and a new candle is opened instantly. This is what happens under most normal circumstances. However, when a gap appears on the chart you see a clear mismatch between the opening and the closing price of the two adjoining candles.
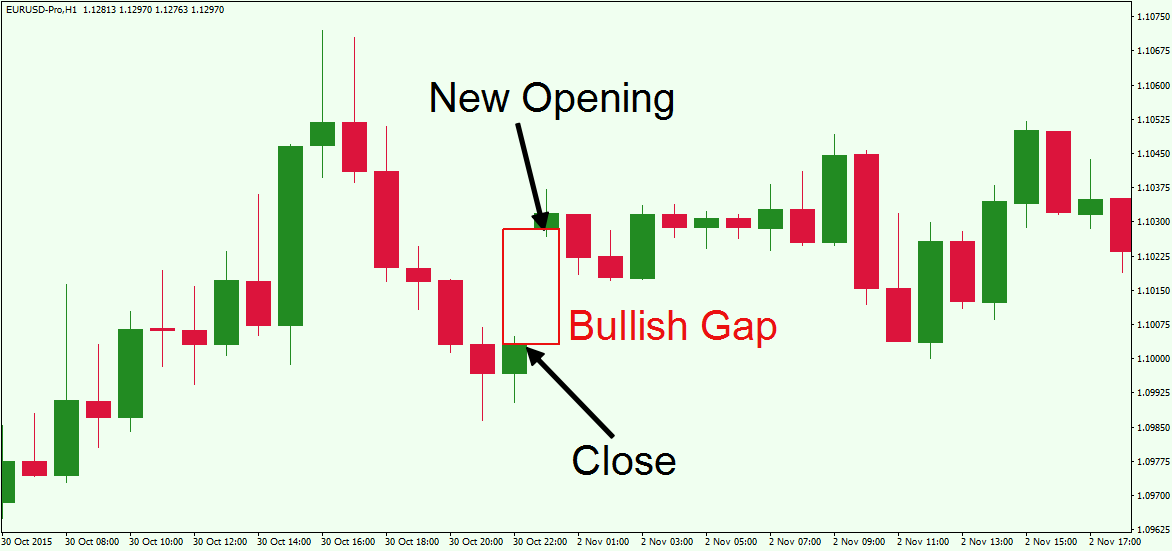
This is a classic example of a bullish gap on the H1 chart of the EUR/USD. The two black arrows show the closing of a candle and the opening of the next one. The red rectangle measures the size of the bullish gap between the close and the opening of the two candles.
The lower candle is bullish and it has closed at $1.1003 for one Euro. Then the next candle has opened at $1.1028. Therefore, we confirm a $0.0028 difference between the two candles. In this manner, we have a bullish gap of 28 pips on the chart.
Since the spot forex market is very liquid during continuous trading hours, a gap in the price action is most likely to occur with the market opening in the beginning of the new trading week. This is often referred to as a “Weekend Gap” in Forex.
The reason for an opening gap to occur more likely after the weekend is due to economic or political events, which have happened during the weekend while the markets are closed, causing supply / demand imbalances at the new week’s opening.
When the market opens for the new week, at 5pm New York ( Eastern Time ) on Sunday, any significant weekend news events instantly affect the price causing the Forex pair to gap up or down depending on the respective influence.
Types of Gaps
As we have just mentioned, Forex gaps typically occur after the weekend, however they can and do occur from time to time during the trading week as well. In the next section, we will detail some of the most common types of Gaps:
Continuation Gap
The continuation gap appears when the Forex pair is already trending and the currency gaps in the direction of the trend. In this manner, if you see a bullish gap during a bullish trending move, then you have a bullish continuation gap on the price chart.
It is absolutely the same in the opposite direction for a bearish continuation gap. If the trend is bearish and the chart creates a bearish gap during a trending bearish price move, then you have a bearish continuation gap.
Continuation Gaps form for a myriad of reasons, but the underlying cause is an imbalance in supply and demand. One example that explains the psychology behind the continuation gap has to do with “Trapped Traders”, those who have played against the prevailing trend and who massively abandon their trades when the price holds the strong trending move.
If the trend is bullish and the price continues the strong trending move upwards, then the bears might rapidly exit their short trades. When this happens, the bearish pressure on the pair disappears in a flash causing an excess in buy side demand, resulting in the Forex pair to gap up.
Exhaustion Gap
An exhaustion gap appears at the end of a trend and signals a potential reversal of the price tendency. The gap is in the direction of the trend and to the untrained eye, it could be mistaken for a continuation gap. However, there is a vast difference between the trader psychologies forming these two types of gaps.
The exhaustion gap usually appears when the trend starts creating more dynamic price reactions during a relatively shorter period of time. The currency pair turns volatile and big candles could be noticed on the chart. The pair has created several impulse waves and suddenly, a gap in the direction of the trend is created.
The exhaustion gap warns us that the last “players” are getting in to participate in the direction of the trend. Eventually, there are no more people left to trade in the direction of the trend, and the currency pair simply runs out of steam, and reverses its direction.
The image below will show you an exhaustion gap and a continuation gap on the chart.
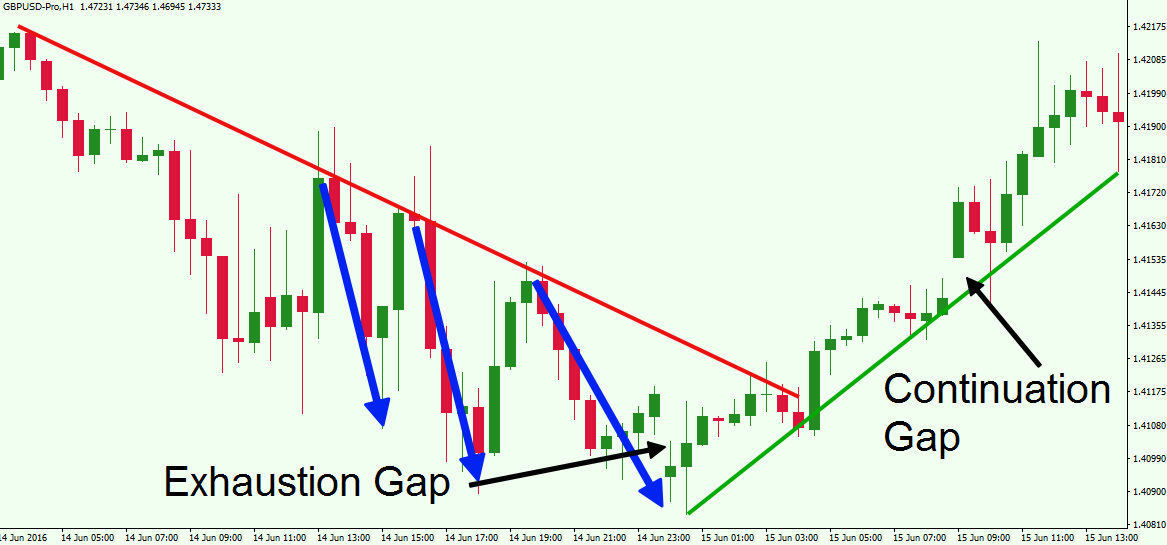
You are looking at the hourly GBP/USD chart. The image starts with a bearish tendency by the Sterling. The red line on the graph indicates the down trend of the pair. See that the last three impulses of the trend are very dynamic. At the same time, the candlesticks are relatively large and have very long wicks. This indicates that many traders are shorting the GBP/USD in order to ride the trend.
The last bearish impulse, which is marked with the third blue arrow, ends up with a gap in the direction of the trend. At the same time, the last three bottoms of the trend are relatively close to each other in terms of price. This gives additional signs that the gap is likely to be a trend exhaustion and that the price might reverse. The GBP/USD then breaks the bearish trend and starts a new bullish trend.
The green bullish line on the chart indicates the new bullish tendency of the Pound. After the price tests the trend line for a second time, it closes a bullish candle and then it gaps up. This is a continuation gap as a result of the bounce from the newly established bullish trend. When the price touches the green trend line and bounces from it, the bears get a crucial signal that the recent retracement is not likely to be continued.
Therefore, these bears, who are now caught on the wrong side, abandon their trades, creating a demand for buy orders to fill their stop losses. This along with a new influx of bullish traders, creates a further demand for buy orders, causing the GBP/USD to gap up. As you see, the price continues the increase afterwards, as the demand pushes prices higher.
Breakaway Gap
The breakaway gap typically appears when the price is testing a level on the chart – support, resistance, trend line, trend channel etc. The price suddenly gaps through the tested level and enters a trend in the direction of the breakout.
This is considered the most attractive among all gaps. The reason for this is that it is usually located right at the beginning of a new impulsive trend move. As a result, traders can take advantage of an early entry with a breakaway gap. Let’s take a look at a breakaway gap in action on a chart:
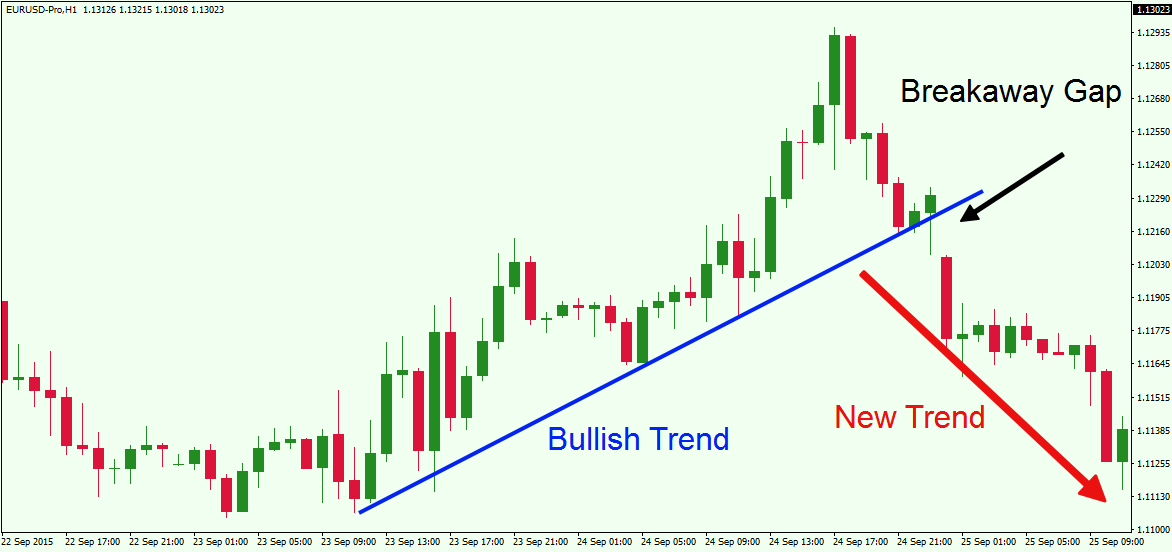
You are now looking at the hourly chart of the EUR/USD. The blue line indicates the bullish trend of the pair. You will see that after the last test of the trend line, the EUR/USD gaps down through the trend line marked in blue. The breakaway gap is indicated with the black arrow on the picture above. As you see, after the breakaway gap the pair enters into a bearish trend move.
How to Trade Gaps
Since you are now familiar with the different types of gaps, we will now move to discussing a few gap trading strategies for trading weekend gaps in forex.
Firstly, when trading gaps, it is important to remember that price may not start immediately moving in the intended direction. In many cases a corrective move will appear, filling part, or many times the entire gap area. In other cases you may even experience a false signal created by the gap. Therefore we will now dive into a few different Forex gap trading techniques, which will help facilitate your decision making.
Gap Trading Setup – Fill and Breakout Counter to Gap
The gap fill and breakout counter to the gap occurs when the price creates a gap and then moves back to fill the gap in full and continues further beyond the gap fill. However, at times the price will approach a ½ gap fill or full gap fill before resuming in the direction of the gap formation. As such, you should carefully watch the price action in order to see which side of the gap will break.
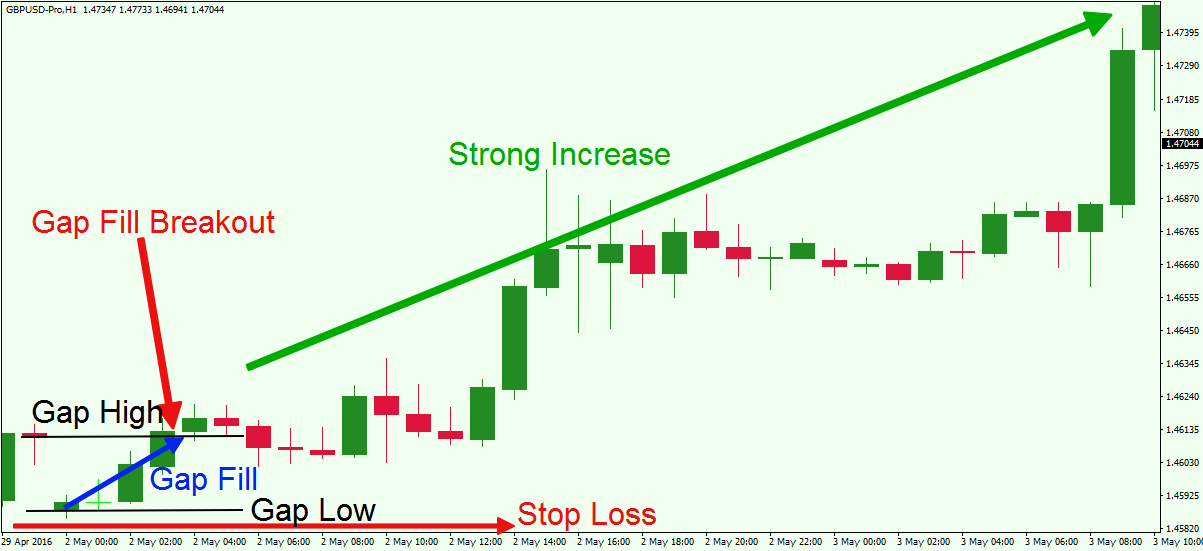
On the hourly chart of the GBP/USD we see a bearish opening gap, which is initiated in the beginning of a new trading week. We indicate the high of the gap, which is the close of the candle before the gap occurs. Then we mark the gap low, which is the opening level of the gapping candle.
After the gap is created we see that the Sterling regains the lost value. Thus, we say we have a gap fill on the chart (blue arrow). Suddenly, the gap pullback creates a breakout through the high of the gap. This gives us a signal the price might enter a bullish trend despite the bearish gap for the new week. So, where is the bullish entry signal on the chart? You should buy the GBP/USD when a candle closes above the gap high level. Your stop loss should be placed below the gapping candle as shown on the image.
As you see, the GBP/USD price enters a strong bullish trend after the price creates a breakout after the gap fill.
Gap Trading Setup – Fill and Breakout In the Direction of the Gap
Now let’s take a look at another scenario. Very often after a gap forms, price action will create a ½ gap fill or full gap fill, and then reverse and break the gap through an important swing level in the direction of the gap. This is a strong signal that the price might resume the move in the direction of the gap. This would provide a high probability gap trading signal, which could be used as an early entry into an emerging trend.
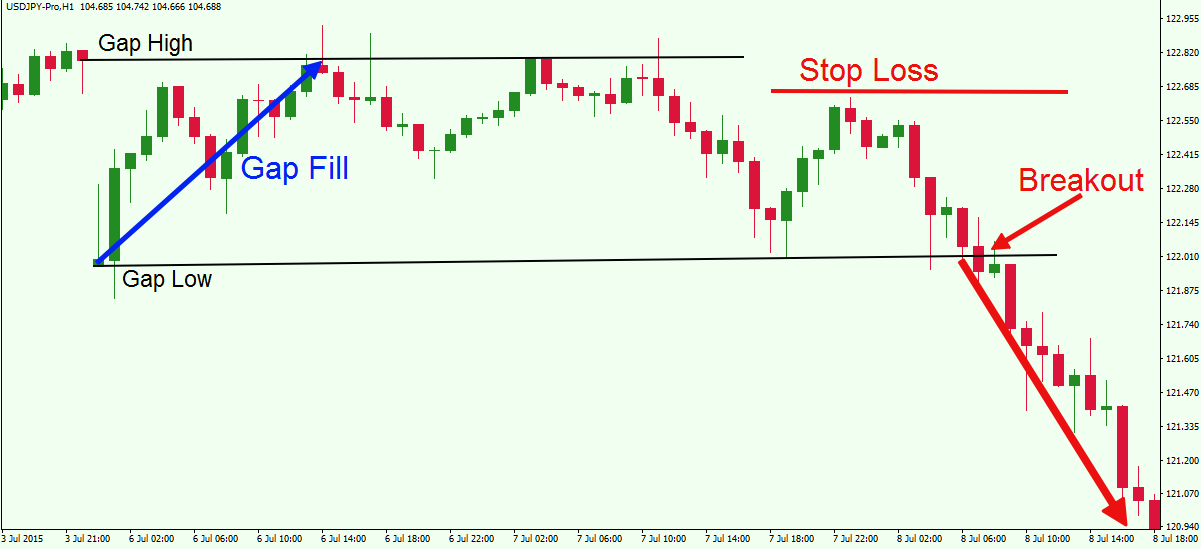
Let’s take a look at another gap example. This time we will turn our attention to the H1 chart of the USD/JPY. The high and the low level of the gap are marked with the black horizontal lines on the price chart. After the creation of the gap, the fill occurs relatively quickly (blue arrow). Note that the price action creates many unsuccessful attempts to break the gap high. This means that the gap high is a relatively strong resistance area.
After the third test on the gap high the price bounces downwards and drops to the gap low. We see an unsuccessful attempt for a breakout through the gap low. Then the price decreases again to the low level of the gap but this time we have a successful breakout to the downside. The price closes with a candle below the gap low confirming the breakout.
This provides a bearish gap trading signal on the chart. As such, there is a nice short trade opportunity here. The breakout candle should be used to open a trade in the direction of the breakout, which this time is in the direction of the gap.
A stop loss should be placed above the most recent swing top of the price action. Some may prefer to place a stop loss order above the Gap High, however, in this instance since we have a lower swing high, it would be my preferred stop loss point. This area provides a better risk/return ratio on the trade.
Whatever your preference may be, you should always apply some simple price action rules in order to determine the optimal point for your stop loss order. After the price breaks the low level of the gap, the pair enters a strong downtrend as expected.
Price Action Tools for Gap Trading
As with any other Forex strategies, a gap trading strategy also requires proper trade management and take profit skills. One of the best ways to close your gap trading position is by analyzing price action clues.
When the price starts moving in your favor you should gauge price action at important horizontal swing levels to find a suitable exit point. Also, if the trend is being contained and supported by a trend line, then you could also look to close your trade when the price closes a candle outside the trend line.
When trading gaps, it’s particularly important to watch for candlestick formations, as they can provide valuable clues into price behaviors that could be used for closing a gap trade. A few of the more reliable candle patterns to look out for are Engulfing and also the Hammer and Shooting Star, sometimes referred to as a Pin Bar.
Sometimes you will notice that a gap occurs within the structure of a classical chart pattern. When this happens it is helpful to use a multiple time frame approach and zoom into the lower timeframe, so that you can get a clearer picture of the chart pattern and thus better manage the trade.
Another useful price action tool for managing gap trades is the daily pivot points. As price is moving in your favor, pay close attention to price interactions with the pivot points, especially on the first interactions of the Pivot Point (PP), S1, and R1 Levels.
If the price breaks a pivot point in the direction of your trade, then you should keep the trade on in expectation of a further continuation until the next significant swing level or pivot level is tested. However, if the price bounces sharply from a pivot point area, then you might want to exit your trade and look collect your open trade profits.
Trailing Stop Loss
The trailing stop can automatically move along with the price action in the direction of your trade at a pre-determined distance, which is chosen by you.
If the price action manages to break a major key level in the direction of your trade, as evidenced on your longer time frame chart, such as the daily timeframe, then you may want to considering using a trailing stop loss in order to lock in some guaranteed profit while attempting to catch a new impulse wave near the beginning of a potential trend. If you implement this practice, your exit trigger will be your stop loss and you will stay in your trades until the price hits the trailing stop.
Conclusion
- A Forex gap is a chart phenomenon that appears when the closing and the opening price, of the two neighboring candles, do not overlap. This creates an “empty space” or “void” on the chart, where no trade activity has taken place.
- Since the Forex market is very liquid during normal trading hours, gaps most frequently occur after weekends with the opening of the new trading week.
- Gaps occur as a result of economic or news events during the weekend when markets are closed. But gaps could also occur during the trading week in rarer cases.
- There are three main classification of gaps in technical analysis:
- Continuation Gap – During an impulse of a trend, a continuation gap can sometimes be seen as traders who play against the trend get desperate and instantly abandon their trades. In this manner, the pair can gap in the direction of the trend.
- Exhaustion Gap – An exhaustion gap can be seen at the end of a trend, when the currency pair can start getting very volatile. During this phase it is typical to see a lot of late traders who enter the market in hopes of riding the well-established trend.
- Breakaway Gap – A breakaway gap typically occurs at the beginning a new trend. We can see at times that the Forex pair tests a crucial level, and then gaps through that level indicating that the pair is entering a new price leg.
- Some typical Price Action occurrences that we see after a Gap formation:
- Gap Fill and Breakout Counter to Gap– The price fills the entire gap and breaks out counter to the direction of the gap. In this instance, the price is reversed after the gap.
- Gap Fill and Breakout in the Direction of the Gap – The price fills the gap, usually marking a half gap fill or full gap fill, but then it starts moving back in the direction of the gap, and breaking beyond a technical swing point in the direction of the gap afterwards.
- Some ways to manage a trade and take profit when trading gaps is:
- By using Forex Price Action – support, resistance, trends, candle patterns, chart patterns, pivot points, etc.
- By relying on an adjusted stop loss (trailing stop)