One of the most important decisions that every technical trader must make is the selection of charting software that they will use. All charting software are not created equal, and as such, it pays to know which one will provide the best solution for your specific needs. We will attempt to make this exercise a bit easier for you by highlighting the eight best charting software for traders.
Chart Analysis Software
There are a host of charting software available in the market. While some are more focused on a specific market, others are more generalized and can be used with many different types of trading instruments. Most charting programs will provide a library of traditional technical analysis tools and studies such as technical indicators, drawing tools, and volume-based analysis. A few others tend to be more specialized and focus on a very specific set of market analysis tools.
But before we get into the nuts and bolts of the different charting software providers, let’s take a moment to really understand what a chart software for trading is and how it might help us in making informed decisions. Essentially, a charting platform aggregates price data from a source, typically an exchange or from your broker, and allows that information to be plotted on the price chart in the form of a candlestick chart, bar chart or other charting style.
The price data is collected real-time in most cases, and will be available immediately for chart analysis purposes. Real-time price data is crucial for day traders and other short-term traders that typically base their decisions on intraday price movements. The price data can also be collected on an end of day basis. This is typically more popular with position traders who are more concerned with daily and weekly chart analysis.
Aside from the ability to plot the incoming data on a price chart, some chart analysis software programs can also provide direct connectivity to your broker via an API. This will allow you to place trades either directly from your charts or via some other method from inside your charting platform. As such many chart software programs can also act as the trader’s execution platform.
Metatrader
Metatrader is the most popular charting platform for currency traders. There are two primary versions of Metatrader. This includes Metatrader 4, also known as MT4, and Metatrader 5, commonly referred to as MT5. Metatrader is compatible with most Forex brokers in the industry. However, it is worth noting that while most brokers offer compatibility with the Windows version of Metatrader, it is less common to find a compatible version for Mac.
The Metatrader forex charting platform has a large library of technical analysis and chart analysis tools. Most brokers offer the Metatrader platform for free, and there are typically no fees associated with using the platform. It can be downloaded fairly quickly and easily. Although it is a great platform for those starting out, it is fairly rudimentary in terms of its user experience and visual appeal.
The Metatrader application will also work on smart phones with iOS and Android. The charting features within their mobile app is suitable for most basic types of technical analysis. Nevertheless, it can be quite valuable for those technical traders that are typically on the go and need a reliable mobile charting solution. It is the best forex charting software for beginners who are on a tight budget.
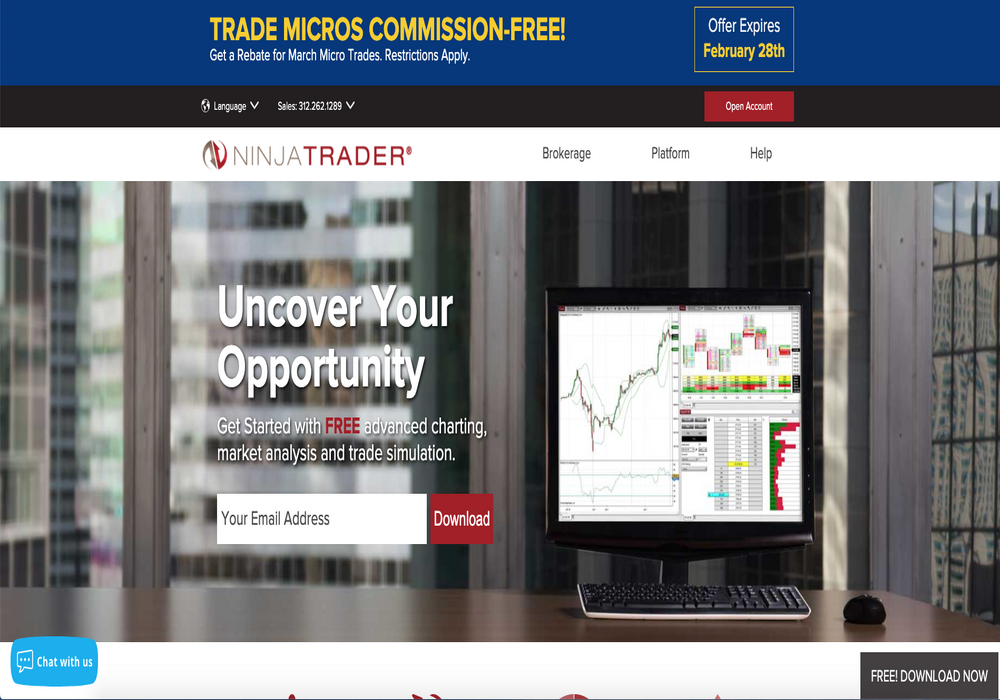
Ninjatrader
Ninjatrader is an award-winning charting platform that is geared for Futures and Forex traders. It offers many advanced features for users such as chart-based trading, and strategy backtesting. The charting software is fairly simple to use, yet very powerful in its capabilities. The price charts are visually appealing and the charting platform is relatively easy to learn and navigate.
As part of Ninjatrader’s advanced charting platform, traders can access a myriad of technical indicators and studies, a news panel, streaming quotes, and other related built-in tools. On top of the default offerings within the Ninjatrader platform, users can access a wide range of add-on products available from third-party vendors. These third party vendors provide various custom indicators, trading systems, and execution tools that can be used within the Ninjatrader environment.
The Ninjatrader software has a very robust algorithm for creating simple scans and trading systems based on specific conditions that you would set. And this can be done without the need for programming or coding expertise.
Some of the more advanced trading systems built within the Ninjatrader platform will require programming knowledge. The good news is that there is a large network of programmers within their ecosystem that can assist in most coding requests that you may require.
The Ninjatrader platform is free to download, and is free to use on a demo or simulated account basis. If you decide to use their brokerage service offering, then you can continue to use the platform for free within a live trading environment. For those who have other broker arrangements, they will need to get a license by either leasing or purchasing the software.
TradingView
TradingView is one of the best charting platforms available in the market today. It offers a simple yet elegant design that is easy to navigate. Along with its rich charting features, traders can access various news and other fundamental data sources. The charting platforms is built on HTML 5 technology providing for an intuitive and visually appealing charting experience.
One of the more interesting features within the TradingView platform is the ability for users to publish their charts and setups, and share them across the platform to their followers and other interested users.
Although TradingView is a market neutral charting platform, in that it does not specifically cater to any one single type of market trader, it does have a very large community of Forex traders that use the platform. TradingView offers both a free charting service, along with a paid version which offers additional features. The premium paid versions will allow you to save many more chart layouts, and access other features such as email and audio alerts.
Additionally, unlike many other charting platforms that require their software to be downloaded onto your desktop, TradingView is a web-based charting platform that can be accessed from anywhere, so long as you have a device with internet connection.
Within TradingView, traders can access a broad range of markets including 45 plus worldwide exchanges. Generally, TradingView provides free delayed data on most of the popular exchanges, however, you will be required to pay additional fees for real-time quotes. Their real-time data fees are fairly priced, and traders have the option of bundling the data services to enjoy a better pricing structure.
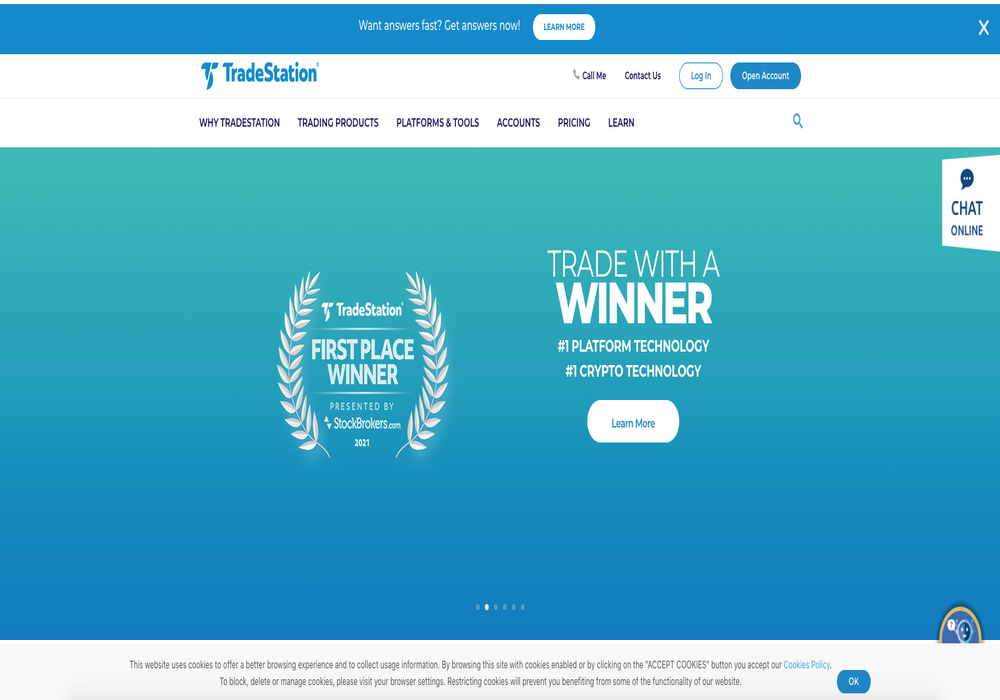
Tradestation
Tradestation is one of the oldest and most established charting and trading platforms in the market. It is geared more towards experienced traders, particularly those that trade the futures and commodities market. Within the Tradestation platform, users can access a countless number of technical studies and charting features.
Additionally, Tradestation has an advanced back testing engine wherein traders can perform a historical analysis on a particular trading strategy, or a portfolio of strategies. The simulation engine also includes an extensive database of historical data for back testing purposes.
For those that are interested in building their own trading system, the Tradestation platform is second to none. Tradestation’s proprietary programming language is called Easy Language, and allows system traders to build robust algorithmic trading systems.
Even if you are not a programmer yourself, you can quickly learn Easy Language or hire an expert Easy Language programmer within their ecosystem to build out your desired mechanical system.
Tradestation charting platform offers both a desktop and web-based option. Both come with a rich set of charting features that should meet the needs of even the most discerning technical trader. Options traders can also benefit from the Tradestation platform. Their option specific trading tool, is known as OptionStation Pro. It includes many advanced analytical tools geared specifically for the advanced Option trader.
MotiveWave
The MotiveWave charting platform includes all of the standard technical indicators including RSI, Williams %R, Momentum, ROC, MACD, and many more. In addition to these, the Motivewave platform also offers a rich set of features for Elliott Wave analysis, Harmonic pattern analysis, and Hurst cycle analysis. It is one of the few trading platforms in the market that offers all of these technical analysis features wrapped into one charting platform.
Motivewave offers a few different versions that users can choose from depending on their specific needs. Their all-inclusive charting package includes all of the features that they offer within a single module. In addition to the manual drawing tools for Elliott wave analysis, Motivewave also has a built-in algorithm for automating the Elliott wave counting process.
Although this feature is not always perfect in terms of labeling the current wave structure, it does provide a great backup to or confirmation of your own Elliott wave analysis. For those that are new to Elliott wave it can provide for a great learning tool for understanding how impulse and corrective waves form within the price action. In addition to the analytical methodologies noted earlier, Motivewave also boasts a large set of tools for Gann traders.
Although the Motivewave platform is quite costly in relation to other charting platforms in the market, it has some very specific uses that cannot be readily found in many of the other charting platforms. As such, for traders that are interested in Elliott wave, Fibonacci, Harmonic trading, Gann analysis, or Hurst analysis, there is no better charting application available in the market.
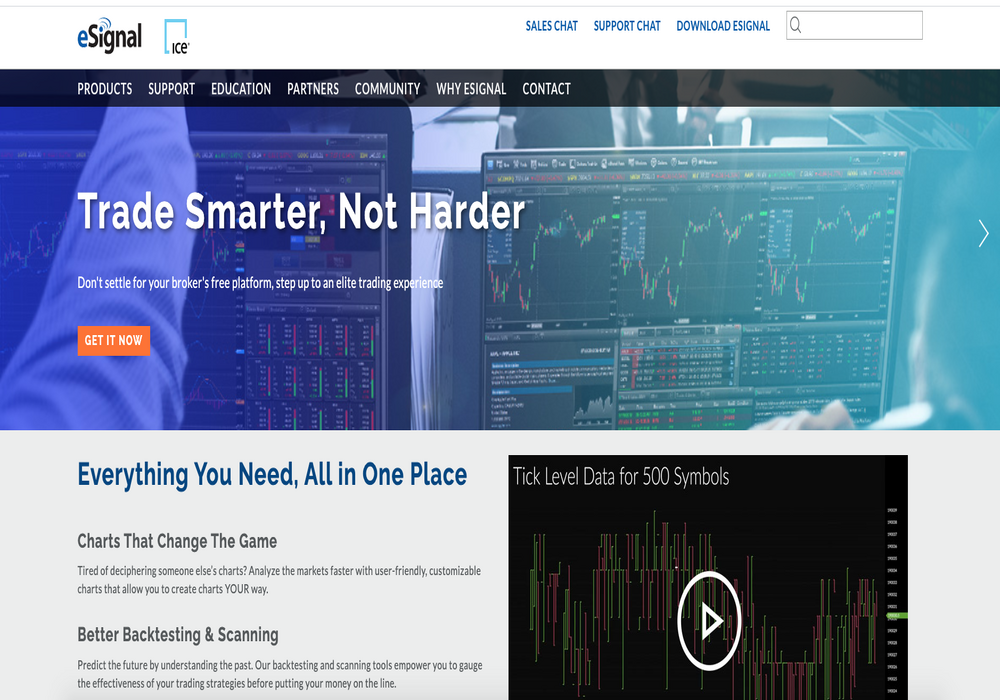
eSignal
eSignal is an advanced charting software that is focused on serving professional traders and investors. eSignal has a large network of brokerage firms that it links with, allowing traders an abundance of choices in terms of connectivity. eSignal offers both a web-based charting platform, along with the traditional download software.
The cost of the eSignal service is a bit higher than most other charting platforms. Currently the price for a subscription with eSignal starts at around $50 a month, and it can go up from there based on the real-time data and markets that you choose.
eSignal users will also enjoy access to many vendor plug-ins to help them enhance their analysis experience. Some of these vendor plug-ins include execution-based tools, custom indicators, and technical analysis strategies including Elliott Wave and Market profile to name a few.
In addition to its extensive library of technical studies, traders can also create their own technical trading indicators within the platform. eSignal is an excellent trading platform, particularly for those more active in the market, and need access to the latest, most cutting-edge trading technology and functionalities.
As for viewing the price chart data, there are many different charting options to choose from. For example, traders can pull up the following style of charts – Bar, Candlestick, Heiken Ashi, Point and Figure, Area, Line, Renko, and Histogram, to name a few of the most popular ones. In addition to this, users can create custom charts based on various securities and also generate charts based on spreads.
Stockcharts
Stockcharts is an award-winning stock charting platform tailored to the needs of novice to intermediate traders. It is fast becoming one of the most popular go to trading platforms for beginning equity traders. Stockcharts was created by John Murphy, who is a renowned technical analyst and author. As a Stockcharts member, you will have access to technical commentary from John Murphy on various equities markets.
Stockcharts offers both a free and premium version of their software. The free charting version is fairly limited in scope, and as such, it makes more sense for those interested in the platform to sign up for a free trial which provides complete access to all the features within the platform. Some of the charting features that you will have access to within Stockcharts include PerfCharts, Seasonality charts, Dynamic yield curve charts, and more.
Stockcharts is an ideal charting platform for novice traders who are interested in learning more about traditional technical analysis including chart patterns. They have an in-depth educational section with hundreds of lessons on all things related to technical trading and chart analysis.
For those users who become a premium member, they will enjoy an enhanced ad-free charting experience, get access to intraday data, have the ability to run technical scans, and view commentary from various experts. Stockcharts offers three different premium membership plans. This includes the Basic plan, Extra plan, and the Pro plan. Users can decide between a monthly recurring subscription, or an annual subscription plan, which comes with an added discount.
Metastock
Metastock is a leading charting platform for stocks, ETFs, futures, and forex. Metastock is one of the earliest pioneers in technical analysis charting software, and continues to provide cutting-edge solutions for market traders. Along with hundreds of different built-in technical trading and charting features, it also offers a newsfeed and market data service which is powered by Thomson Reuters. Thomson Reuters is one of the most reputable newswires in the industry. Metastock can offer an in-depth database on fundamental data across many different market instruments.
Additionally, Metastock users can access the platform’s backtesting engine to test various trading strategies and methods. You can create custom indicators, scripts and scans within the Metastock platform. In addition to these features, Metastock also provides the ability to program and run automated trading systems on their platform. This is ideal for system traders who are seeking a stable charting and execution platform to run their automated strategies.
Metastock offers some excellent add-on products as well. One of the more popular add-on products is the Japanese candle recognition software, which was created by candlestick patterns expert, Greg Morris. This is a proprietary candlestick recognition and analysis software that is only available within the Metastock charting platform.
Traders that rely heavily on both technical and fundamental data for their trading decisions will find that the Metastock charting platform will serve their needs quite nicely. Metastock is made available to users based on a subscription pricing model. Currently, you can get a license to use the product starting at about $69 per month for an end of day data plan.
Summary
There are dozens of different charting platforms available to traders and investors. We have highlighted eight of the best chart analysis software programs that we believe are the current leaders in the industry right now. Although, a charting platform by itself will not make you an expert technical trader, having a reliable chart trading software can enhance your ability to make the most informed decisions in the market.