As traders, we know that markets can either be in a trending phase, or a congestion phase. As a general rule, most financial instruments will display trending behavior less than one third of the time. And the rest of the time, the market is trading back and forth in a more range bound manner. It’s important to understand the difference between each market regime, so that we are applying the best market timing tools aligned to the current environment. Our focus here will be on mean reverting trade tactics that are best applied in non-trending conditions.
What Is A Mean Reversion Trading Approach?
We often hear about trading strategies being described as either mean reversion strategies, or trend following strategies. Most traders have a pretty good sense as to a trend following methodology, however, some seem to be confused about how mean reverting strategies tend to work.
Before we dive into the mechanics of mean reversion as a trading methodology, let’s take some time to understand the basic theory underlying mean reversion within the financial markets. The essential concept within a mean reversion model is that prices of financial instruments will tend to revert to a historical mean. And so, based on the time series analyzed, the expectation is for overextended price moves in either direction, to snap back to its average or median levels.
A simple example of this can be illustrated within the long-term historical returns of the US stock market. Over the last 75 years or so, the US stock market, as represented by the S&P 500, or Dow Jones industrial average has provided an average annual rate of return of approximately 8 to 9%. This would be considered the average or mean yearly performance within the overall US equity market. Now, if you analyze the average yearly returns across the 75 year period, you will find years wherein the stock market has returned in excess of 30% per year, and similarly you will find years wherein the stock market has lost more than 50% per year.
Typically, across this data series you will find that in years wherein the market has made outsized gains, the market will realize much lower returns in the subsequent year.
Along the same lines, when the market has made outsized losses, within a particular year, it will often realize much larger gains in the subsequent year. Although, there is generally an upward bias within the equities markets, you can see from this example, that it tends to display mean reverting tendencies after excessive price moves in either a bull or bear market.
A mean reverting approach can be applied to any timeframe regardless of whether you are a day trader focusing on five-minute candles, or a position trader looking at weekly bar charts. Essentially, mean reversion techniques attempt to take advantage of extreme price movements in a financial instrument, by taking a contrarian view, and ultimately executing a position that fades the current price move. The mean reversion trader scans the market for these types of imbalances, with the assumption that prices should return back near its equilibrium levels.
Pros and Cons Of Mean Reversion Strategies
Now that we have provided some background on mean reversion theory, let’s detail some of the benefits and drawbacks in utilizing this style of trading.
Pros Of Mean Reversion Strategies
More Trading Opportunities – As a general guideline, markets tend to trend about 30% of the time, while it remains locked within some form of consolidation 70% of the time. Since reversion to the mean strategies are best applied within the context of range bound market conditions, which exist more than two thirds of the time, there will be more opportunities to take advantage of these types of set ups, as compared to trend trading set ups.
Shorter Holding Periods – On average, a mean reversion strategy will have a relatively short holding period. Mean reversion strategies are very popular among swing traders, who typically hold onto a position in the range of two days to two weeks. Compare this to a trend following approach, which will generally seek to hold positions for weeks to months on average. This higher turnover, can lead to increased opportunities in the market that can help amplify your returns.
Better Win Rates – One characteristic of many mean reverting methods is that they are quite conservative in terms of their risk to reward profile. In other words, many mean reversion trading systems will look to take only one unit or one and a half units of profit for every unit of risk. This inherently helps increase the average win rate of the system.
Now let’s discuss some of the challenges associated with mean reversion strategies.
Cons Of Mean Reversion Strategies
Smaller Payoffs – As we noted, mean reverting strategies tend to target one unit or one and one half units of profit for every unit of risk. This is a generalization, however, it is typical of many mean reversion techniques. The obvious disadvantage of this, is that, although we are able to achieve a higher win rate, we are giving up something in return. More specifically, a mean reversion method will achieve smaller payoffs compared to their trend following counterparts.
Likely To Miss Big Moves – We know that markets tend to consolidate approximately 70% of the time, which is advantageous to mean reverting traders. But keep in mind that the markets do tend to trend about 30% of the time. And it’s during these trending phases where the highest potential profits can be realized. Trending market phases can create outsized gains which can be an opportunity cost to the contrarian trader.
Trade Execution Challenges – Most trend following systems use market orders, or stop orders to execute entry orders. As a result, most entry signals issued on trend following models tend to get filled.
Mean reversion strategies often utilize limit orders as their primary entry execution method. As such, entry signals issued within a mean reverting framework can often be missed due to the larger reliance on limit orders. This is because limit orders may or may not get filled at the price requested. This poses an additional challenge for contrarian traders whose models are based on selling into strength, and buying into weakness.
Markets Can Remain Irrational – There is a famous market adage that says that, the markets can remain irrational for longer than you can remain solvent. In other words, regardless of how confident you are in your market assumptions, you should not be so adamant so as to ignore the fact that the markets can and do often trade contrary to what appears to be reasonable. Mean reversion traders need to be ever cognizant of this because of the very nature of their trading method which relies on bucking the current price action, which may appear to have stretched too far. Failing to recognize this in the market can lead to devastating losses that can be hard to overcome.
Mean Reversion Indicators
Mean reversion trading techniques in the market are typically built on specific types of indicators. These indicators can be in the form of technical oscillators, fundamental or economic indicators, or sentiment based indicators. Most traders are familiar with mean reversion indicators based on technical studies, but they are often less familiar with fundamental and sentiment driven reversion indicators. Let’s highlight some examples within each class of mean reversion indicators.
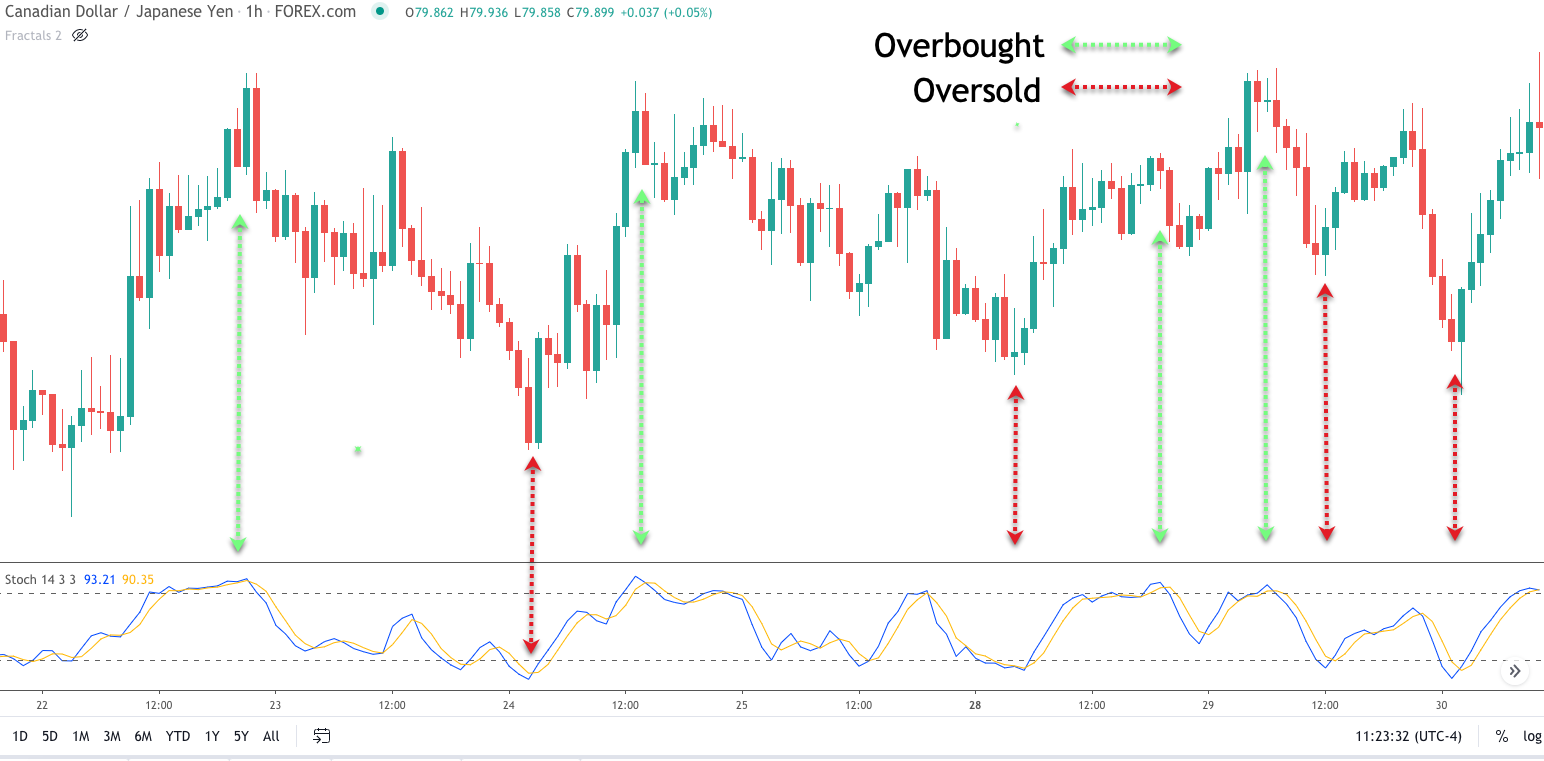
Technical Indicators – Certain technical indicators such as Bollinger bands, Relative Strength Index, Stochastics, and Williams Percent R are examples of technical based studies that provide overbought and oversold signals. Essentially, these overbought and oversold signals tell us when the price movement within a specific market has either overextended to the upside in the case of an overbought reading, or has overextended to the downside in the case of an oversold reading.
Below you will find an example of the Stochastics Indicator. The upper dashed line within the Stochastics indicator represents the Overbought level, and the lower dashed line within the indictor represents the Oversold level. Notice how prices move back towards its mean following an Oversold or Overbought reading.
Fundamental Indicators – If you routinely monitor an economic calendar, you will be well aware of the many different types of economic data releases that come out throughout the course of the month. Some examples of economic indicators that are important to watch for within the Forex, Futures, and Equities market include central bank rate decisions, gross domestic product, consumer price index, ISM manufacturing, NFP report, to name just a few. For individual equities, a few important fundamental metrics include the price to earnings ratio, the price-to-book ratio, debt to equity ratio, and price-earnings to growth ratio.
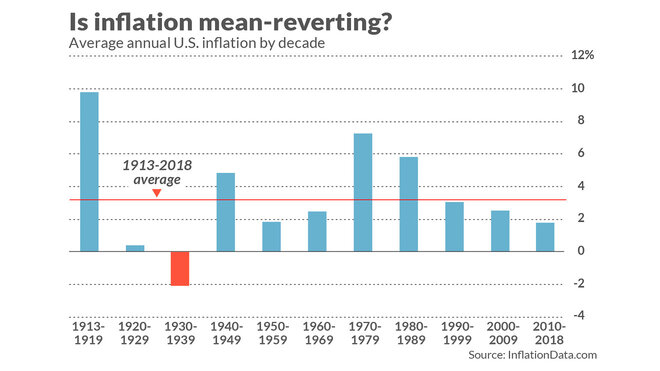
All of these aforementioned fundamental data points can be used within a mean reverting trading model. For example, the contrarian trader could compare the current CPI data to a multiyear trend of commodity prices, and use that data within their mean reversion model for predicting future inflation rates.
Sentiment Indicators – Sentiment indicators can come in a few forms, but the underlying premise of using sentiment based indicators is essentially the same. That is to say that mean reversion traders will often look at extreme readings in a sentiment index as a way to gauge the prevailing sentiment in the market.
Often we will find that sentiment readings that are within an extreme range, either bullish or bearish, will lead to a reversal in prices within that market. The basic concept behind this is that if everyone is bullish, then there is no one else left the push prices higher, which will lead to a price decline. Along the same lines, when everyone is bearish, then there will be no one else left to push the prices lower, which will then lead to a price rise.
Another popular type of sentiment indicator which is used regularly in the futures markets is the commitment of traders index, commonly referred to as the COT index. Often we will find that when there is an extreme divergence in positioning between commercial traders, who are essentially hedgers, and large speculators, who are mainly speculative funds, that prices may be close to a reversal point. This will usually favor price moving on the side of commercials.
The weekly Copper futures price chart below illustrates this phenomena.
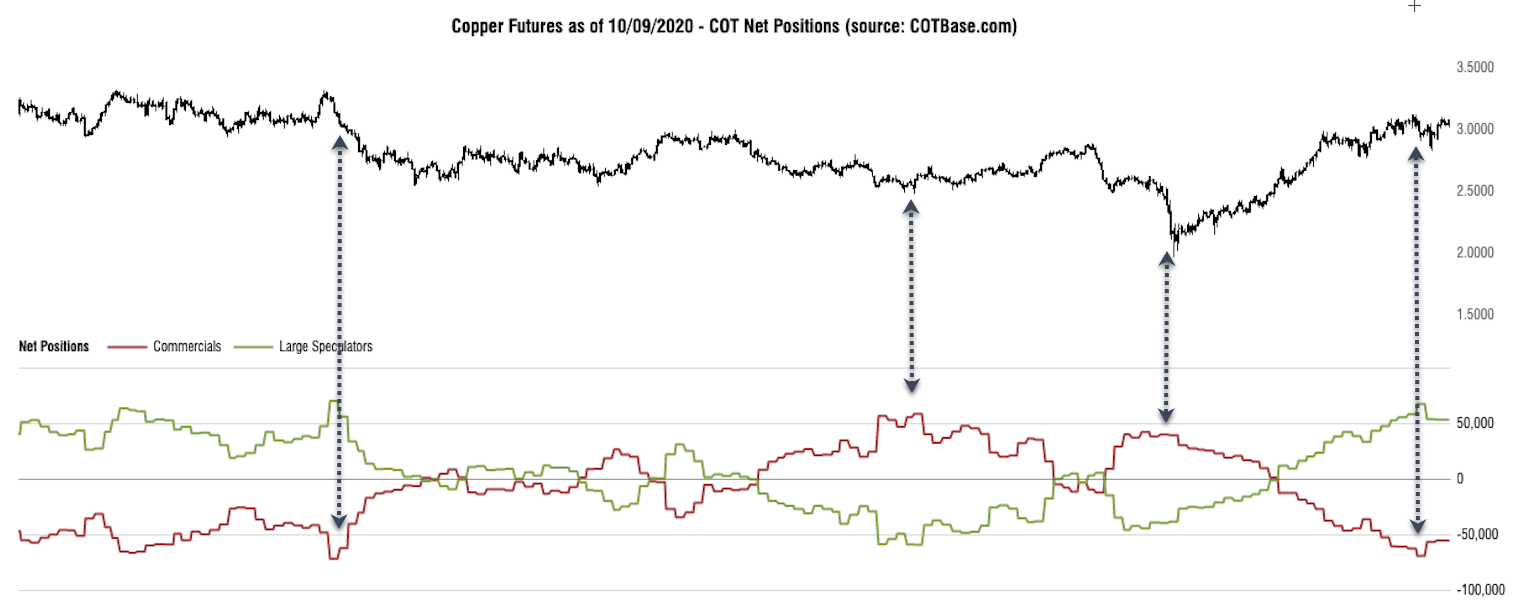
Notice whenever the commercial positions (red line) displays and extreme divergence with the large spec positions (light green line), that the price tends to follow the commercial positions afterwards. Also note how the lines begin to converge once again, as the positioning beginning to revert to the mean.
Bollinger Band Mean Reversion Trading Strategy
Let’s now illustrate an example of an actual mean reversion strategy that can be employed in the market. In this strategy, we will incorporate the Bollinger band as our volatility mean reversion set up signal. The strategy that we will detail was first introduced by Joe Ross, a veteran trader and author. The strategy is called the Gimmee bar trading strategy. Essentially, this strategy seeks to look for potential reversals near volatility extremes, particularly within a trading range environment.
Here are the rules for a long trade signal:
- Prices should be exhibiting range bound price movement, with the Bollinger bands relatively far apart.
- The price must touch the lower line of the Bollinger band.
- Wait for the first up bar following the touch of the lower band. This first up bar is referred to as the gimmee bar.
- Enter an order to buy one tick above the gimmee bar.
- Place a stop loss one tick below the gimmee bar.
- Exit the trade when the price is near or touches the upper Bollinger band.
Here are the rules for a short trade signal:
- Prices should be exhibiting range bound price movement. with the Bollinger bands relatively far apart.
- The price must touch the upper line of the Bollinger band.
- Wait for the first up bar following the touch of the upper band. This first down bar is referred to as the gimmee bar.
- Enter an order to buy one tick below the gimmee bar.
- Place a stop loss one tick above the gimmee bar.
- Exit the trade when the price is near or touches the lower Bollinger band.
Bullish Mean Reversion Trade Setup
Let’s now take a look at a forex mean reversion trade example using the strategy outlined. We’ll start off by showing a bullish trade setup. If you refer to the price chart below, you will find the chart of the US Dollar to Australian Dollar currency pair shown on the 240 minute timeframe.
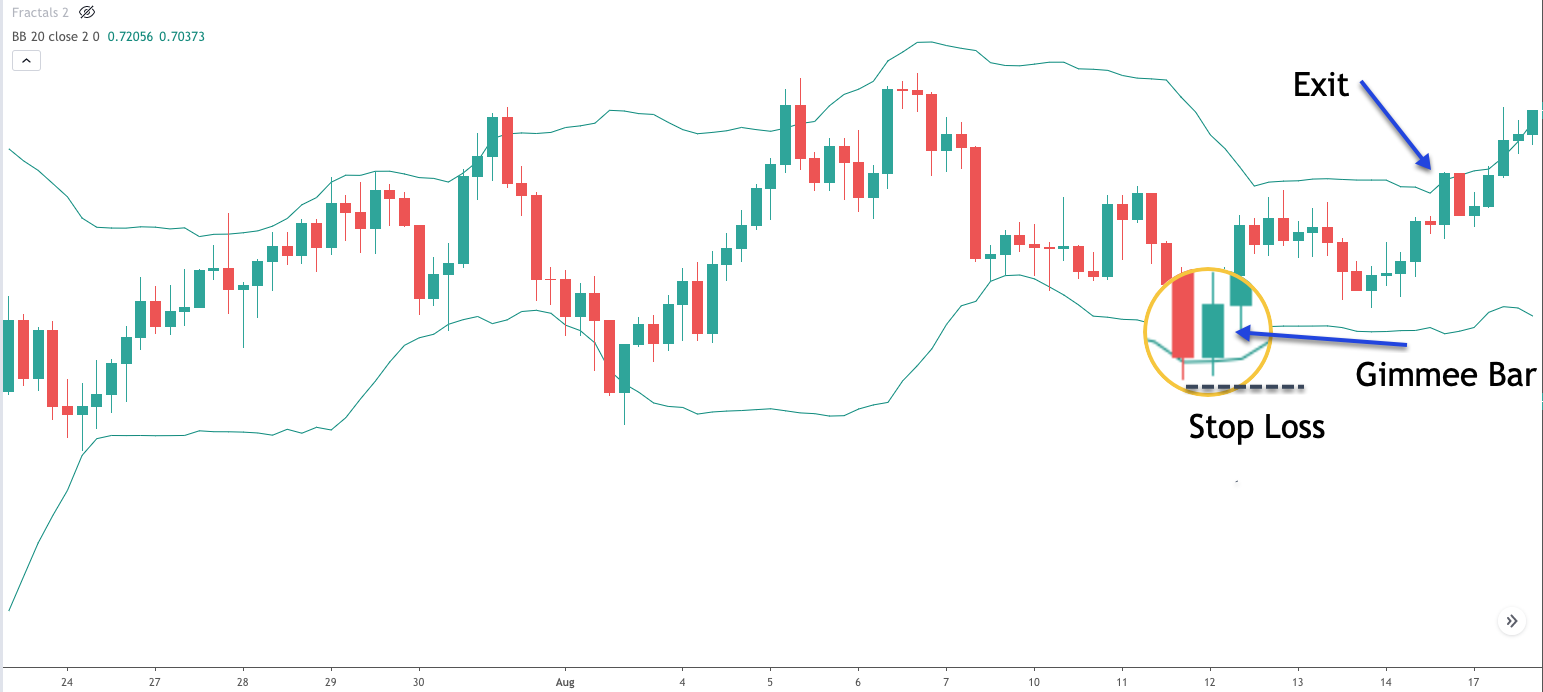
In order for us to validate this trade set up, we first need to ensure that the market is trading range bound, and that the Bollinger bands are relatively spread out. We can see the green bands on this price chart, which represents the Bollinger band technical indicator. Notice how the price action leading up to our trade set up appears to be trading within a well-defined range. Additionally, we can see that the upper and lower Bollinger bands have a good amount of space between them.
As the price action progresses, and we recognize these characteristics on the price chart, we would consider a potential mean reversion trade. If you refer to the magnified area on the chart, you will see a bearish bar which penetrates the lower band of the Bollinger band. Also, the candle immediately following that is a bullish bar. As such, the second bar is considered the bullish gimmee bar in this case. And these conditions now confirm our long trade signal.
The buy entry order would be placed one tick above the gimmee bar. You can see the gimmee bar noted on the price chart. You’ll also notice that the bar immediately following the gimmee bar does ultimately breach the high of the gimmee bar, which would have initiated our long position. The stoploss order would be placed just below the gimmee bar, which is shown by the black dashed line.
As for the potential target point, we would need to monitor the price action closely as it moves in our favor. As soon there is a touch of the upper Bollinger band, we would immediately exit the entirety of the position. You can see where that exit occurred on this particular trade if you glance over to the upper right portion of the chart.
Bearish Mean Reversion Trade Setup
We’ll now look it a bearish variation of this mean reverting strategy. On the candlestick chart below, you can see the price action for the US Dollar to Norwegian Krone forex pair based on the daily timeframe.
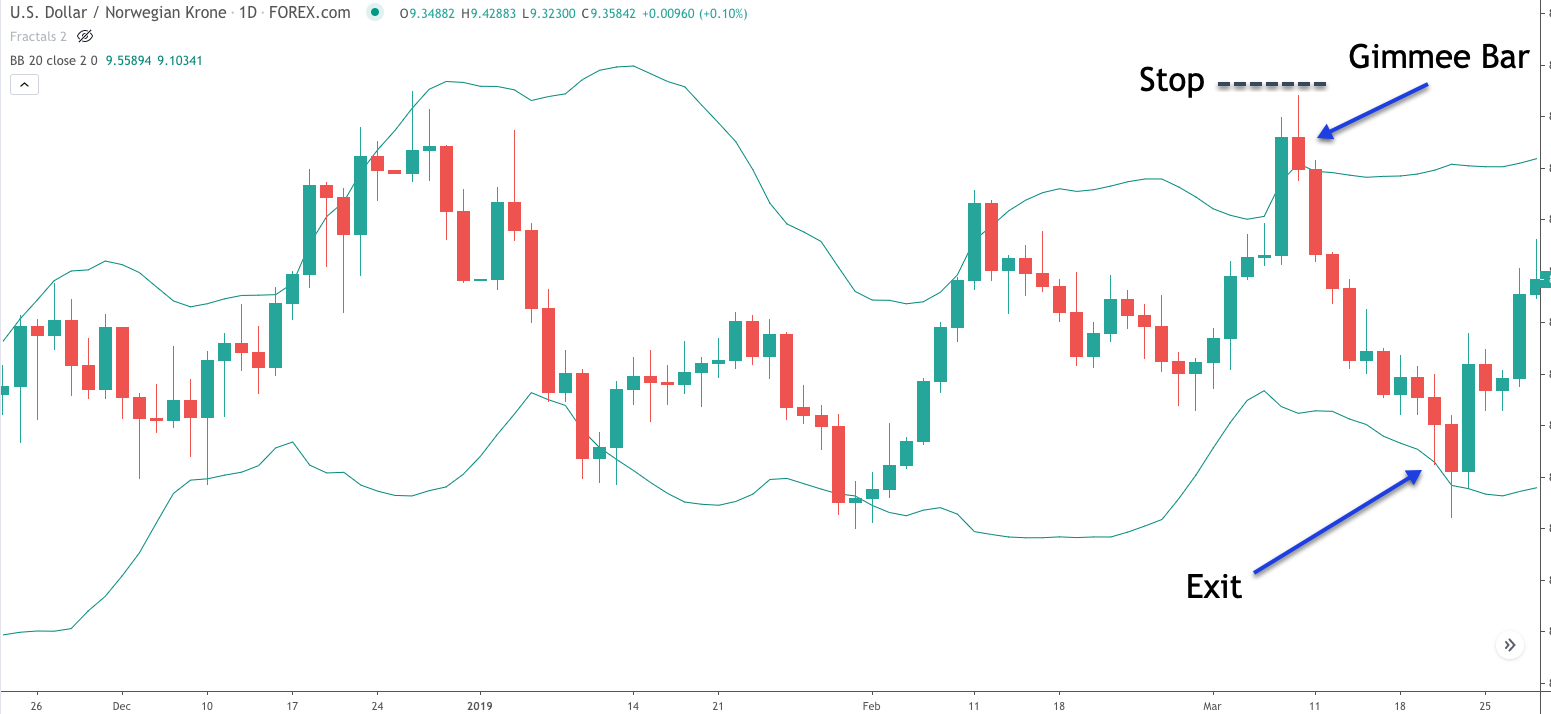
Again, the green lines on the price chart represent the upper and lower bands of the Bollinger band. To confirm the trade set up, we must witness a market condition wherein the prices are trading in a range. And also, we want to see some volatility in the market, as can be confirmed by a relatively wide Bollinger band width. The price action here clearly demonstrates that the market has been trading up and down without any clear direction, and there appears to be a relatively wide spacing between the upper and lower Bollinger bands.
Once we’re able to recognize this market environment, we would start preparing for a possible mean reversion set up. If you look towards the right side of this price chart, you can see that there was a strong bullish candle that penetrated the upper line of the Bollinger band. At this point, we would want to wait for the first down close to confirm the potential bearish set up. That down close came immediately after this referenced candle which penetrated the upper Bollinger band. You can see that first down candle, the bearish gimmee bar, noted on our price chart. That event would confirm a bearish trade set up as per our rules.
We would enter a short position upon the price breaching the lower extreme of the gimmee bar. The bar immediately following the gimmee bar would have gotten us into the short position here. The stoploss order should be placed above the high of the gimmee bar as can be seen by the dashed black line. And finally, the take profit exit point would occur upon the first candle touching the lower line of the Bollinger band, which is clearly illustrated on the price chart.
Summary
As we pointed out in this article, there are two primary modes of trading the markets. One is a trend following, or momentum based model. And the second is contrarian, or mean reversion model. We have outlined some of the characteristics of a mean reverting strategy. Additionally, we have provided an example of such a strategy that can be applied across different financial instruments.
The most important consideration that should be made when deciding between a trend trading or mean reverting mode, is the current market conditions. When you find that prices within a given instrument are more prone to directional price moves, then it may be more advantageous to take a trend approach in that particular case. On the other hand, if you find that the price action within a market is more range bound, then it may be more appropriate to trade mean reversion techniques.