The VIX is a volatility indicator that is widely followed by traders in the equities, futures and options market. Unlike most other traditional indicators, the VIX is a very unique technical study. It can help us understand the overall sentiment within the market, and the amount of fear or complacency that traders and investors are feeling at any given time.
CBOE Volatility Index (VIX) Explained
The CBOE volatility index, also referred to as VIX, is a volatility based market index that measures the expected future volatility over the next 30 day period. It is calculated from the options on the S&P 500 market index. Traders and investors will often track the SP500 VIX as a means to gauge the overall risk and sentiment within the equities market. The VIX is also sometimes referred to as the fear index.
So what exactly is volatility as it relates to the stock market? Well essentially, volatility provides a sense of the degree of market price movements over a specified period of time. The higher the observed or projected volatility, the higher the variance in the price movements of a particular stock or index. Conversely, the lower the observable or projected volatility figures, the lower the variance in price movements over the specified time.
The VIX index was created in 1993 by the Chicago Board of Exchange, CBOE. Since then it has become one of the most widely watched metrics for market volatility and risk. It is particularly useful for options traders who routinely analyze and incorporate expected volatility into their trading decisions.
As a general guideline, when the VIX index is registering a higher reading, is indicative of higher options pricing. And when the VIX is registering a lower reading, is indicative of lower options pricing.
Generally speaking, it is more advantageous to buy option contracts when volatility is relatively low, and it is more advantageous to sell or write options contracts when the volatility is relatively high. This is because during lower levels of volatility, options contracts tend to be priced cheaper, while during higher levels of volatility, options contracts tend to be priced fairly rich.
As such, the volatility premium priced within call and put options can be considered a type of risk premium. The VIX index is dynamic and rises and falls as options players interact in the marketplace.
Another interesting phenomenon to note as it relates to the VIX, is that it generally has a negative or inverse correlation to the equities market, particularly the S&P 500 index. More specifically, when the market is relatively calm, and trending higher, the VIX will register a relatively low reading. And on the flipside, when the market is selling off sharply, the VIX will began to spike higher, as more fear sets in within the market.
Understanding the VIX indicator
Now that we have a basic understanding of the CBOE VIX, let’s now discuss what the numbers within the VIX indicator mean. Basically, the VIX is a representation of the annualized expected move in percentage terms within one standard deviation for the S&P 500 index.
Keep in mind that one standard deviation represents a price move that would fall within the expected range of 68%. As a simple example, let’s assume that the VIX is currently showing a reading of 20. What this means is that, based on premiums within the options market for the S&P 500 index, that there is a 68% chance of the price of the S&P to remain within a 20% range from the current price.
When analyzing the VIX indicator, it is just as important to know the current VIX reading as it is to analyze it based on its historical trend to understand its relative basis. As a general guideline, whenever the VIX registers of reading below 20, it is considered a relatively low risk market environment.
As we noted earlier, lower readings in the VIX are consistent with an upward price movement within the equity market. Whenever the VIX begins to register readings above 20, then it is a sign of a higher risk market environment.
Below you will find the long term chart of the VIX based on monthly timeframe:
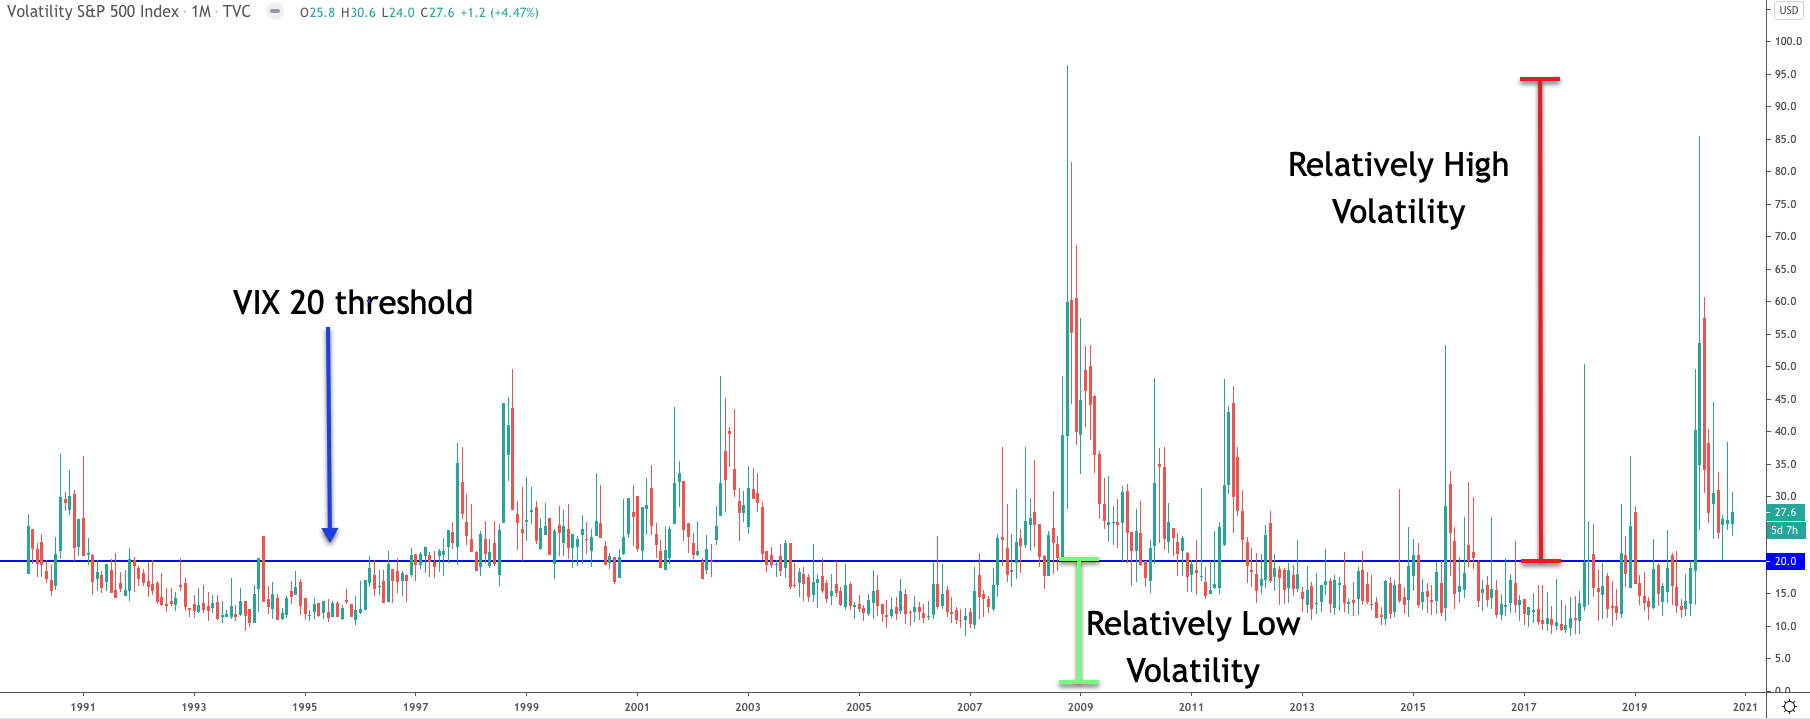
When there is heightened anxiety in the market, the VIX price reading can spike quickly higher, as market participants are more inclined to buy insurance via the options market. We can look to our historical charts and see the spikes in the VIX indicator during the Dot com market crash, the Great recession of 2008, and similar events.
Typically, VIX spikes are often short-lived, and the VIX market volatility index will begin to revert back to its historical norms. We can better understand this phenomenon by realizing that market volatility tends to be mean reverting.
Unlike price trends that can persist for long periods of time, volatility tends to be much more cyclical, and will gravitate towards its mean whenever extreme readings are registered. Although this is not a hard and fast rule, it is a historical market observation that traders should be aware of.
Obviously, geopolitical and economic events will contribute to the VIX reading. Anytime there are unforeseen adverse events in the world that can affect the US equity market,, there is a tendency for traders and investors to seek safety or engage in hedging strategies. These hedging strategies are often played out in the options market. Many times, these fears tend to be over exaggerated, and as such, the price that traders and investors pay for protection can be quite costly.
It’s a fairly well-known fact amongst professional options traders that implied volatility, or expected future volatility, often overstates realized volatility. And over time, this difference between implied and realized volatility has averaged just shy of 10%. As a practical matter, what this means is that short volatility strategies can provide a realistic market edge to astute options traders.
How To Trade VIX
Although you cannot buy the VIX directly, traders can participate in trading it by initiating a position in it via the futures market or options market. In addition, traders can access VIX related products via ETPs, which are exchange traded products. There are several products that are focused on the VIX index. Two of the more popular ones ETPs include the VXX,and VXZ.
There are a host of reasons why a trader or investor would be interested in trading the VIX. For one, it can be used as a way to hedge and existing portfolio. This is one of the more widely regarded uses for the VIX products. Additionally, pure speculators can also take a position in the VIX related products in an attempt to profit from potential changes in market volatility.
As we noted earlier, there is generally an inverse correlation between the equity market and the VIX. Once you have a solid understanding of this tendency, then you can build many different types of hedging strategies around this to protect your portfolio from adverse market moves. This is one of the best ways to incorporate the VIX within your overall trading plan.
Let’s now take a closer look at the two trading instruments that serve as proxies for the VIX stock volatility index.
VXX – iPath S&P 500 VIX Short-Term Futures ETN – This product has an extremely high average daily volume that often exceeds 30 million shares per day. It is comprised by taking a long position in both the front month, and next month futures contracts on the VIX.

VXZ – iPath S&P 500 VIX Mid-Term Futures ETN – This product is focused on tracking the intermediate term volatility within the S&P 500. It is comprised by taking a long position in the fourth, fifth, sixth, and seventh month VIX futures that are traded at the CME, the Chicago Mercantile exchange.
VIX Trading Strategy Using VXX
Let’s now detail a strategy for trading the VIX volatility index. This strategy is best applied to the VXX ETN we described earlier. We know that whenever the VIX index is declining and registering lower readings, that the market will tend to be in a lower volatility environment, with a steady uptrend in place.
Alternatively, we know that the VIX index tends to rise or spike with higher readings, whenever the markets are experiencing a high level of uncertainty or fear. As such, we will look to the VIX index reading at both the current level, and historical levels to gauge the current market environment.
Additionally, our strategy will utilize two additional technical indicators that help us time our trades. The two technical studies that we will incorporate within the strategy include the Bollinger band, and the Nine period Simple moving average.
The Bollinger band is a volatility based study that will help us to isolate a period within the market wherein a reversal is likely. As such, we will be using the Bollinger band as a mean reversion indicator within the strategy. Additionally, we will utilize the simple nine period Moving average for honing in on our entries.
Now it is important to note that this VXX strategy can be employed in both directions. As such, it can be applied as a long or short strategy. This is to say that we are looking to buy VXX when the long conditions are met, and looking to sell VXX when the sell short conditions are met. Alternatively, instead going short the VIX by selling VXX, which may not be feasible for all traders, you could also buy SVXY, which is an exchange traded fund that tracks the VXX by -0.5X.
Below are the conditions for initiating a long position for the strategy using VXX daily chart:
- VXX must be trending lower.
- The value of VXX must touch or fall below the lower Bollinger band.
- The 9 period SMA must be below the price of VXX.
- Enter a position to go long when price closes above the nine period SMA on VXX.
- Place a stop loss order below a recent swing low on the VXX
- Exit the position the day following the VXX penetrating the upper Bollinger Band.
And below are the conditions for initiating a short position for the strategy using VXX daily chart:
- VXX must be trending higher.
- The value of VXX must touch or rise above the Upper Bollinger band.
- The 9 period SMA must be above the price of VXX.
- Enter a position to go short on VXX when price closes below the nine period SMA. Alternatively, you could choose to take a long position in SVXY, which is the inverse ETF.
- Place a stop loss order above a recent swing high on the VXX.
- Exit the position the day following the VXX penetrating the lower Bollinger Band.
VIX Trade Example Using VXX
Let’s now look at a chart example that illustrates our outlined VIX trading strategy. Keep in mind, the underlying premise behind our strategy is that volatility has mean reverting characteristics, and as such, we are looking for times when volatility has become overbought or oversold. This will provide us an opportunity to fade the current extreme volatility reading in expectation for a snap back to more normal levels as seen on a relative basis.
Let’s now turn to our attention to the price chart below. It represents the VXX based on daily closing prices.
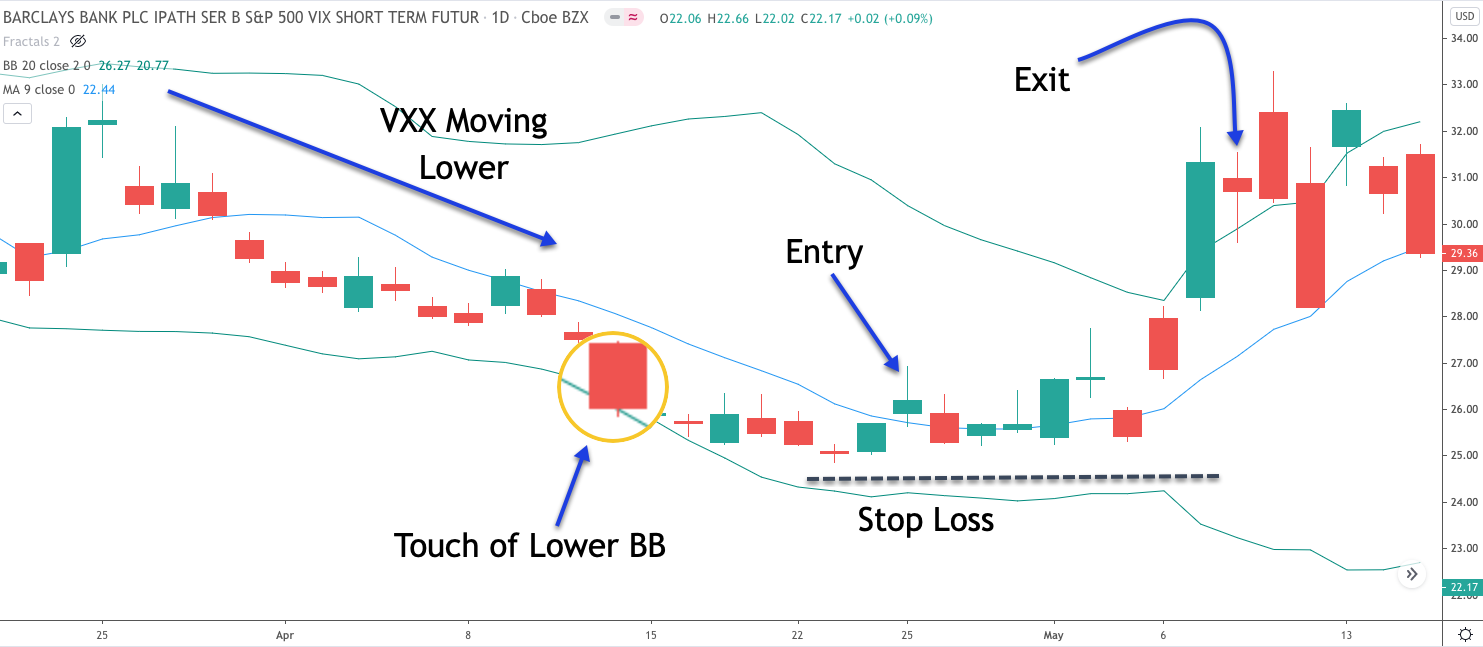
The green outer bands on this price chart represents the upper and lower lines of the Bollinger band. The center blue line is the nine period Simple moving average line. If we glance over to the beginning of this price chart, we can see that the price movement started the trend downwards in VXX. This downward price trend lasted for approximately three weeks prior to a touch of the lower Bollinger band. You can find where that actual Bollinger band touch occurred if you refer to the magnified area near the center of the chart.
Now that we have confirmed that VXX has been trending lower, and that it has penetrated the lower Bollinger band, we can prepare for a long trade set up in anticipation for volatility to revert back towards its mean. Since the touch of the lower Bollinger band represents an oversold condition in the context of volatility, we would favor an upside price movement on this VXX chart.
Our actual entry to buy will be triggered when the price crosses above the nine period SMA from below. As is evident from the price chart at the time of the touch of the lower Bollinger band, the nine period SMA was above the current price of VXX.
As such, we would’ve waited until the upside breakout and close above this moving average was confirmed. You can see where that event occurred as is referenced by the blue arrow noted as, Entry. Notice how that candle closed above the SMA(9) for the first time following the touch of the lower Bollinger band.
The stop loss would be placed at a recent swing low just below our entry signal. You can see where our stop loss would’ve been placed as is shown by the dashed black line near the lower portion of the chart.
Finally, the take profit target is dependent on the price interacting with the upper line of the Bollinger band. More specifically, when the price penetrates the upper Bollinger band, then we would exit the position on the following candle. The exit point is marked on the price chart, and would have taken us out of this trade with a healthy amount of profit.
Final Thoughts
As we’ve discussed in this article, the S&P VIX is an important measure of stock market volatility. A relatively high reading of the VIX indicates that there is fear and uncertainty in the market. And these higher readings tend to be correlated with downward price pressure.
On the opposite end of the spectrum, a low reading in the VIX is typically a sign of complacency in the market. In other words, investors feel good about the future market prospects, and as such, are not necessarily seeking additional hedging strategies via the futures or options market.
We’ve presented a few financial instruments that can be used to make bets on US equities market volatility. Two popular trading vehicles that serve as a proxy for the VIX index include that VXX, and the VXZ. Of these the VXX is a more liquid instrument, and thus is much more widely traded. On a final note, it’s important to understand the implications of a relatively high or low reading in the VIX.
We know that volatility tends to have mean reverting characteristics. As such, contrarian traders can develop strategies on the VIX that take into account extreme readings. Regardless of which equity index that you follow it’s important to monitor the VIX indicator on a regular basis. This is because, although the VIX, is a measurement of S&P 500 volatility, there is a high correlation between all the major US equity indexes.