The hammer pattern is one of the first candlestick formations that price action traders learn in their career. It is often referred to as a bullish pin bar, or bullish rejection candle. At its core, the hammer pattern is considered a reversal signal that can often pinpoint the end of a prolonged trend or retracement phase. We will dissect the hammer candle in great detail, and provide some practical tips for applying it in the forex market..
Hammer Pattern In Technical Analysis
The hammer pattern is a single candle pattern that occurs quite frequently within the financial markets. It is often seen at the end of a downtrend or at the end of a corrective leg in the context of an uptrend. Hammer candlestick patterns can also occur during range bound market conditions, near the bottom of the price range. In all of these instances, the hammer candle pattern has a bullish implication, meaning that we should expect a price increase following the formation.
Let’s take a closer look at what the actual hammer candlestick appears like. Below you will find the illustration of a hammer candle.
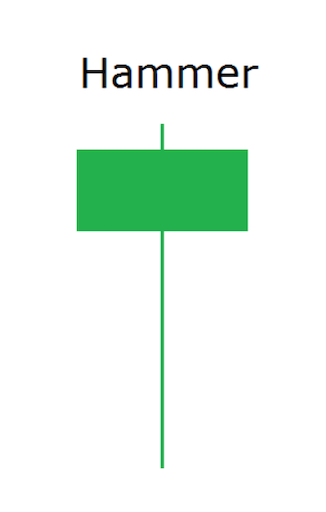
The hammer formation has a few important characteristics that we need to keep in mind in order to label it correctly as such. The first characteristic is that lower shadow or wick as its often called, is relatively large in comparison to the body of the candle and the upper wick. Typically we want the lower wick to represent at least two thirds the length of the entire candle formation.
Additionally, the body of the hammer candlestick will appear towards the upper range of the formation and represent approximately one third or less of the entire formation. The upper wick should be relatively small or nonexistent within this entire structure.
Now that we understand the essential structure of the hammer chart pattern, what can we gauge from this particular formation? Well, let’s take a look at the market psychology inherent within the hammer candlestick. The relatively large lower wick within the structure can be viewed as a price rejection. That is to say that what is actually occurring behind the scenes is sellers make an attempt to push prices lower, which they are able to do, but only on a temporary basis.
This is because the buyers step into the market to take the other side of that order flow and eventually overwhelm the sellers orders. This causes the price to close near the upper end of the candle formation. As such, we can say that during the specific time interval in which the hammer candlestick formed, demand from the buyers exceeded supply from the sellers, signaling a strong potential for an upside price move.
Price action traders typically utilize the hammer candlestick in two primary functions. The first and more popular use of this formation is as an entry technique. When you see a hammer candlestick form around a key support level such as a trendline, a horizontal price line, a Fibonacci retracement level, a round number, or an important moving average line, it can be used as a signal to enter a long position in the market. In addition to this, candlestick traders who may be in a short position also watch out for this formation, using it specifically as a signal to exit their short position. So in this sense, it can be used as part of a trade management strategy.
So far, what we have described is the traditional hammer candlestick. This should not be confused with the inverted hammer candlestick pattern which has a different type of appearance, but wherein the implication is the same. That is to say that an inverted hammer candlestick also has a bullish implication. We’ll be taking a closer look at the inverted hammer candle a bit later.
Bullish Hammer Candlestick Examples
Let’s now take a look at a few examples of a bullish hammer as seen on a forex price chart. Below you will find the candlestick chart for the GBPUSD currency pair shown on the daily timeframe.
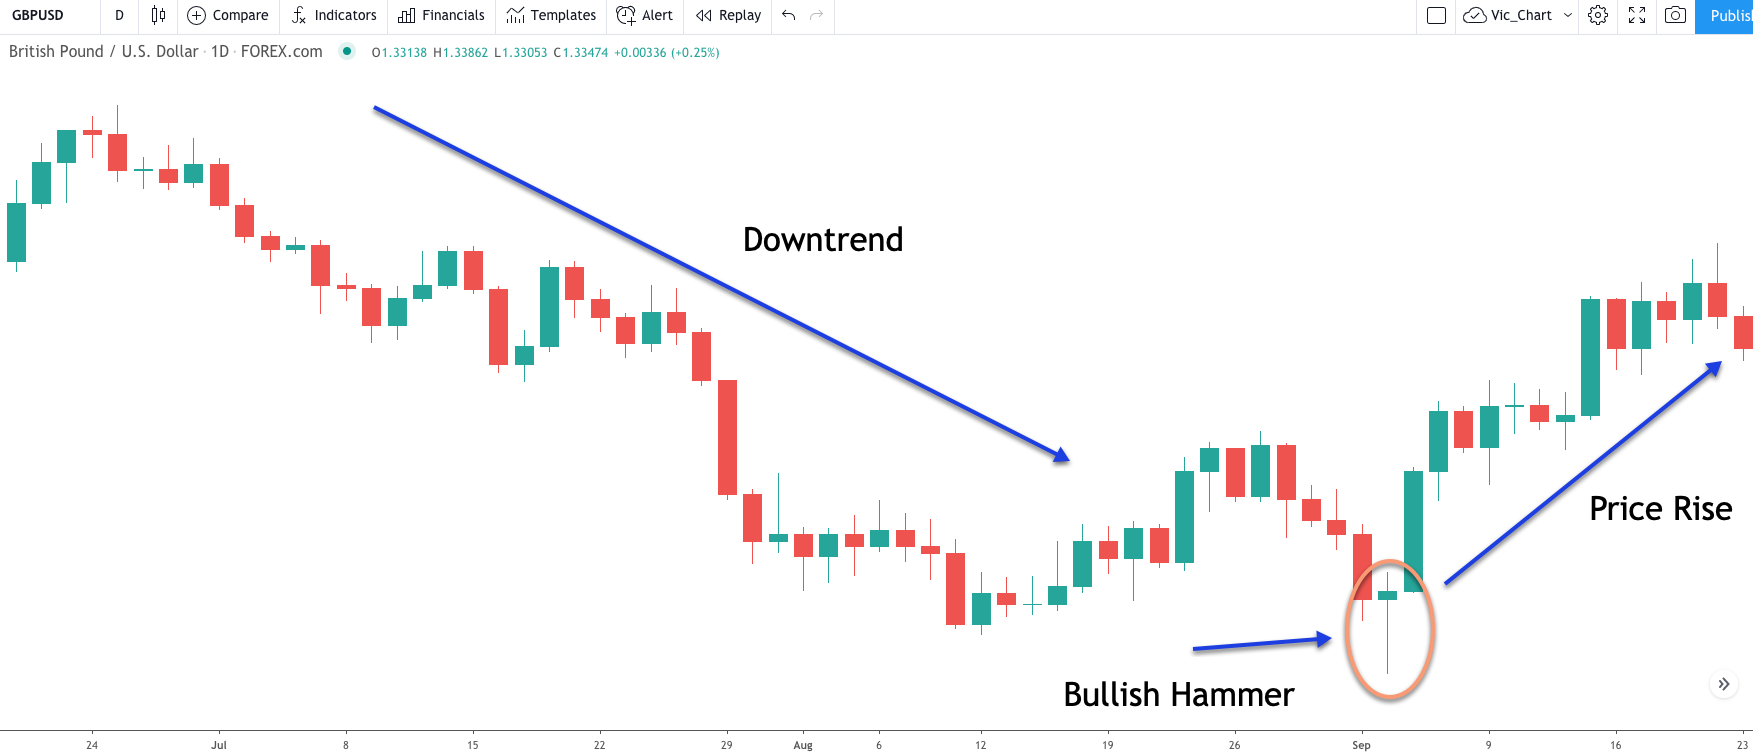
Starting at the far left of the price chart, we can see that the price action here has been carving out a downtrend. After some period of consolidation and a minor upside retracement, prices resume their downward descent and eventually a bullish hammer candlestick pattern emerges. After the bullish hammer candle completes, a price reversal occurs in the market, and prices began to rise steadily.
If you look closely at the bullish hammer within the circled area, you can see that this candle meets all of our required characteristics for a hammer formation. More specifically, notice how the length of the lower shadow is at least two thirds of the entire formation. Additionally you can see that the body of the hammer candle is relatively small and closes near the upper end of the range. Finally, notice the relatively small upper wick within this formation.
Let’s now turn to another example. This time we will illustrate the hammer candlestick in an uptrend. Below is the chart for the AUDNZD forex pair shown on the daily timeframe once again.
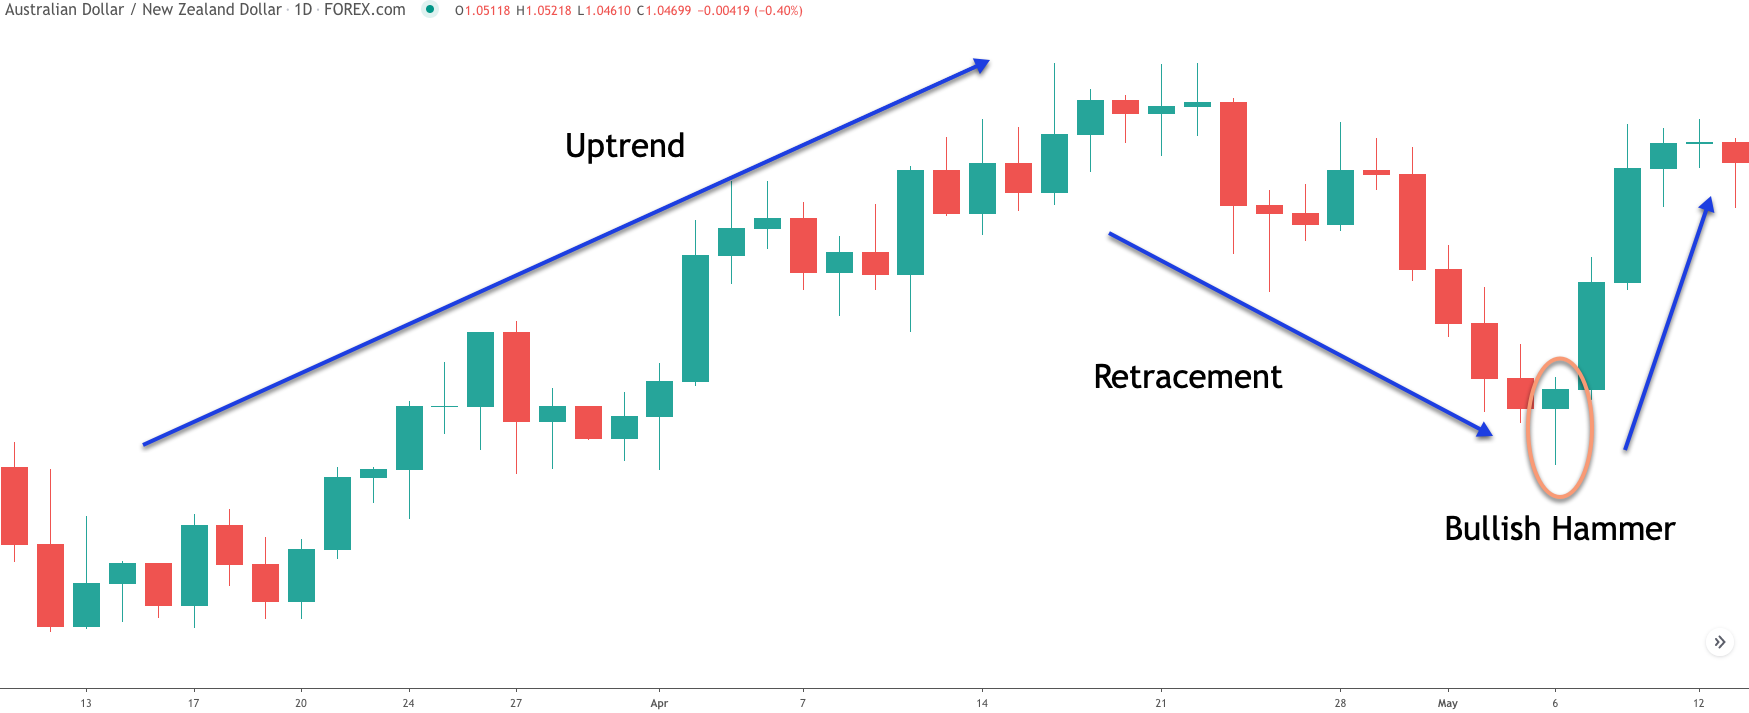
Notice on this chart, the price starts off by forming an uptrend with successively higher highs and higher lows. Towards the center of the chart we can see that the momentum of the uptrend begins to wane, and the price subsequently moves lower within a corrective or retracement phase. You can see the three distinct price legs within that retracement lower. It’s a down, up, down sequence. Can you see that? This is often referred to as a zigzag correction or ABC correction.
Eventually we can see that the final candle within this corrective structure forms a bullish hammer formation. That would have provided us with an early notice that the corrective phase is nearing an end, and we should expect prices to move higher in the direction of the larger trend. Immediately after the bullish hammer formation, we can see two strong bullish candles form that propel the price of this currency pair higher.
One thing that we should note as it relates to hammer formations is that it is difficult to gauge the extent of the price move resulting from the bullish hammer formation. Nevertheless they can provide for an excellent timing signal for entering a long trade, as we have seen in the above two examples.
Inverted Hammer Candlestick
The inverted hammer chart pattern is a variation of the traditional hammer pattern. Essentially, it appears as an upside down hammer formation. That is to say that within the inverted hammer candlestick, the relatively long wick appears above the candle’s body, and it is typically at least two thirds the length of the entire formation. You can see an illustration of the inverted hammer formation below.

If you’re familiar with different candlestick patterns, you will recognize the above formation as being similar in appearance to the shooting star formation. The primary difference between the inverted hammer and the shooting star is the location in which it appears. A shooting star formation typically occurs near the top of a trading range, or at the top of an uptrend.
The inverted hammer pattern on the other hand is usually seen in the same locations as the traditional hammer formation we studied earlier. That is to say that the inverted hammer will occur at the bottom of a price range in a range bound market, at the bottom of a downtrend, or during the end of a bearish correction within the context of a larger uptrend.
Now although the inverted hammer candlestick is one that candlestick traders should be familiar with, it is the traditional hammer candlestick that provides the more reliable and powerful trading signal. As such, it’s best to focus on the hammer pattern because it will provide us a better probability of success compared to the inverted variation.
Trading Hammer Candlestick Pattern
Let’s now build upon our knowledge of the hammer candlestick pattern. We’ll create a price action strategy for trading this pattern. We will rely only on the naked price chart for this strategy, and thus not need to refer to any trading indicators or other technical study. Although this hammer trading strategy may appear overly simplistic, it is nevertheless, very effective when traded under the right market conditions.
This strategy is best traded on the higher timeframe charts such as the daily and weekly time frames. You may consider going down to the 480 or 240 minute chart, but keep in mind that the best and highest probability signals will occur on the higher time frames noted. Additionally, it can be applied to any currency pair or financial instrument, so long as it is fairly liquid.
So here are the conditions for entering a long position using this Hammer strategy:
Locate a hammer candlestick on the price chart.
A well-defined downtrend should be in place prior to the formation of the hammer candle.
The hammer candle should be at least equal to or larger than the average length of the candles within the downtrend.
Enter a long position immediately following the hammer candle’s formation, assuming the above conditions have been met.
The stoploss should be placed just below the low of the hammer candle.
The take profit target will be equal to the length of the hammer candle measure from the high of the hammer candle.
Forex Hammer Candlestick Trade In NZDJPY
Now that we have clearly outlined the hammer candle trading strategy, let’s illustrate an example on a real price chart. Below you will find the daily chart of the New Zealand Dollar to Japanese Yen currency pair.

As we can see from the price action, there was a steady decline in the price of the NZDJPY currency pair. Towards the middle part of the chart, we can see that the prices began to compress in a tight consolidation structure. Soon afterwards, another price leg ensued to the downside which ended with the formation of a hammer candlestick.
Notice how the hammer candle meets all of the three requirements that validates its pattern. The lower shadow within the hammer formation is at least two thirds the length of the entire candle. The body of the candle is relatively small and is situated in the upper third of the candle’s range. And the upper shadow is nonexistent, or minimal compared to the size of the lower shadow. With these three requirements met, we can confirm that the candle that we are analyzing is a valid hammer formation.
Now, we can move on to the next step to see whether or not a viable trading opportunity exists. To do so, we have to confirm that a prior downtrend was in place prior to the hammer candlestick formation. Obviously we can see here that this condition clearly exists. Let’s now go back to the hammer candle itself to study it’s size in relation to the average candle size within the progression of the downtrend.
We can do this quantitatively by using an indicator such as the Average True Range, ATR indicator. However, keep in mind our strategy does not explicitly call for utilizing any type of indicator study. As such, if we just eyeball the hammer formation, we can be pretty confident that it is larger in size than the average candle within the downtrend. And with that piece of confirmation, we can prepare for a long trade in the NZDJPY currency pair.
Now that all of our conditions have lined up, we can immediately place a market order to go long. The stop loss for this trade would be set at a level just below the low of the hammer formation. This is noted on the price chart and shown below the entry. Finally, we will utilize a one-to-one measured move technique for exiting a profitable trade. More specifically, the target will be set at a length equivalent to the size of the hammer pattern measured from its high.
This measurement is illustrated using the two vertical brackets shown on the price chart. The lower vertical bracket represents the length of the hammer candle, while the upper vertical bracket represents its equivalent length projected upward. Soon after the entry was initiated, the price retraced a bit before resuming to the upside ultimately reaching our target and taking us out with a profitable result.
Forex Hammer Candle Trade In AUDJPY
Let’s now move on to a second example that demonstrates the hammer candle strategy outlined earlier. Below, you will find the price chart for the Australian Dollar to the Japanese Yen cross currency pair shown on the daily timeframe.
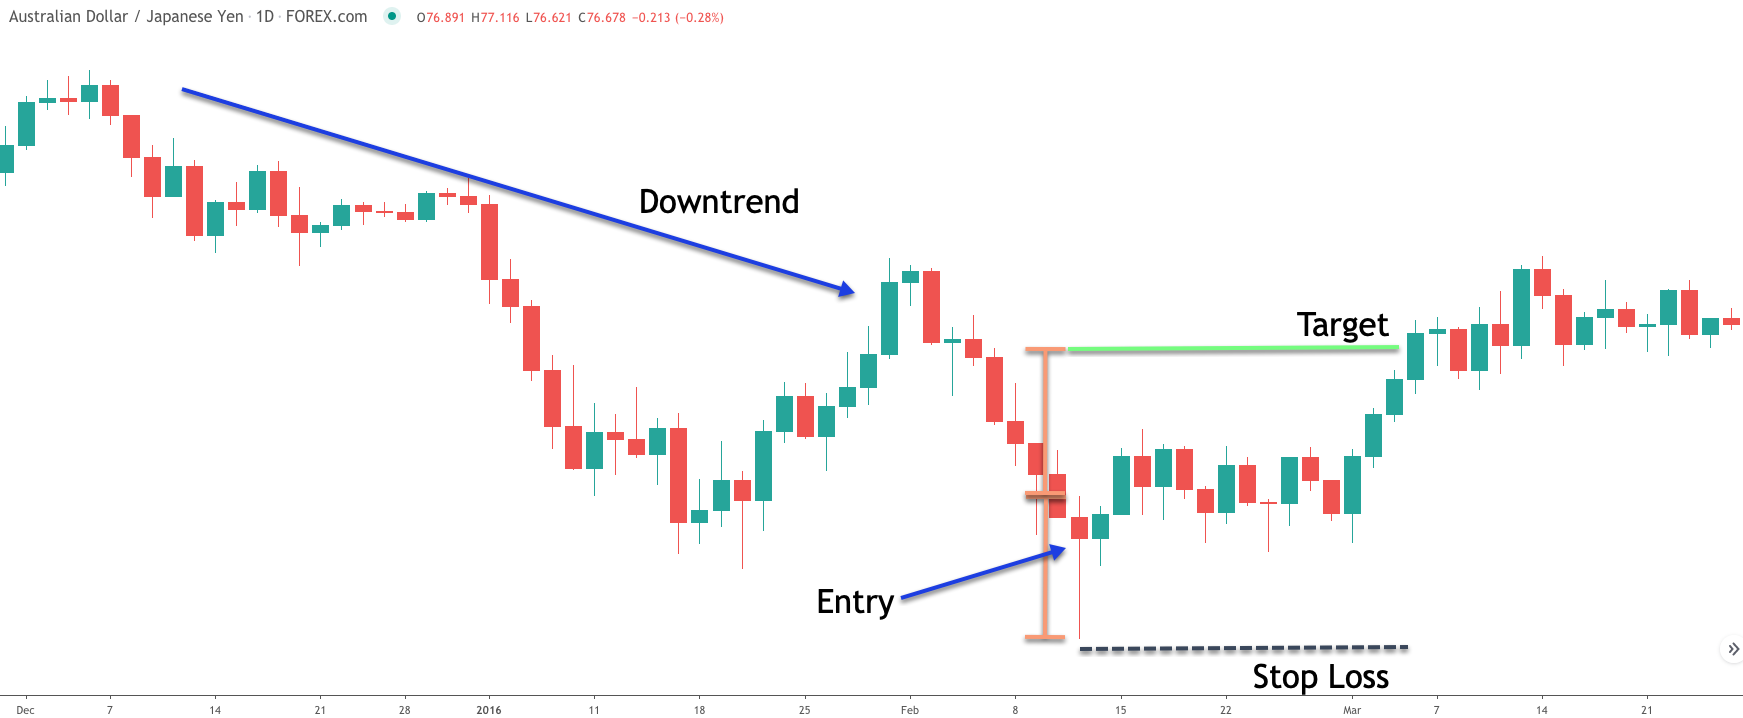
Again here the idea is to look for a potential reversal of a downtrend using the hammer formation as our primary signal. So what can we gather from this AUDJPY price chart? Well, starting from the far end, the price appears to have put in a swing high. Shortly thereafter we can see a series of red candles which forms the beginning of this downtrend. A short consolidation forms after this first leg, and then the price continues lower sharply within the second leg of this downtrend.
Then the price makes a fairly deep retracement against the downtrend and ends that correction in what appears to be an evening star candlestick formation. Soon after, the third and final leg within this downtrend resumes leading to the hammer formation that we can see near the bottom of the price chart.
If we take a moment to analyze the characteristics of this hammer formation, we will notice that it meets all of the necessary requirements. That is to say that the lower wick is at least two thirds the size of the entire formation, the body is relatively small and situated near the top one third of the range, and the upper wick is relatively small in relationship to the lower wick.
As such, we can confirm that this candle is a valid hammer formation. We’ve also seen that the hammer candlestick occurs in a downtrend which fulfills another condition for entering into this trade setup.
Lastly we want to make sure that the size of the hammer formation is at least equal to or larger than the average candles within the downtrend. Again, if you visually look at the length of the hammer candle and compare it to the other candles within the bearish trend, you can easily surmise that its length is indeed larger than the average. That fulfills all of the requirements for initiating a long trade based on this hammer trade set up.
The entry order is noted on the price chart and should be placed immediately following the confirmation of our conditions above. The stoploss would be set at a level that is just below the low of the hammer candle as noted by the black dashed line below the entry.
And as for target, it will be set at a level that is equivalent to the length of the hammer candle itself. That measurement is shown using the orange vertical brackets. The price action following the entry signal traded in a sideways manner for about two weeks before breaking to the upside and reaching our measured target level.
Summary
The hammer formation is one of the most reliable reversal patterns within the entire library of candlestick patterns. It is also one of the easiest to recognize, and simplest to trade. But although it’s a fairly simple pattern to trade, it does require a good deal of discipline and fortitude to execute properly.
That is because it is essentially a countertrend signal. When the market is trending lower it can be especially difficult to buck that trend and take an early long position. Nevertheless, when traded with prudence and strict risk control measures, the hammer pattern does offer a solid contrarian trade set up with a viable edge.