Fibonacci expansions is a lesser-known Fib analysis technique. The more common fib application used by traders is Fibonacci retracements. Nevertheless, Fib expansions offer similar advantages, and can help a trader locate potentially significant areas of support and resistance that are not readily visible on the price chart. As such, this article will be devoted to explaining everything you need to know about Fib expansions and their uses in the market.
What Are Fibonacci Expansion Levels?
Fibonacci expansions are also often referred to as Fibonacci projections. These two terms are interchangeable, and so, when we are referring to either a Fib expansion or a Fib projection we are speaking about the same thing. So what exactly are Fibonacci expansions or Fibonacci projections and how can they be applied in market analysis?
Well, Fibonacci expansions can be seen as price levels that represent hidden support and resistance on the price chart. They can be used in a myriad of ways, but their best use is in locating potential entry and take profit zones.
These levels are considered hidden because unlike traditional horizontal price levels which are drawn from various swing points or other obvious levels on the price chart, Fibonacci expansions are derived using a very specific technique that’s not particularly well known to many outside Fibonacci-based trading circles.
Essentially, Fibonacci expansions allow us to project how far a potential price move is likely to travel. This price move is typically considered an impulsive price move, in the context of Elliott wave. That is to say that it will typically follow a corrective phase and thus form a new trend leg in the direction of the larger trend.
In that way they are very different compared to Fibonacci retracements. Unlike Fibonacci retracements which measure an internal retracement against a larger trend leg, a Fibonacci expansion or projection measures an external price leg.
Let’s take a look and see an example of how Fibonacci expansion levels appear on the price chart.
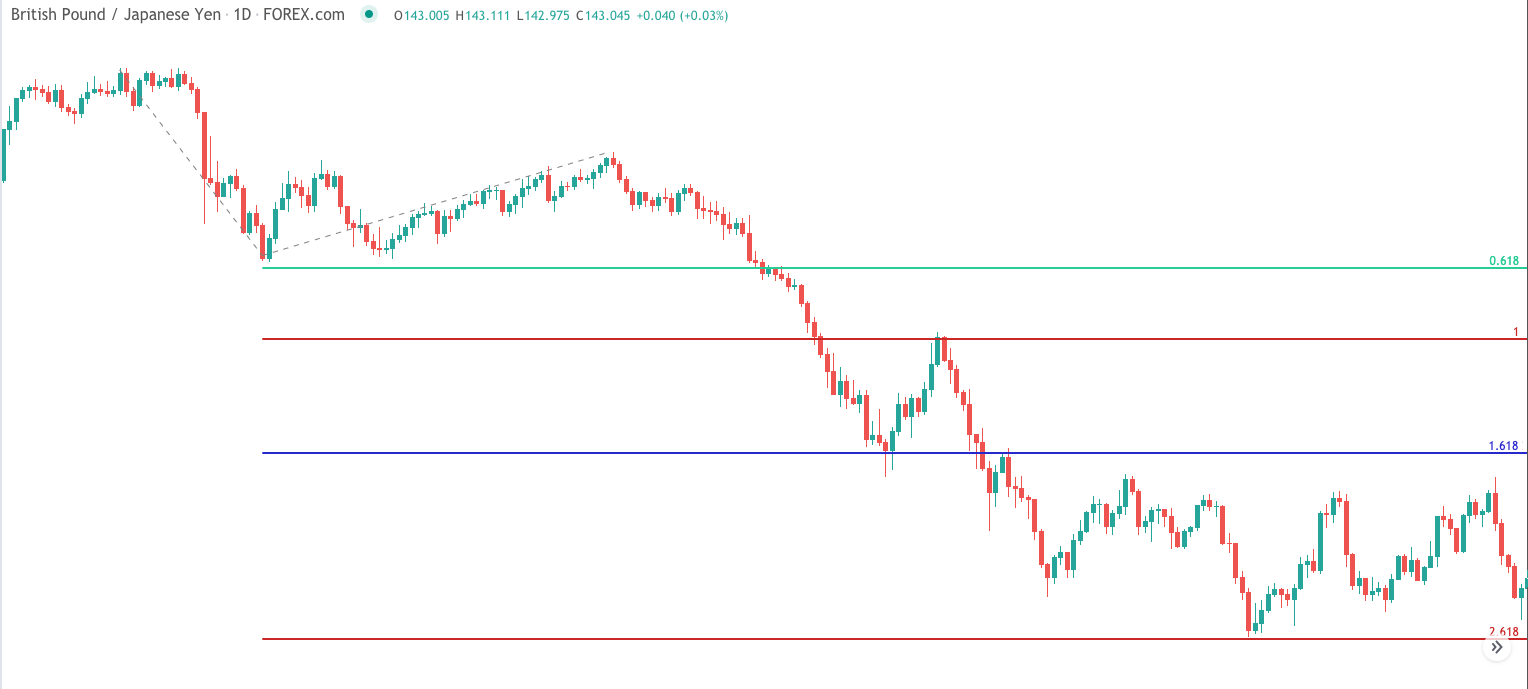
On the price chart above, you can see four horizontal price lines that represent the primary Fibonacci expansion levels. This includes the upper green line which displays the 0.618 fib level, the red line right underneath it which displays the 1.00 fib level, the blue line which represents the 1.618 fib level, and lastly the lowermost horizontal line which represents the 2.618 fib level. Notice in this example how the price interacts at the various fib expansion levels plotted.
Now although Fibonacci expansions can be utilized as a stand-alone analysis technique, when you find that there is a cluster of Fibonacci levels based on different price swing measurements, the area where such a cluster occurs is considered to be much significant. As an example, if you find that on the daily chart a 100% Fibonacci expansion coincides with a Fibonacci retracement level seen on the weekly chart of 61.8%, then we can be more confident that this particular level will serve as a major support or resistance level as price approaches it.
How To Calculate Fibonacci Projections?
Fibonacci projection levels are calculated using specific Fibonacci ratios. And Fibonacci ratios are derived from the Fibonacci sequence of numbers. The Fibonacci sequence of numbers is a series of numbers that starts with zero and one, and continues by adding the next number with its former number. For example here is the beginning set of numbers within the Fibonacci sequence.
0, 1, 1, 2, 3, 5, 8, 13, 21, 34, 55, 89, 144, 233, 377, 610, 987… And so on and so on into infinity.
The Fibonacci sequence of numbers has many special characteristics that are seen across the natural world and within the markets. Let’s demonstrate these characteristics with some examples.
When you divide one number in the series by its latter number in the series, the resultant number approaches 0.618 or 61.8%.
If we calculate 610 divided by 987 we get 0.618
If we calculate 144 divided by 233 we get 0.618
If we calculate 55 divided by 89 we get 0.617
Looking at another example, when you divide one number in the series by its former number in the series, the resultant number approaches 1.618 or 161.8%.
If we calculate 377 divided by 233 we get 1.618
If we calculate 89 divided by 55 we get 1.618
If we calculate 21 divided by 13 we get 1.615
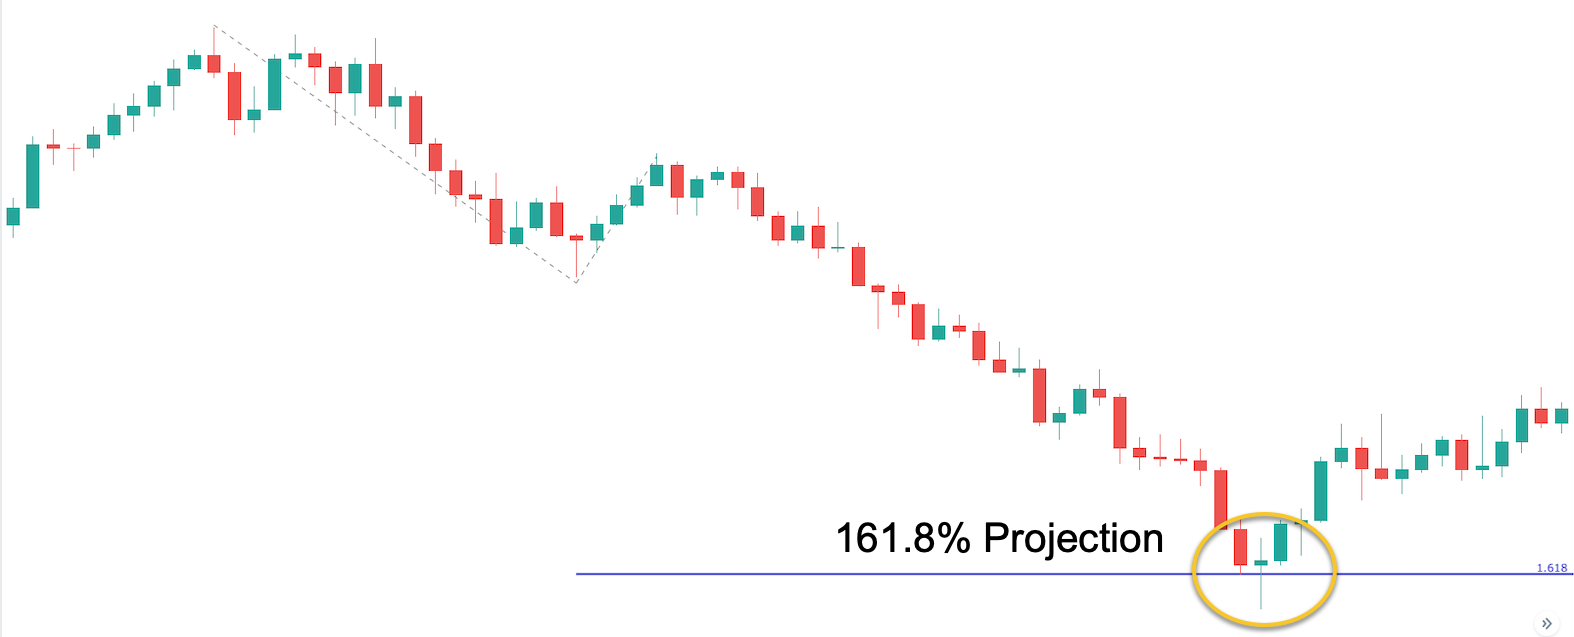
Below you can see the Fib 1.618 projection ratio is action. Notice how the price tests the 1.618 level, before bouncing higher. This level acted as strong support for the downtrend.
Additionally, when you divide one number in the series by its second former number in the series, the resultant number approaches 2.618 or 261.8%.
If we calculate 987 divided by 377 we get 2.618
If we calculate 144 divided by 55 we get 2.618
If we calculate 55 divided by 21 we get 2.619
The Fibonacci ratios shown within the above examples represent important Fibonacci projection levels that are often seen within the financial markets. Along with the 0.618, 1.618 and 2.618 Fibonacci projection levels, the 1.00, and 1.27 Fibonacci projection levels are also considered quite important within the context of price movements within the financial markets.
Drawing Fibonacci Projections
Let’s now discuss how to go about drawing Fib price projections on your price chart. Depending on your charting software, the Fibonacci projection tool may be called by a few different names. Often the tool is named as a Fibonacci projection tool, Fibonacci expansion tool, or in some cases a Fibonacci extension tool.
Although Fibonacci extensions are actually a different type of study altogether, some platforms actually go by this name which is actually not the correct naming convention. In any case, you will have to look into your charting platform for specifics on this.
The Fibonacci projection tool requires the selection of three swing points. Once you select the three swing points, the Fibonacci projection levels will automatically plot on your price chart. So how does one go about selecting the specific swing points?
Well, in the case of an upside price projection, you would start by selecting the beginning of the price move. Then you would select the high of that specific price move. Finally, you would select the swing low that retraces this upside price leg.
Below you can see an illustration of how the Fibonacci projection tool works.
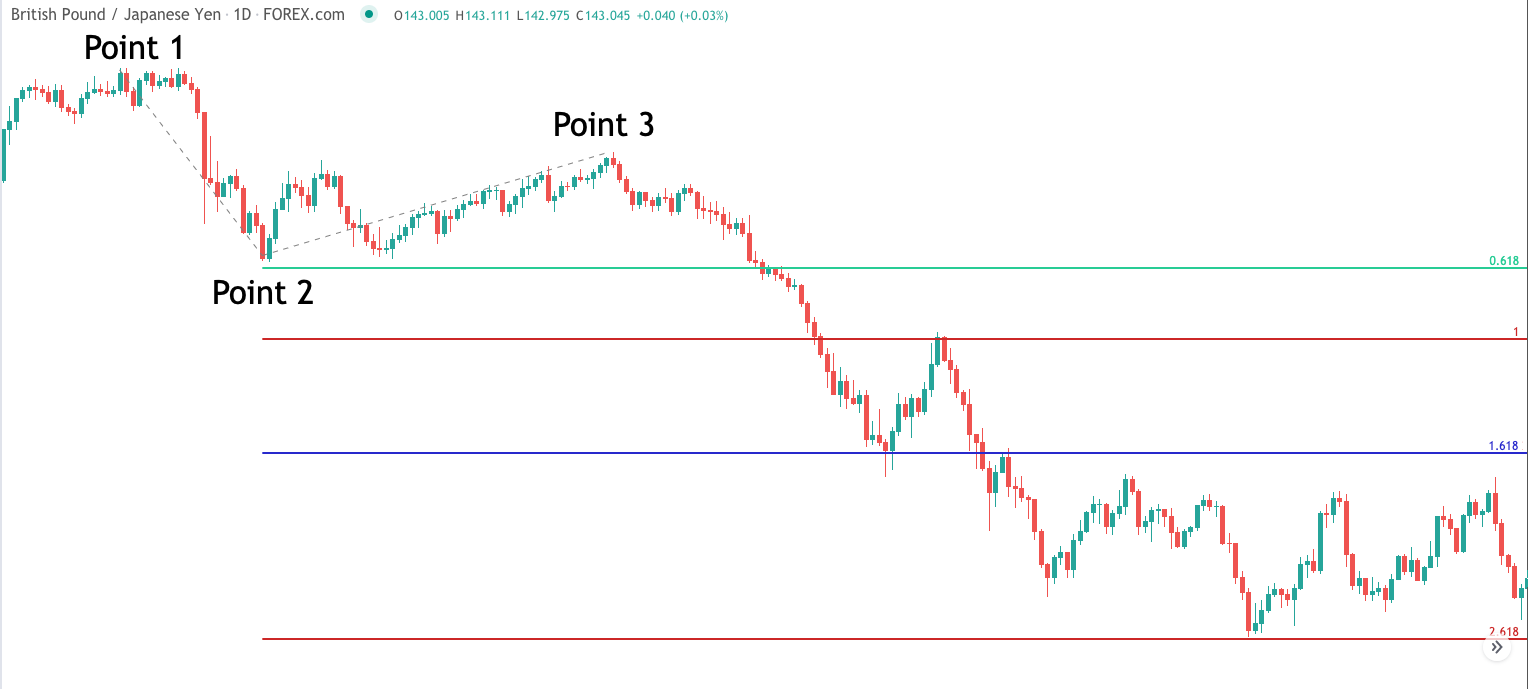
Referring to the same price chart that we looked at earlier, you can see the important swing high noted as point 1. This is the first important swing that should be selected. As prices move lower within this price leg, it ends at point 2, which represents the important swing low that should be selected. Finally we see a correction that retraces the price move between point 1 and point 2. The terminal point of this correction is displayed as point 3. And this secondary swing high would be the last point selected for plotting the Fibonacci projection levels.
As we had alluded to earlier, these Fibonacci projection levels provide excellent entry and take profit points during an open trade. Some traders prefer to use one or two very specific Fib projection levels for exiting the trade in full, when those levels are reached. Others traders prefer to scale out of their position as price approaches each important Fib projection level.
For example, a trader that uses the scale out technique could exit one third of their position at the 100% Fib projection level, and exit another one third of their position at the 127% Fib projection level, and then exit the final one third of their position at the 161% Fib projection level.
Fib Expansion Trading Strategy
Let’s now build a trading strategy that incorporates the Fibonacci expansion trading technique. The strategy that we will describe will utilize just two technical studies. The first will obviously be the Fib expansion tool, and the second will be the Price Rate of Change indicator, also referred to as ROC.
The Price Rate of Change indicator is a momentum indicator that can help identify periods wherein the momentum within the price action begins to favor one side of the market versus the other. The default look back period for the rate of change indicator is nine periods, which is what we will be using.
Below are the outlined rules for entering and managing a long trade using this trading strategy.
- The price must touch or come very close to touching the 127% Fibonacci projection level.
- Upon the price interacting at the 127% fib projection level, the ROC indicator must be below the zero line.
- Within a maximum of 20 bars from the point at which the price interacted with the 127% projection level, the price must cross above the zero line of the ROC indicator.
- Upon all of the above conditions being met, and entry order to buy would occur at the open of the following price candle.
- The stoploss would be placed at the lowest low below the 127% Fib projection level.
- The exit for the trade will be the price low that was used in plotting the Fibonacci expansion levels.
Below are the rules for entering and managing a short trade using this trading strategy.
- The price must touch or come very close to touching the 127% Fibonacci projection level.
- Upon the price interacting at the 127% fib projection level, the ROC indicator must be above the zero line.
- Within a maximum of 20 bars from the point at which the price interacted with the 127% projection level, the price must cross below the zero line of the ROC indicator.
- Upon all of the above conditions being met, and entry order to sell would occur at the open of the following price candle.
- The stoploss would be placed at the highest high above the 127% for projection level.
- The exit for the trade will be the price high that was used in plotting the Fibonacci expansion levels.
Fib Expansion Trade Example 1
Let’s look at an example of the Fibonacci expansion strategy outlined in the prior section. Below you will find the price chart of the Euro Yen cross currency pair shown on the weekly timeframe.
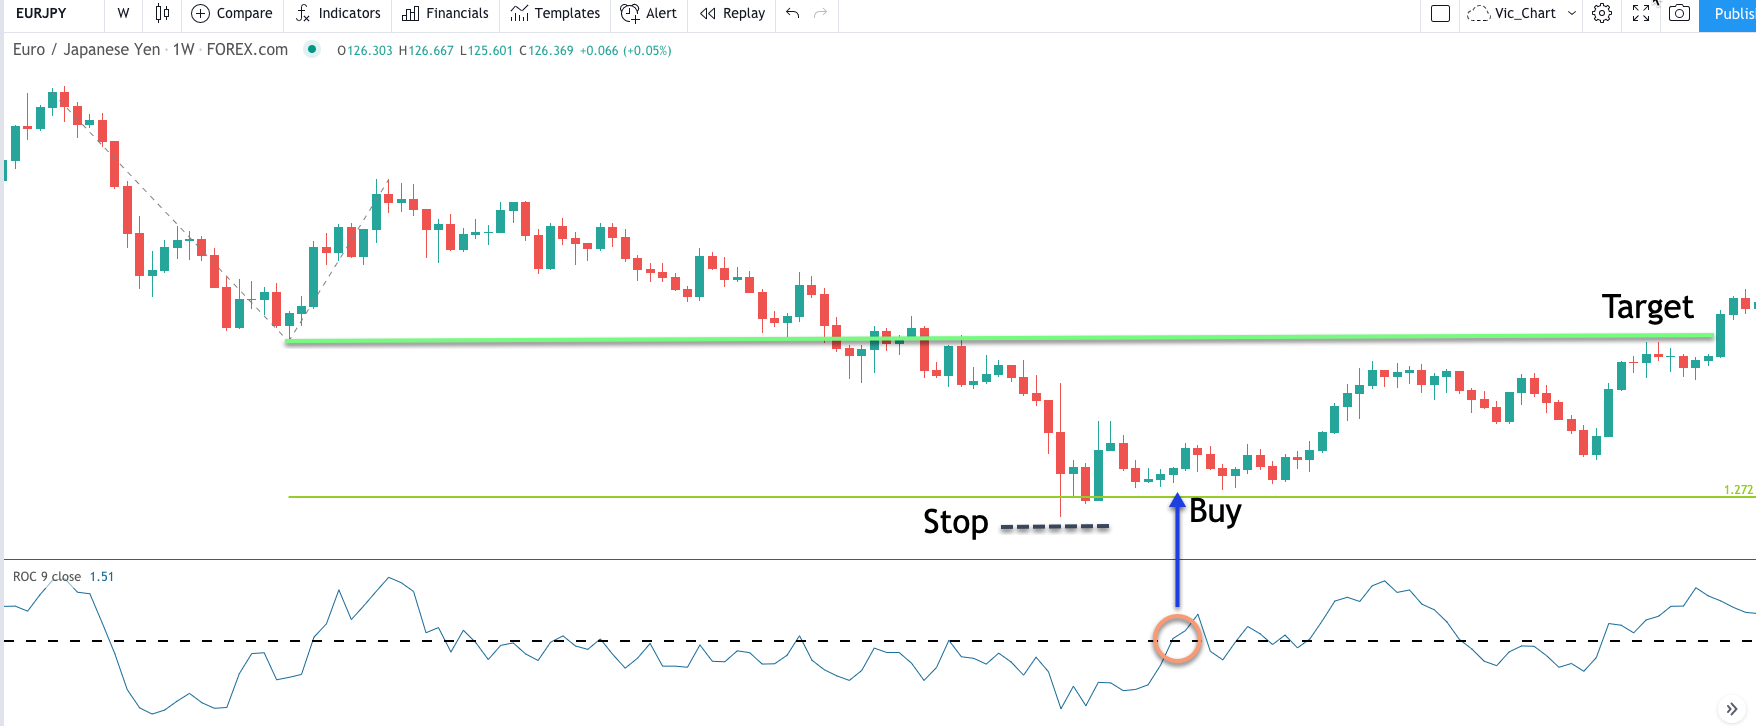
As we can see from the far left of the chart, the price action made an intermediate swing high. This led to two impulsive price legs to the downside, which was corrected by one upward price move. As price was moving lower within the second leg, we could use the Fibonacci expansion tool to draw the 127% expansion level.
For plotting this level, we would select the intermediate swing high at the far left of the price chart as the first point, the swing low that ends this initial leg down as the second point, and the termination point of the upward corrective move as our third and final point.
Once we selected these three points, then the Fib expansion tool would automatically plot our desired 127% level. This level is shown on the price chart as the light green line near the bottom of the price action. Keep in mind, that each charting platform will work a little bit differently, and you may need to deselect any other projection levels that it may plot, or simply select only our desired 127% level.
In any case, once the 127% projection level has been plotted, we would wait for price to either touch the level, or come relatively close to touching it. In this case, we can see that the price did in fact touch the 127% projection level. At this point, we would want to analyze the position of the ROC indicator line to confirm that it is positioned below the zero line.
As is evident from this price chart, we can see that at the time of the initial price interaction with the 127% projection level, that in fact, the ROC line was positioned below the zero line. The zero line is represented by the dashed horizontal line within the indicator window.
Now we would patiently wait until the ROC indicator line moves above the zero line. Additionally, we want to ensure that this occurs within 20 bars of the initial interaction with the 127% level. This is an important condition because if the 127% fibo projection level is to be considered a strong support level, we should see a reversal off of this level in a relatively short period of time.
And as such, we use 20 bars as that maximum time threshold. Examining the price chart once again, you will notice the circled area within the ROC indicator that shows where the upward zero line cross occurred. This would have served as our entry trigger and we would initiate a buy order on the very next candle.
The stop loss would be placed just below the lowest low following the interaction with the 127% level. The take profit level at which to exit the trade would be placed at the swing low used for plotting the fib expansion level. That level is shown by the bold upper green line marked as, Target. Once we had entered into this trade to the long side, the price action began to move higher in a stairstep manner, ultimately leading to our target level being hit.
Fib Expansion Trade Example 2
Let’s now illustrate another example of this Fib projection strategy. This time we will refer to the Australian dollar to US dollar currency pair based on the daily timeframe. You can see this chart shown below.
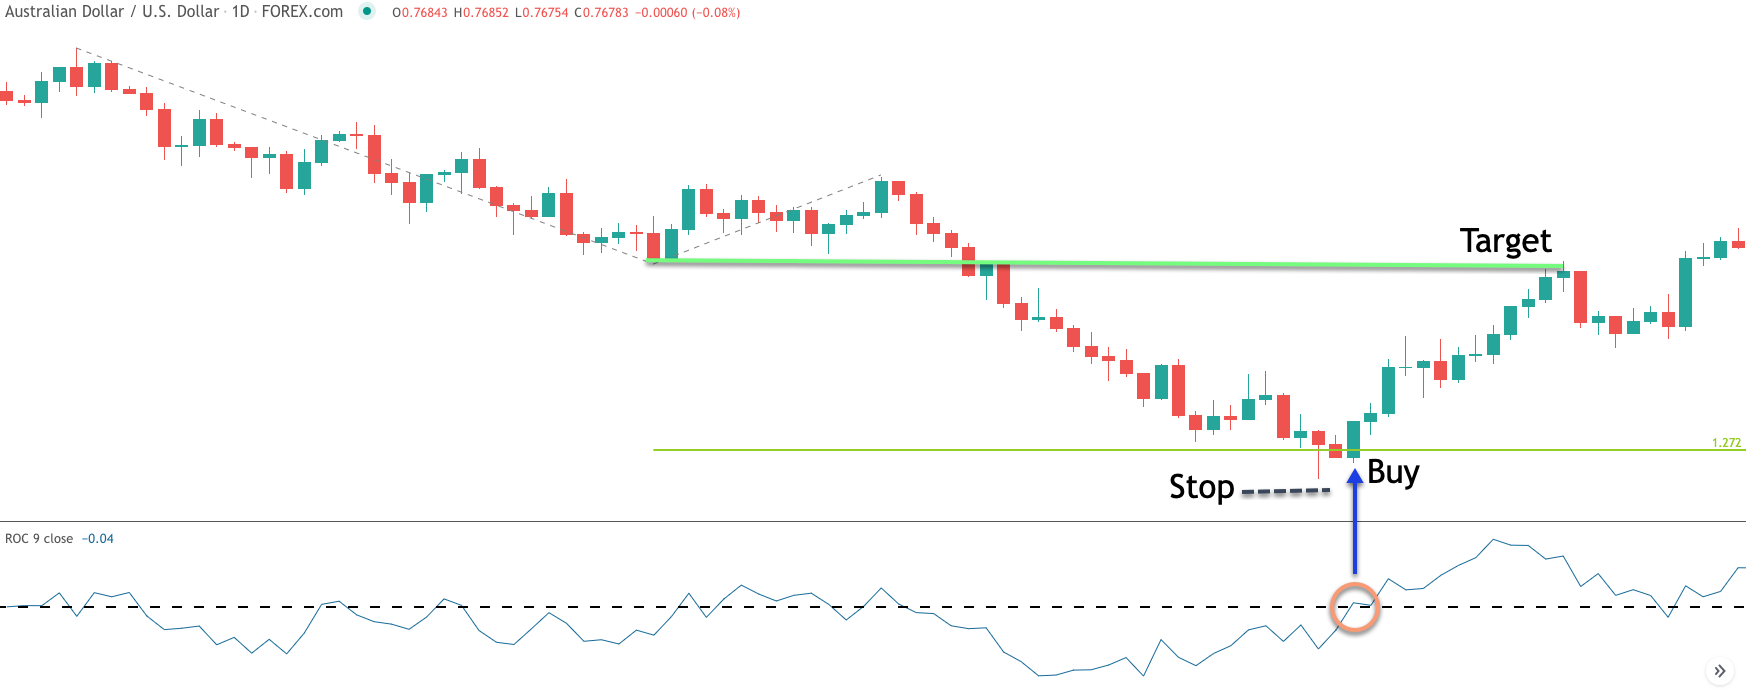
Starting at the far left of the price chart, we can see that a swing high has occurred within the price action. Soon afterwards, the price begins to move lower in what appears to be two clear impulsive price legs down, interrupted by a corrective price leg upward.
As the price is progressing within the second leg down, we would be put on alert that a possible reversal could occur as the price draws near the 1.27 Fibonacci projection level. As such, we would plot the 127% fib level as shown by the gray dotted lines. Again, this would include selecting the swing high, followed by the swing low, and then finally selecting the termination of the correction at the lower swing high.
Once we have selected these points, the Fib projection tool would plot the 127% level as shown by the lower green line on the price chart. As price progressed lower within the second leg, it ultimately interacted with this important projection level, forming what appears to be a hammer candle upon its first interaction. At the same time, we can see that the ROC indicator was below the zero line.
We would not have to wait long before the ROC indicator crossed to the upside. When it did it would have been the signal to initiate our buy order. The stop loss would be placed below the low of the hammer candle as shown by the black dashed line below the entry.
The target is shown by the upper green line above the buy entry, and is drawn from the swing low that represents the second point within our Fib expansion selection. As is clearly evident from the price action, as soon as our buy order was initiated, prices reversed to the upside. Shortly afterwards, our target level was reached, allowing us to exit the trade with a profit.
Summary
The Fibonacci expansion indicator is an important technical study that can provide us clues into hidden support and resistance levels. Generally, Fib expansions are used to project price movements of waves moving in the same direction. Unlike Fibonacci retracements which measure internal price moves, Fibonacci price projections measure external price moves.
As with any Fibonacci study, the more levels that align in close proximity to one another, the more significant that specific level is likely to be. As such, Fibonacci traders should keep a close eye on Fibonacci clusters and areas of confluence.