The Zig-zag indicator is probably one of the most under-rated tools used in technical analysis. Unlike other trading indicators, the zig-zag indicator often sits in the background, and is mostly used to as a secondary tool by many traders.
But there are several great ways to utilize the zig-zag tool. It can be used as a tool to detect swing points, as well as assist in counting Elliott Waves, and in finding support and resistance levels. Traders can come up other techniques that they can use to incorporate a zigzag indicator strategy based on their own trading style.
The zigzag indicator works on various chart types. For example, a zig zag tool can plot the highs and lows when used on a candlestick chart or a bar chart. On the other hand, when using a line chart which use closing prices, the zig zag indicator plots based on the close.
In some cases, the way the zig zag indicator behaves, will depend on the charting platform being used. Most commonly the metatrader zigzag indicator will make use of just high and low prices, regardless of the chart type being used.
What the zig zag indicator does is, basically filter out the price movements based on the settings. Therefore, the indicator plots the trends in the markets, while ignoring minor price retracements.
In the chart below, Figure 1 shows a forex zig zag indicator. The name is derived from the way the indicator plots the zig zag lines as it follows the swing high and low points in price.
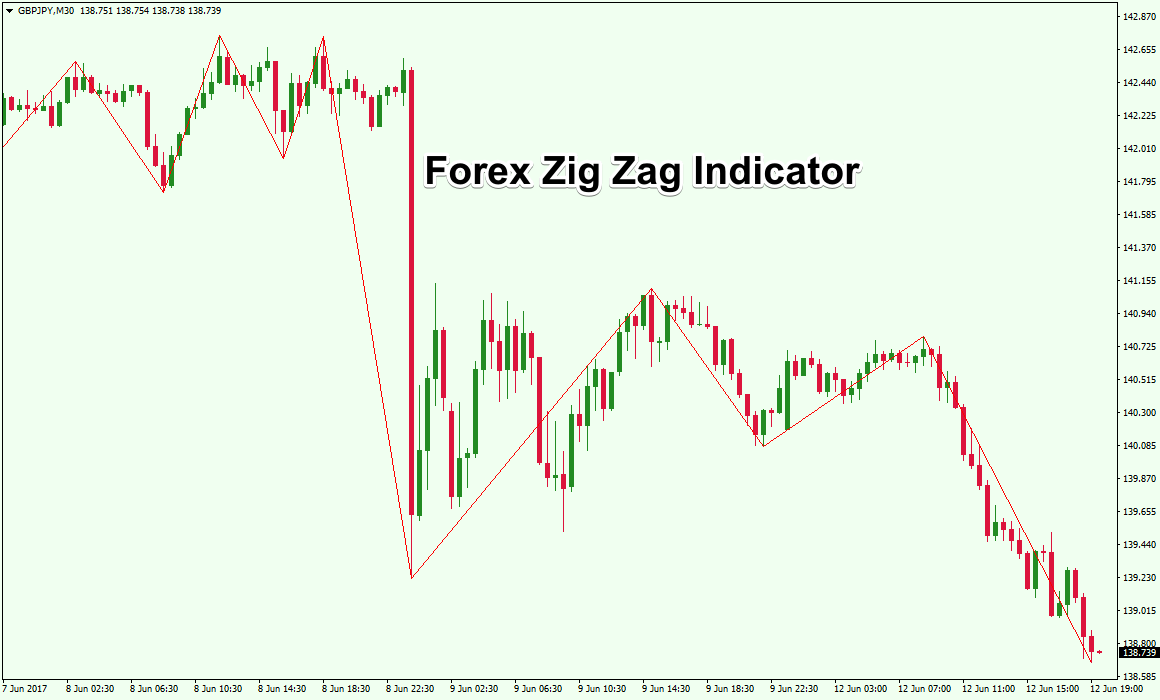
Figure 1: Forex Zig Zag Indicator
The zigzag indicator is quite versatile and in this article, you will learn how to use the zigzag indicator in forex trading.
You will learn how to make use of the zigzag drawing tool and tweak the settings. In addition, we will explore some examples of how you can use the zig zag indicator in building various trading strategies.
How to set the forex zigzag indicator parameters?
The zigzag indicator is rather simple in terms of the settings.
There are just three variables to use or rather three settings. Despite just three settings, the zigzag indicator can be tweaked to fit different market conditions.
Figure 2 below shows the zigzag indicator parameters. These settings reflect the zigzag indicator for the MT4 platform. Depending on the charting platform that you use, you may find different default settings.
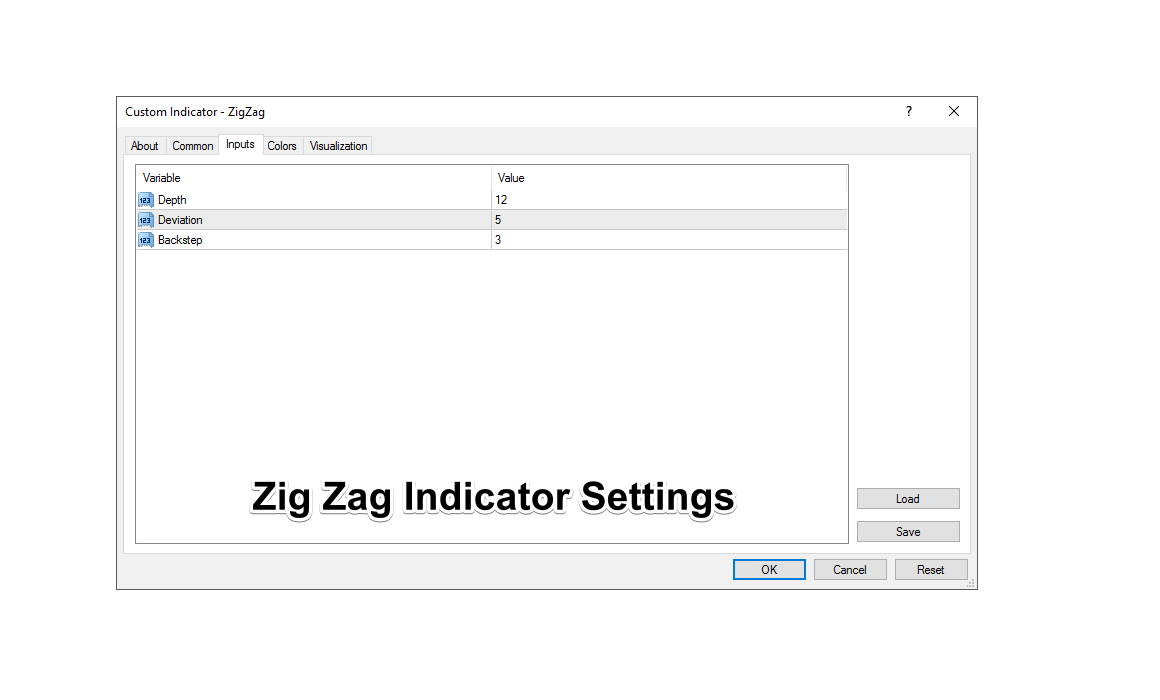 Depth is the first setting in the zig zag indicator. This is the minimum number of bars where there isn’t any second maximum or minimum deviation from the bar.
Deviation in the second setting is the number of pips or points (depending on the market) after the previous minimum or maximum is formed.
Backstep is the last setting and reflects the minimum amount of bars between which the high and low can be plotted.
With all these three settings coming together, the zig zag indicator can now be plotted.
Understanding how the settings for the zig-zag indicator work is important as it brings context to the manner in which the zig zag indicator plots the values and detects the swing high and low points.
Let’ take a look at figure 3 below to understand how the indicator’s parameters work together.
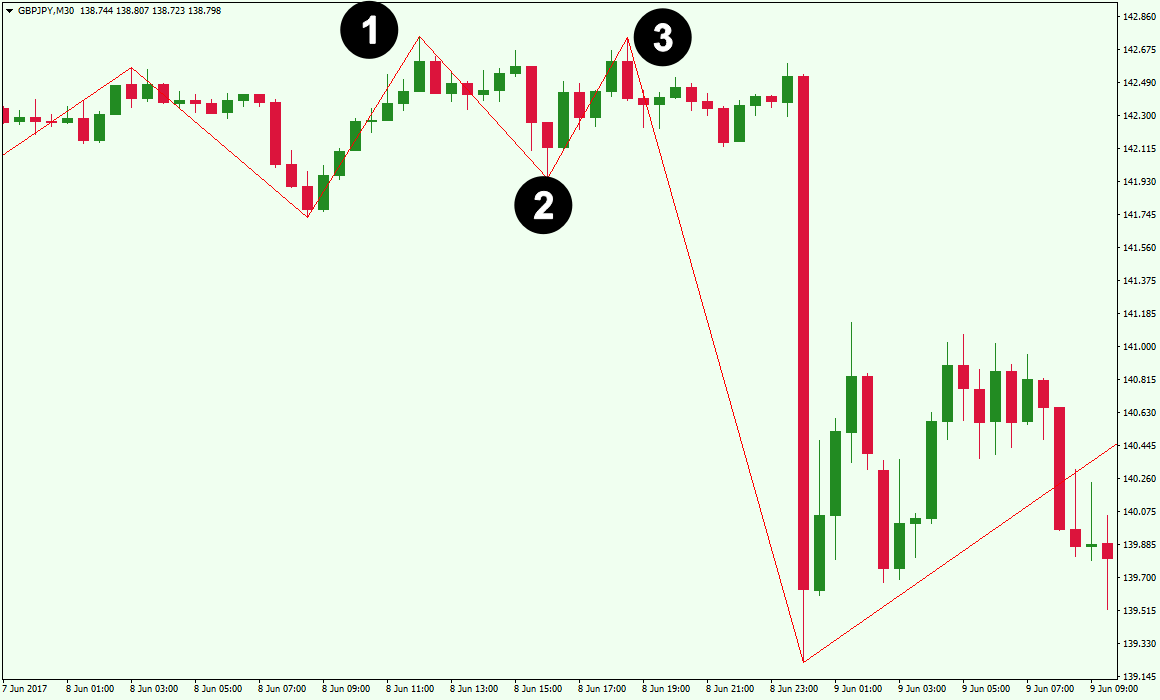
Figure 3: Zig Zag indicator settings
The above zig zag is plotted based on the default settings of 12, 5, and 3. At point one, we have the first major high that was formed. Following that, seven bars later a new low was formed. The reason that this swing low was plotted is because that was the major low point in price for the previous three bars.
At point two, after the low was formed, the next couple of bars continued to post a higher low.
Four bars later another high was formed at point three.
Again, you can notice that both the deviation and the high occurred on the 5th bar (backstep was a minimum of 3).
Now that we understand the mechanics of how the forex zigzag indicator works, let’s turn our attention to applying this to actual trading.
How to use zigzag indicator in forex?
As we have previously pointed out, the zigzag indicator can be used in a number of ways. It can act as a confirmation tool, as well as assist Elliot Wave traders with wave counts. In addition, the Zig Zag indicator can be very useful in recognizing Harmonic patterns; in fact, the zig zag tool is one of the critical elements of the zup indicator, which is a very popular harmonic pattern recognition indicator for Metatrader.
It is important to understand that the zigzag indicator repaints. Therefore, if there is a new low or a high that is formed within the parameters, then you can expect the zigzag indicator to repaint again.
In order to visualize this process, you can simply add the zigzag indicator to any chart in real time and you can see how the indicator will repaint. In hindsight, the zig-zag indicator looks as if it is constant, but in reality, it is a self-adjusting dynamic tool.
Many traders shun using a repainting indicator, because they think this is unreliable. But in reality, a repainting indicator simply adjusts to prices as they unfold. Thus, in a way, the zigzag indicator constantly adjusts to highs or lows, until a new major low or high is formed.
We know that based on Fibonacci analysis, price will typically retrace 38 – 50% of the previous leg. Combining this with the swing levels indicated by the Zig Zag indicator can provide for an overlapping confluent signal.
In addition, when there is a news release, the market can trend very strongly and often shows minor if any retracements. In this case, you could use a more sensitive Zig Zag setting to adjust to the new trending market conditions. It only takes some practice and experience to recognize the behavior of the zig-zag indicator on your price chart.
However, traders should not use the zig zag indicator in isolation. It is always recommended to make use of the zigzag indicator alongside other technical based analysis so there is some overlapping confirmation to the signals.
For example, using the zigzag indicator with a longer term moving average can be viewed as a zigzag indicator strategy where the longer term moving average can confirm whether it is a bullish or a bearish market. Then the zigzag indicator could be used to provide entry signals in the direction of the longer-term trend. Therefore, in an uptrend as defined by the longer term moving average, you can look for a zig-zag low to form, wait for price to retrace from the low to confirm that the bottom is formed and then buy into the market. We will be illustrating a similar strategy in a chart example a bit later on.
Zig Zag Indicator Settings and Variations
One of the commonly asked questions is whether there is a best zigzag indicator setting. While there are many theories that float around, the fact of the matter is that the ideal zigzag indicator settings can vary from one market to another.
For example, the same settings used in a currency market may or may not work for stocks. Besides the asset or instrument in question, there is also the factor of volatility. Sometimes, volatility can play a big role and can even make the current settings unusable.
Therefore, for an indicator such as the zigzag (and in most cases with repainting indicators) it is a priority that traders keep a constant watch on the settings and adjust them accordingly based on the market conditions.
You might end up using different settings for one asset or instrument versus another, or you could also end up changing the settings for the same market or indicator when the market conditions or volatility change.
Besides the standard zigzag indicator that is commonly available, you can also find a variation of this tool.
In this case, the zigzag indicator plots the high and low when there is a percentage move in price. The main difference though is that perfect highs or lows are not captured but only percentage moves.
This percentage based Zig Zag indicator is not available on most forex charting platforms such as the mt4 as this approach is more commonly used in stocks. Percentage moves are quite common to the stock markets and one can build customized trading strategies around this.
A 10% setting for example, will ensure that the zig-zag indicator will wait for a minimum 10% move in the market (to the upside or downside) to plot a major high or low.
As with the conventional Zig Zag indicator, this customized zigzag indicator also plots the highs and lows and can therefore visually depict price retracements in the market. A unique feature of this though is the fact that the customized zigzag indicator can either use price high and low (when using the candlestick or bar chart) or it can use the line chart where only closing prices are used.
What trading strategies can you use with the zigzag indicator?
There are many ways one can employ the zigzag indicator. For starters, a popular method for using the zigzag indicator is in identifying chart patterns.
Classical chart patterns such as the head and shoulders pattern, triangles, rising and falling wedges can be easily identified using the Zig Zag tool. Such an approach is ideal for use in price action based trading strategies.
In figure 4, we have an example where the zig-zag indicator has plotted a head and shoulders pattern.
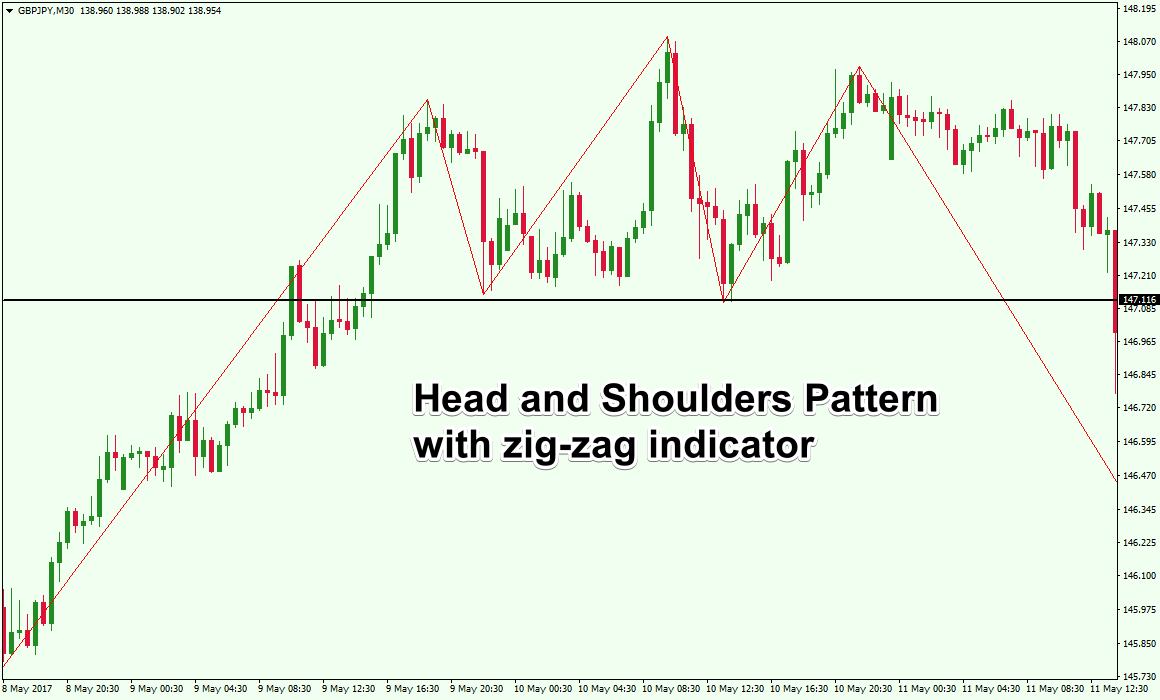
Figure 4: Zig Zag indicator – Head and shoulders pattern
In the above example, we can see a very clear Head and Shoulders pattern on the price chart. Typically, trading such patterns can be quite subjective. But with the help of the zigzag indicator it becomes quite clear how the H&S pattern has evolved. You can also see the break of the head and shoulders neckline support with the strong bearish candle.
Another way to use the zig zag indicator is by combining it with other technical indicators. In figure 5, we make use of a 20 and 50 period moving average crossover along with the zigzag indicator.
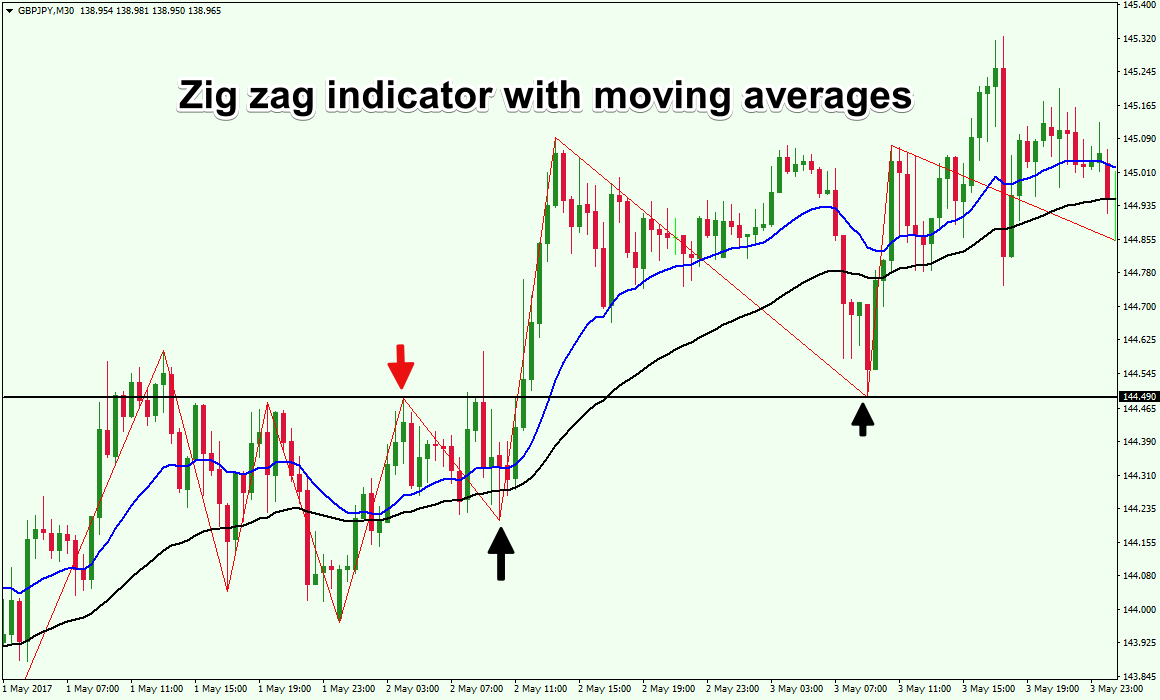
Figure 5: Zig Zag indicator with technical indicators (moving average)
In the above example, we can see the zig-zag indicator at work. The moving averages are already aligned to show the bullish trend in the market. The question then becomes “Where can we find opportune times to buy at retracement bottoms in this uptrend”?
We can get clarity by using the zig zag indicator. The first red arrow shows a swing high being formed near a recent resistance area, followed by a low marked by the first black arrow. Following this price action, we see price breakout of the horizontal resistance and then begins retracing back. You can see that the next Zig Zag low coincides almost or close to the previous high (where prior resistance is being tested as support).
A long position, in the above example can be taken after the low is plotted. You can also look to candlestick patterns and general price action as additional confirmation for taking a long position.
After the second black arrow (where a higher low is formed), we can see that price has reacted off of the support level and moved sharply higher.
Taking a long position in the market with stops placed at the recent swing low is one approach with the first target set to the previous recent high that was formed.
This zigzag trading system is quite simple and can be enhanced quite a bit with further testing. But the point is that combining it with other technical based approaches can help bring more clarity to your analysis and increase the probability of your trade setup.
Basic zigzag chart analysis
Analyzing the markets with the zig zag indicator can be done in multiple ways. As we have touched on earlier, the Zig Zag indicator is useful in identifying swing high and lows in the market. Using this tool, traders will note that once a low or a high is formed, and subsequent highs and lows are formed, the previous price levels do not repaint.
Therefore, traders can use this information and look at the most recent highs and lows and plot various support and resistance levels. Sometimes, you can also find clusters of highs and lows, which are usually more important levels in the markets being analyzed.
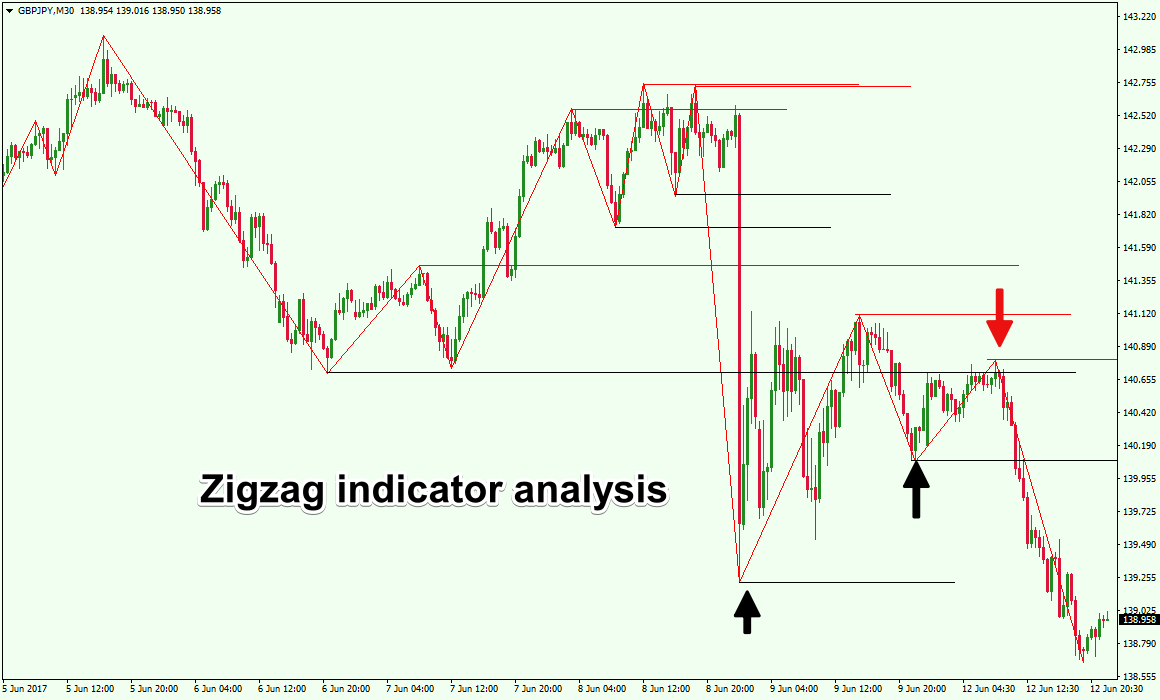
Figure 6: Zig Zag indicator analysis
In the above chart, the market analysis was done by plotting the previous high and low levels.
If you notice the period marked with the red arrow shows a confluence of the previous support (black line) and the resistance level (red line). This price action behavior suggests that a high and low was formed indicating a strong resistance level. Price eventually dips lower and breaches past the previous low.
Conclusion
So how can a trader start taking advantage of the Zig Zag indicator? The simplest answer is that a trader should at least start using the zig zag indicator to help plot Support and Resistance levels on their price chart.
The Zig Zag indicator as we have demonstrated can be used in recognizing Classical Chart patterns, and with a Moving Average based trading strategy.
Additionally, the zigzag indicator is commonly used with harmonic trading. Due to the fact that harmonic trading measures price extensions and retracements, the zigzag indicator makes it easy to identify these price levels.
The zigzag indicator can also be used to count Elliott waves. However, in most cases, some kind of adjustment needs to be made for the indicator parameters as counting of Elliott waves can be subjective under some circumstances.
In conclusion, traders should test the zig-zag indicator with their own technical analysis approach. Different traders have different trading styles, therefore while some might find the zig-zag indicator to be a great supporting trading tool, others may not find it as useful to them. By spending some time testing this tool, you will better know how it may fit within your trading program.