Today we will be covering a more advanced form of technical analysis, referred to as the Elliott Wave Theory. Many traders have heard of the Elliott Wave theory, but some find it a bit overwhelming and complicated. The Elliott Wave concept does have a steeper learning curve than other types of analysis, however, I have found that it is one of the best forecasting tools available to the forex trader. We will dive into the details of this theory and understand how to effectively trade using this technique.
Understanding Price Action
Before we move into the mechanics of the Elliott Wave Theory, we need to review some basics around price action. On every Forex chart there are three basic types of price action phases. These are:
Impulse Wave (Trending Move)
This is the move in the direction of the trend. Usually, trending moves are bigger in terms of price change and take less time. This makes the trending move very attractive to trade.
Moves in the direction of the overall trend are referred to as Impulse Waves.
Corrective Wave (Correction)
The corrective move involves price behavior that is contrary to the impulse move. Corrective moves are smaller in terms of price change and usually they take more time to develop. This is why they are not as attractive to trade as the impulse moves.
If the trend is bullish, then the correction of the trend would be in bearish direction. If the trend is bearish, then its respective correction would be bullish.
Price Consolidation
This is the price phase when there isn’t any visible trend. In most of the cases consolidations are related with ranging or sideways price moves. However, sometimes corrections could take different forms which illustrate specific chart patterns. These patterns can sometimes help us forecast future price developments.
Elliott Wave Principle
In the early 20th century, an accountant named Ralph Elliott discovered a very important pattern in the markets. He discovered that when the price is trending it creates five legs. Three of these are impulse waves that move in the direction of the trend and the other two are corrective moves which move counter to the trending move. He further found that when this trend phase gets exhausted, the price action shifts to a corrective phase, which could be tracked in three moves. So, he concluded that there would be 5 moves that make up the trending phase, and 3 moves that make up the corrective phase. This is known as the 5-3 Elliott Wave count.
Below you will see a sketch of the 5 moves comprising the trend.
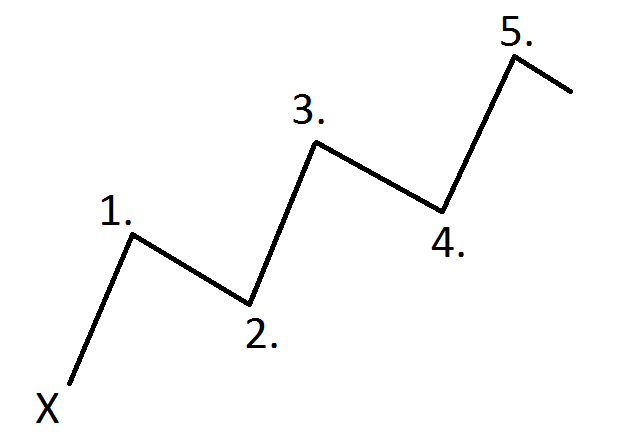 Ralph Elliott attributed this basic structure in the markets to the behavior of the trading masses. He outlined the importance of the psychological factors that make up this Elliott Wave 5-3 structure.
Let’s now discuss the corrective move which comes after the trend.
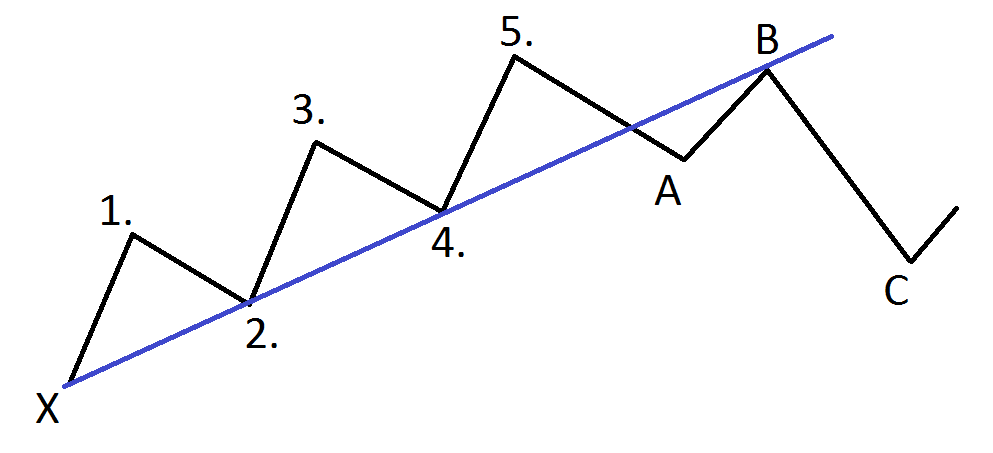
As you see, this is the same image with the five trending moves. However, this time we have sketched the potential correction, which appears after the trend. Notice that move (A) breaks the trend and typically sets a bottom outside the scope of the trend. Move (B) then brings the price back to the area of the trend for a resistance test. Move (C) then forces the price in the direction contrary to the trend. This is the Elliott Wave 5-3 sequence.
What is important to keep in mind is that the 5-3 Elliott Wave principle is deeply rooted in mass psychology and this repeatable formation is caused by dynamic changes in the attitudes of the buyers and sellers. The first 5 moves represent the balance of power to the buyers in the case of the bullish market, while the (A), (B), and (C) moves represent the balance of power to the sellers in that market.
Elliott Wave Rules and Guidelines
Though many traders complain that Elliott Wave analysis is too esoteric and difficult to understand with all it rules, the fact is that within the Elliott Wave principle there are only three main unbreakable rules.
- Rule 1: Wave 2 cannot retrace more than 100% of Wave 1.
- Rule 2: Wave 3 can never be the shortest of the three impulse waves.
- Rule 3: Wave 4 can never overlap Wave 1.
Now along with these rules there are some important guidelines as well:
The Guideline of Equality says that two impulse waves within a five wave sequence will tend toward equality, and most times this means that when Wave 3 is the extended wave, Wave 1 and Wave 5 will be approximately equal in size.
The Guideline of Alternation states that Wave 2 and Wave 4 will alternate.
So when Wave 2 is a sharp correction, then we can expect Wave 4 will be a congestive style correction. And vice versa.
Also it should be noted that in most cases Wave 2 tends to be Sharp and Wave 4 tends to be congestive.
The Guideline of Corrective Wave Depth – The corrective A, B, C sequence with typically retrace within the territory of the previous Wave 4.
The Guideline for Channeling – The use of Elliot Wave parallel trend lines helps to project the potential support and resistance and end points of impulse waves.
Firstly, when wave 3 is complete, you could connect the extremes of Wave 1 and 3, then draw a parallel line to the extreme of Wave 2 to find the possible termination of Wave 4.
After Wave 2 and 4 are complete, you would extend a parallel line connecting the extreme of wave 2 and wave 4 to find the end of Wave 5.
Fibonacci Ratios in Elliott Wave Patterns
The application of Fibonacci ratios are an integral part of Elliot Wave analysis. The Fibonacci sequence is based on nature’s influence, which extends to the financial markets.
When price moves to certain percentages, traders tend to have natural inclinations that are played out in the markets.
Some of the most important Fibonacci levels include the following:
00.0%, 23.6%, 38.2%, 50.0%, 61.8%, 100.0%, 161.8%, and 261.8%.
Here are the common relationships that the waves within the Elliot Wave sequence have to Fibonacci levels.
It is important to try commit these to memory, so that you know how price action is most likely play out.
Wave 2 – 50.0%, or 61.8% of Wave 1.
Wave 3 – 161.8%, 261.8% of Wave 1
Wave 4 – 38.2%, 50.0%. 61.8 of Wave 3
Wave 5 – 100% of Wave 1 or 161.8% of Wave 4.
Wave A – 161.8%, 100%, 61.8%, or 50.0% of Wave 5.
Wave B – 50.0%, 61.8 of Wave A.
Wave C – 100% or 161.8% of Wave A, or 161% of Wave B.
The image below will show you the Fibonacci relationships that confirm Elliott Wave patterns on the chart.
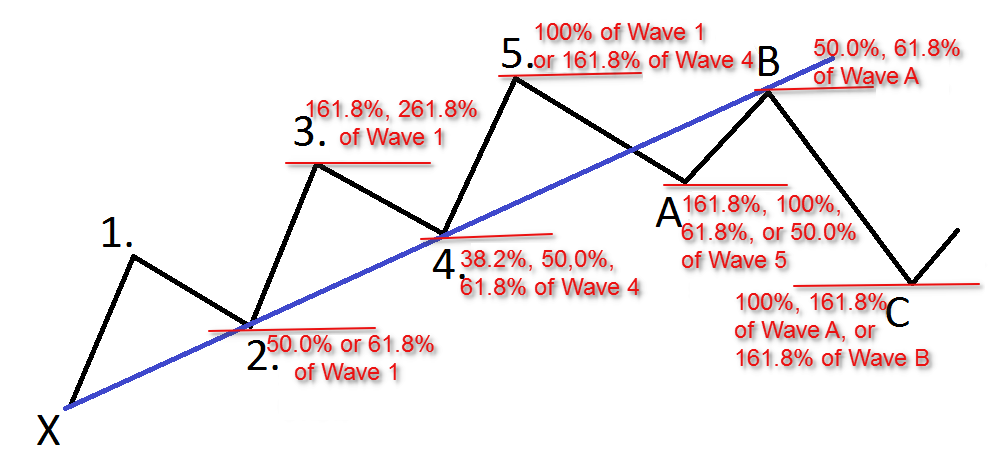
Combining The Elliott Wave structure with Fibonacci relationships gives information about high probability turning points and where the next price move will likely terminate.
Therefore, counting waves and applying the appropriate Fibonacci levels is essential for every Elliott Wave trader. Once you are comfortable combining the predicative power of Elliott Wave and Fibonacci, you will gain confidence in your trading by leaps and bounds.
Elliott Wave Indicator Set
I will now show you a couple of indicators which can assist with Elliott Wave trading. Although they are not directly related to Elliott Waves, they can facilitate the wave identification process.
Zig Zag Indicator – This is an indicator, which isolates smaller price swings. The indicator consists of straight lines, which go from crucial tops to crucial bottoms. This helps us to have a clearer picture regarding the important price moves.
Fibonacci Retracement – This indicator will plot the Fibonacci ratio levels. You simply stretch the indicator between a low and a high point on the chart and it automatically gives you the retracement levels.
If you combine these two tools, you will begin to simplify your Elliott Wave analysis.
Trading with Elliott Wave
Since you are now familiar with the Elliott Wave chart and the two indicators that can assist you in your analysis, we will now shift our focus to a few examples to illustrate the identification of an Elliott Wave Sequence The image below is a completed 5-3 Sequence:
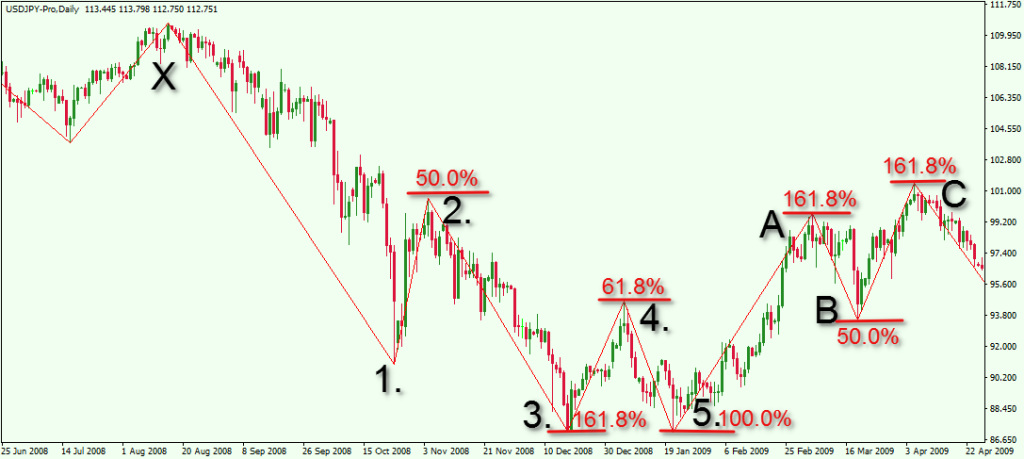 This is the Daily chart of the USD/JPY Forex pair for Jun 2008 – Apr 2009. On the chart you see the Zig Zag indicator – the thin red lines. The thicker red lines indicate the Fibonacci levels, which are measured by the Fibonacci Retracement indicator.
- We start with the first wave, which is a big bearish impulse move. This is Wave 1 and sets the base for our Elliott Wave count.
- The second wave retraces 50.0% of Wave 1
- The third wave extends 161.8% of Wave 2. ( Typically, however, it will extend 161.8 of Wave 1 )
- The fourth wave reaches 61.8% of Wave 3.
- The fifth move measures 100.0% of the fourth move.
- Then comes the corrective move. Wave (A) of the correction reaches 161.8% of the size of Wave 5.
- Wave (B) is bearish and it retraces 50.0% of Wave (A).
- Wave (C) is bullish and it pushes the price increase which equals 161.8% of move (B).
As you see, the 5-3 Elliott wave responds accordingly to Fibonacci relationships in a very harmonic manner.
The Best Elliott Waves to Trade
The most powerful wave within the Elliott Wave Sequence is Wave 3. This is considered the most attractive wave to trade. In order to identify this wave, we first need a Wave 1 in the direction of a new developing trend followed by a corrective wave, Wave 2, which covers 38.2%, 50.0%, or 61.8% of Wave 1. When we identify these two waves, then we can try to anticipate the beginning of Wave 3. Many times at the beginning of Wave 3 we will also see a Harmonic pattern, usually a Gartley or Bat formation.
Wave 5 also provides a good trading opportunity. Wave 5, will reach anywhere between 50.0% and 161.8% of Wave 4, and many times is equal in size to Wave 1.
These are the two impulse Elliott Waves that can be traded. These two waves are formed during the trend phase. We should not forget that the general trending move also creates two corrections. However, corrections are considered harder to trade and provide smaller profit opportunities.
After the completion of the trend phase ending with Wave 5, we can anticipate the three (A), (B), and (C) waves of the general correction, within the corrective phase, Wave C provides the highest probability trade setup. Wave C is the most powerful wave within the corrective phase and has many similarities to Impulse Wave 3. You would typically want to wait for a 50-61% retracement of Wave A and then look to enter into the emerging Wave C move.
Elliott Wave Trading Strategy
I will now show you a trading strategy, where we will attempt to ride some of the waves within the Elliott Sequence. We will also include a standard 20-period Simple Weighted Moving Average, which will help us open and close trades after the price bounces from a Fibonacci level.
In order to open a trade, we will need the price to bounce from a specific Elliott Wave Fibonacci level and then cross the Moving Average in the direction of the move we expect. At the same time, we will stay in each trade as long as the price closes candles above the Moving Average.
The image below will show you how this strategy works.
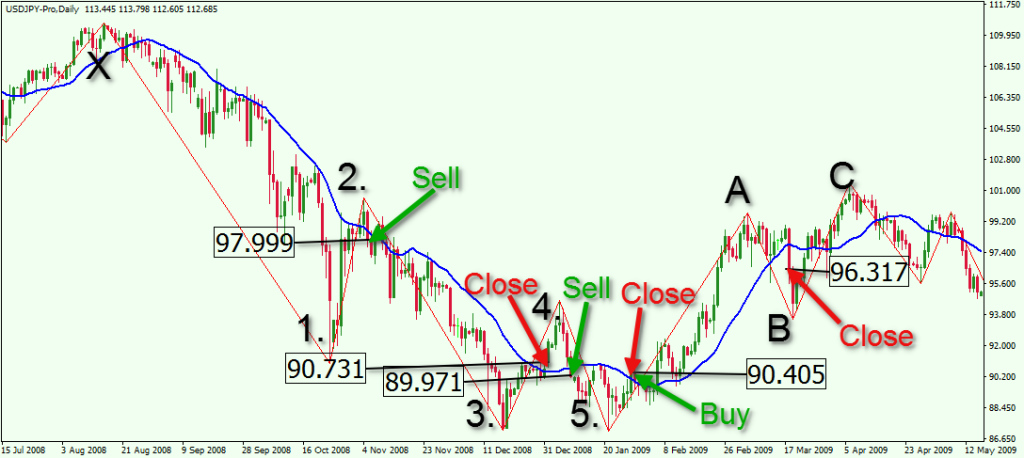
This is the same daily chart of the USD/JPY Forex pair. This time you also see on the chart a 20-period Simple Moving Average. Let’s now simulate three trades.
In Wave 2 the price retraces 50.0% of Wave 1. The price then bounces, closing a candle below the 20-period SMA. A short signal is generated at 97.999. The USD/JPY price then starts a sharp decline during Wave 3, which we expect, typically, to be the strongest momentum move.
About 45 days later Wave 3 reaches a 161.8% extension of Wave 2. This is when one should carefully keep an eye on the price action for an eventual break in the 20-period SMA. 15 days later, the USD/JPY breaks the 20-period SMA, which generates a closing signal.
During the exit signal, the price is in the middle of Wave 4, which is a corrective move. The price increase continues to the 61.8% Fibonacci level and then bounces downwards. The 20-period SMA gets broken downwards generating another sell signal at 89.971 during Wave 5. Unfortunately, Move 5 covers only 100.0% of Move 4, which is insufficient for a successful trading position.
A buy signal comes at 90.405, when the price broke the 20-period Simple Moving Average in the bullish direction. The USD/JPY price then starts a relatively sharp increase, which reaches the 161.8% Fibonacci extension of Wave 5. This is when a trader should be looking to close a trade. The price starts a slight consolidation. About 50 days after the buy signal was generated a profitable exit signal was created at 96.317.
There are many different techniques a trader could implement using Elliott waves. In the above example, we demonstrated the use of Elliott Waves patterns combined with Fibonacci Retracement, Zig Zag Indicator and 20-period Simple Moving Average.
My personal preference for trading Elliott Waves is to trade it using a combination of Elliott Wave counts and Fibonacci levels exclusively. I find that using another technical indicator like the moving average provides for later entries and less profit potential. Newer traders may be more comfortable using the Simple Moving Average or similar to help confirm their Elliott Wave analysis.
Also, you should always use a Stop Loss order when you trade Elliott Waves. The proper location of your stop would be beyond the swing top (or bottom) which marks the beginning of the wave you trade. Finally, If you are serious about trading Elliot Waves, there are numerous Elliott Wave software available to help you with your Wave counts.
Conclusion
- Elliott Wave theory provides a framework for understanding market structure and price action
- The Elliott Wave principle suggests that price action reflects the psychology of the market players.
- The Elliott Wave principle identifies two basic phases of price movements:
- The Trend – which consists of 5 waves.
- 3 Impulse waves (Trending Moves) – Wave 1, Wave 3, Wave 5
- 2 Corrective waves (Corrections) – Wave 2, Wave 4
- The Correction – which consists of 3 moves.
- 2 waves in the Direction of the Correction – (A), (C)
- 1 wave against the Correction – (B)
- The Trend – which consists of 5 waves.
- Fibonacci Ratio Levels are crucial for projecting Elliott Waves. The most important Fibonacci levels are:
- 38.2%
50.0%
61.8%
100.0%
161.8% (extension)
261.8% (extension)
- 38.2%
- Two useful tools to identify Elliott Waves are:
- Zig Zag Indicator: This trading instrument outlines the general price moves and identifies important swing points
- Fibonacci Retracement: This is an indicator which displays the exact retracement levels of a previous trend.
- The best Elliott Wave trading opportunities include
- The Beginning of Wave 3
- The Beginning of Wave 5
- The End of Wave 5
- The Beginning of Wave C
- One method to trade Elliott Waves is to include a Simple Moving Average to your chart. When the price confirms a wave and conforms to a specific Fibonacci level, open a trade if the price breaks the SMA. Hold the trade until the price breaks the SMA in the opposite direction. Eventually, however, as you get more familiar with the wave principle, you should rely mainly on the Wave counts and Fibonacci relationships, without any requirement for additional indicators.