I bet you have traded some chart patterns during your trading career. Double Tops, Double Bottoms, Head and Shoulders – we all know these. Therefore, today we are going to take our knowledge of chart patterns to the next level. I will introduce you to Harmonic Patterns, which are a little more advanced as far as trading patterns go. Although they are harder to spot, it is certainly worth watching out for them, since these patterns can lead to highly profitable trading opportunities when analyzed properly. So in this article, I will be teaching you how to implement harmonic pattern trading.
Harmonic Patterns in Forex
Harmonic chart patterns are considered harmonic because these structures have an integral relationship with the Fibonacci number series. Identified harmonic patterns conform to crucial Fibonacci levels. As you may already know, Fibonacci numbers can be seen all around us in the natural world, and these harmonic ratios are also present within the financial markets.
Harmonic trading in the currency market includes the identification and the analysis of a handful of chart figures. In most of the cases these patterns consist of four price moves, all of them conforming to specific Fibonacci levels. Therefore, a harmonic chart pattern should always be analyzed using Fibonacci Retracement and Extensions tools.
For the more inclined, there are also several harmonic indicators and software programs that will automatically detect various harmonic trading patterns. The most widely traded harmonic patterns include the Gartley pattern, Bat Pattern, Butterfly Pattern, Cypher pattern, and the Crab pattern.
Gartley Harmonic Chart Pattern
The Gartley pattern was introduced by H.M Gartley in his book, Profits in the Stock Market, The Gartley pattern is sometimes referred to as Gartley 222, and because 222 is the exact page in the book where the Gartley pattern is revealed.
So the Gartley pattern is the oldest recognized harmonic pattern and all the other harmonic patterns are a modification of the Gartley pattern. Let’s now take a look at the legs within the Gartley formation:
XA: This could be any move on the chart and there are no specific requirements for this move in order to be part of a harmonic pattern.
AB: This move is opposite to the XA move and it should be about 61.8% of the XA move.
BC: This price move should be opposite to the AB move and it should be 38.2% or 88.6% of the AB move.
CD: The last price move is opposite to BC and it should be 127.2% (extension) of BC move if BC is 38.2% of AB. If BC is 88.6% of AB, then CD should be 161.8% (extension) of BC.
AD: The overall price move between A and D should be 78.6% of XA
The image below illustrates a Bullish and Bearish Gartley pattern:
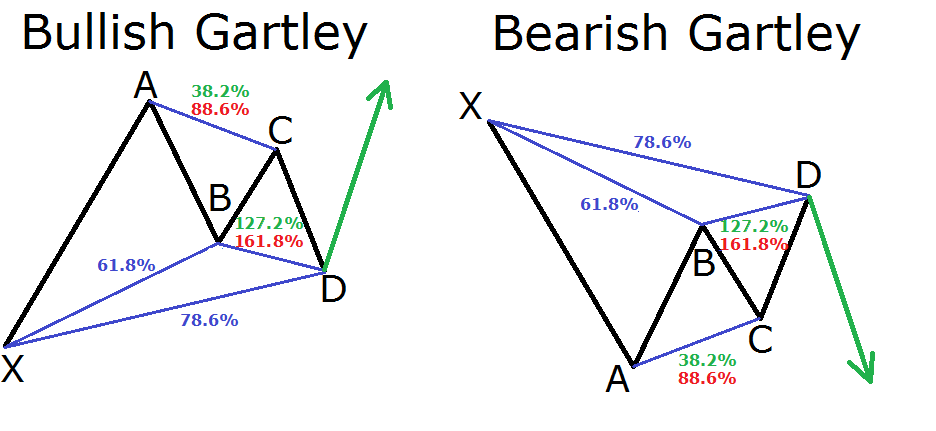
The black lines on the image above show the four price moves of the chart patterns. The blue lines and the percentage values show the retracement relation between each of these levels. The green arrows show the potential price move of the pattern.
Bat Harmonic Chart Pattern
The Bat harmonic pattern is a modification of the Gartley pattern, and was discovered by Scott Carney. The lines are a bit more symmetric and the pattern’s most important ratio is the 88.6% Fibonacci retracement:
XA: This could be any move on the chart and there are no specific requirements for this move in order to be part of a harmonic pattern.
AB: This move is opposite to the XA move and it should be about 38.2% or 50.0% of XA.
BC: This move should be opposite to the AB move and it should be 38.2% or 88.6% of the AB move.
CD: The last price move is opposite to BC and it should be 161.8% (extension) of BC move if BC is 38.2% of AB. If BC is 88.6% of AB, then CD should be 261.8% (extension) of BC.
AD: The overall price move between A and D should be 88.6%% of XA
This is how the bullish and the bearish Bat harmonic chart patterns appear:
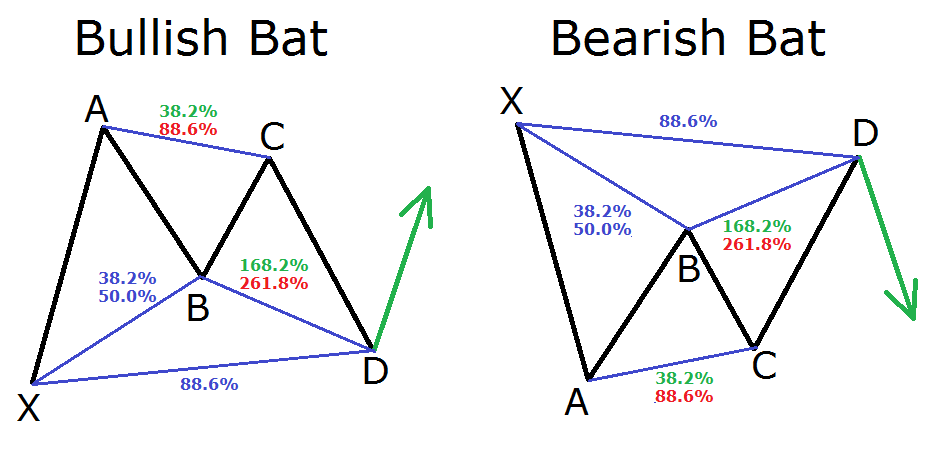
As you see, the Bat harmonic pattern is similar to the Gartley pattern, however, the retracement levels are different. Both are considered internal patterns because the ending D leg is contained within the initial XA move.
Butterfly Harmonic Chart Pattern
This is another modification of the Gartley harmonic pattern, which consists of the same four price moves.
The retracement levels, though, are different, and this is considered and extension pattern as the ending D leg extends outside the initial XA leg
XA: This could be any move on the chart and there are no specific requirements for this move in order to be part of a harmonic pattern.
AB: This move is opposite to the XA move and it should be about 78.6% of XA.
BC: This move should be opposite to the AB move and it should be 38.2% or 88.6% of the AB move.
CD: The last price move is opposite to BC and it should be 161.80% (extension) of BC move if BC is 38.2% of AB. If BC is 88.6% of AB, then CD should be 261.80% (extension) of BC.
AD: The overall price move between A and D should be 127% or 161.80% of XA
This is how the bullish and the bearish Butterfly harmonic chart patterns look:
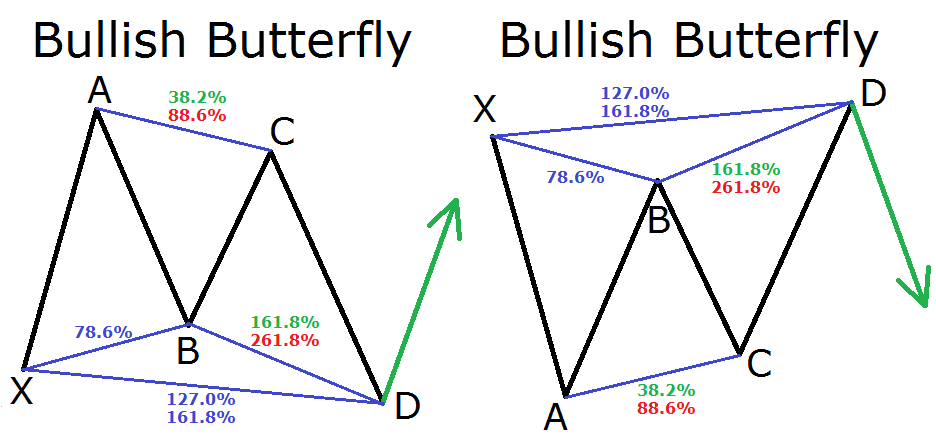 Notice that the Butterfly harmonic chart pattern indicates that the AD move should go beyond the initial price move (XA). In this manner, the Butterfly harmonic pattern is considered an external formation.
Crab Harmonic Chart Pattern
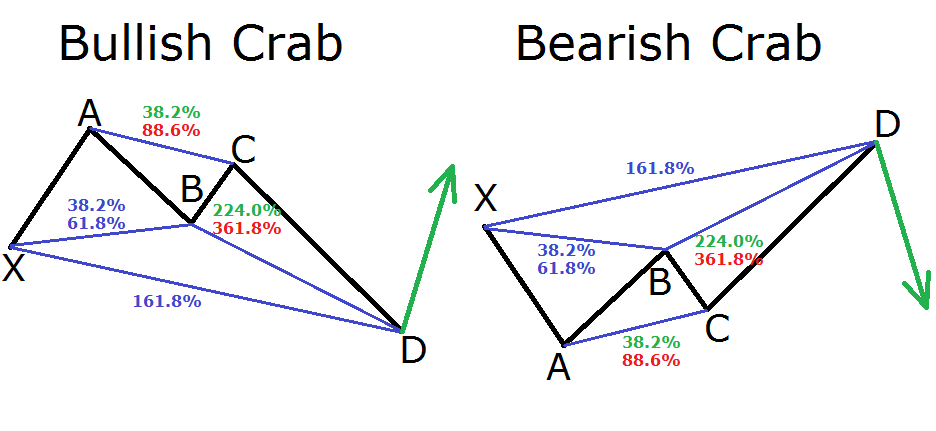
The Crab harmonic pattern has some similarities with the Butterfly chart pattern. The Crab pattern actually looks like a stretched Butterfly sideways.
The Crab also suggests that the last price move goes beyond the initial move, where a Fibonacci extension should be used. The Fibonacci levels used to identify the pattern are described below:
XA: This could be any move on the chart and there are no specific requirements for this move in order to be part of a harmonic pattern.
AB: This move is opposite to the XA move and it should be about 38.2% or 61.8% of XA.
BC: This move should be opposite to the AB move and it should be 38.2% or 88.6% of the AB move.
CD: The last price move is opposite to BC and it should be 224% (extension) of BC move if BC is 38.2% of AB. If BC is 88.6% of AB, then CD should 361.80% (extension) of BC.
AD: The overall price move between A and D should be 161.80% of XA
This is how the Crab harmonic chart pattern looks like:
Cypher Harmonic Chart Pattern
The Cypher chart pattern is similar to the other chart patterns we already discussed, however, it has one specific difference. The BC move of the Cypher chart pattern goes beyond the XA move. This means that we use an extension level on AB in order to measure the BC output. Below you will find the list of the Cypher pattern retracement levels:
XA: This could be any move on the chart and there are no specific requirements for this move in order to be part of a harmonic pattern.
AB: This move is opposite to the XA move and it should be 38.2% or 61.8% of XA.
BC: This move should be opposite to the AB move and it should be anywhere between 113.0% and 141.4% of the AB move.
CD: The last price move is opposite to BC and it should be 78.6% of the general XC move.
See below the structure of the Bullish and Bearish Cypher formation
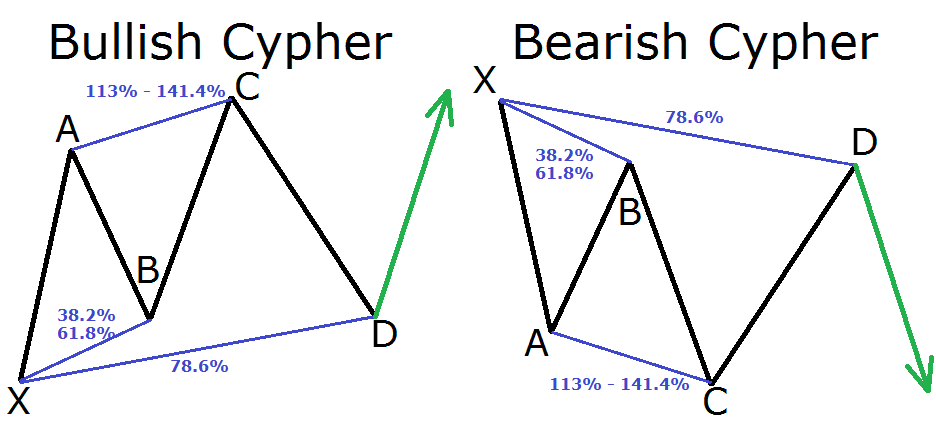
Again, the important consideration of this pattern is that the BC move goes beyond XA and it is an extension of AB. Therefore, we measure CD with a retracement of XC and not on BC. This is so because the general move is XC, which is bigger than the partial BC.
Let’s now identify a couple harmonic trading examples on a chart.
Harmonic Chart Formations Analyzed
The image below will give you an example of an actual harmonic pattern on a candlestick chart:
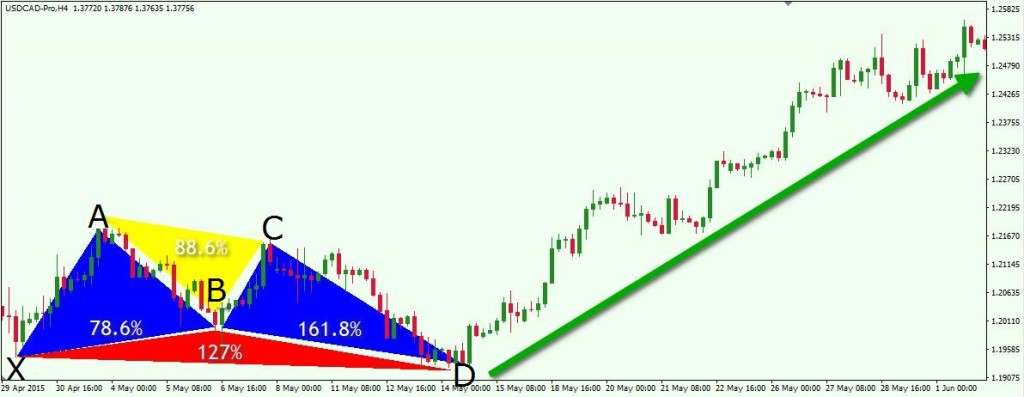
This is the H4 chart of the USD/CAD currency pair for May, 2015. The formation we are looking at is a Butterfly pattern.
We start with a bullish XA move. Then comes a contrary AB move which is 78.6% of the XA move. The next BC move is opposite to AB and it takes 88.6% of AB. CD reaches 161.8% extension of BC and also 127% extension of XA.
These retracement levels confirm the presence of a bullish Butterfly chart pattern. As you see, the USD/CAD price records a significant increase after the confirmation of the pattern.
Let’s look at another one now:
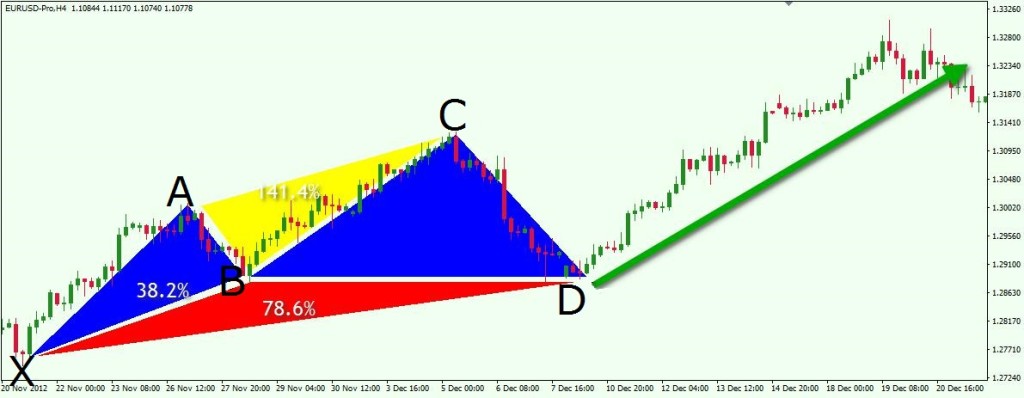
This is the H4 chart of the EUR/USD for Nov – Dec, 2012 showing a bullish Cypher harmonic pattern.
We start with the AB move, which takes about 38.2% of the XA move. Then comes the BC move which approximately reaches the 141.4 extension of the AB move. The last move we identify is the CD move, which is about 78.6% of the big XC move. This is how we identify the bullish Cypher pattern. As you see, after creating point D, the EUR/USD price starts a solid price increase.
Trading Strategy Using Harmonic Chart Patterns
When trading with harmonics it is important to recognize the entry point at Point D, but equally important is to have a sound exit strategy. Let’s take a look at how we can trade harmonic patterns that incorporates simple risk management rules.
Stop Loss Order when Trading Harmonic Patterns
There are several different methods for managing a trade once you have identified a harmonic setup. A simple but effective method to implement would be wait for price confirmation at the D point and place a stop loss just beyond that immediate swing point. Have a look at the image below:
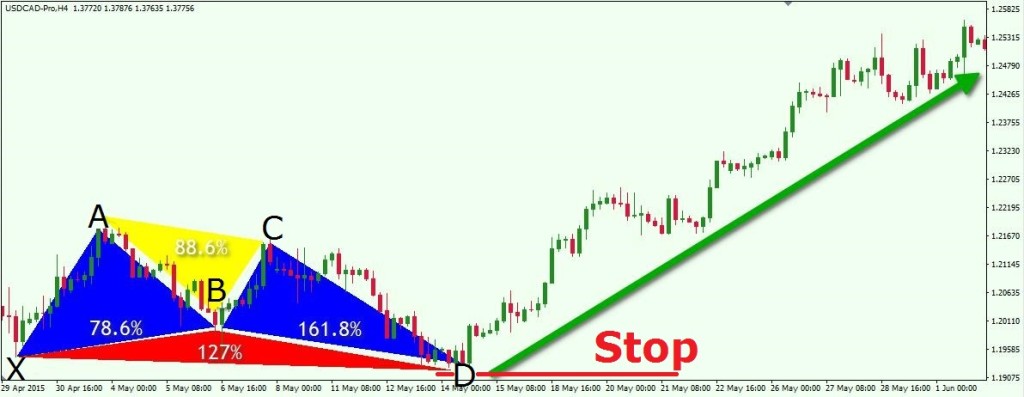
This is the same first example with the bullish Butterfly chart pattern. This time we have indicated the potential place where a Stop Loss order should be placed when trading the pattern. Notice that the Stop is relatively tight in comparison to the following price increase. This provides for a very attractive return to risk ratio when trading the pattern. And this is why harmonic setups are such great chart patterns to trade. There is very little left to judgement because the Fibonacci relationships within harmonic patterns gives us an exact location of the potential turning point. If the price goes beyond that point, the pattern fails and we simply do not enter the market.
Take Profit Zones when Trading Harmonic Patterns
Since we already know when to enter the market and where to place our stop loss, it is time to discuss how long we should stay in the trade. I will now introduce you the potential target levels of a harmonic chart pattern.
As you may have already guessed, the targets of a harmonic pattern should be related to the levels of the pattern itself. Let’s now include these target levels on our bullish Butterfly example:
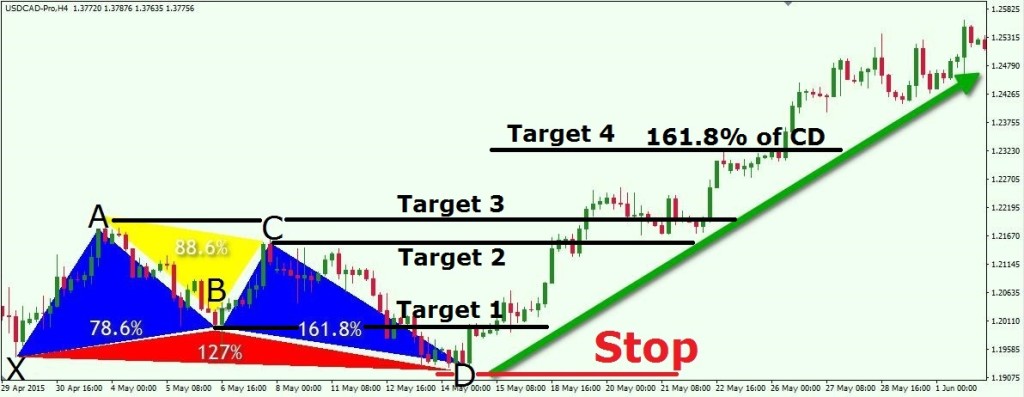
Again, this is the same bullish Butterfly example on the USD/CAD. This time, in addition to the Stop Loss level, we have added four potential targets in front of the price move.
The first target is related to point B on the chart. It is the level, which indicates the price drop during the AB decrease. The second target marks the C point on the chart and the price top after the BC increase. The third target is the high which appears as a result of the XA increase. As you see, these are the three targets which are related with the levels of the Butterfly pattern. However, we have a fourth target as well which price should approach in cases where we complete the previous targets. The fourth target is indicated by the 161.8% extension level of the CD price move.
Notice that the price increase continues beyond the fourth target in this example. Therefore, one could also employ a trailing stop to stay with his long position until the price show signs of weakening. Keep in mind, there is no one standard way of managing your profit targets when trading harmonic patterns, but it is important to maintain consistency in whichever exit methodology that you utilize.
Some traders like to use additional trading tools to confirm harmonic signals. Some of the more popular trading indicators to get exit signals when trading harmonics are Moving Averages, MACD, or Stochastics. In additional, one should always keep an eye out on higher time frame Support and Resistance levels in conjunction with harmonic setups. Also, higher Fibonacci extension levels could be used in order to determine further price targets when trading harmonic chart patterns.
Adjusting the Stop Loss Order when Trading Harmonic Patterns
An important consideration when trading harmonic patterns is the use of a trailing stop to take advantage of larger price moves and protect ones capital as prices begin to move in our intended direction. It is a good idea to modify your Stop Loss based on the price action in order to lock in profits. The image below will show you an example of how to adjust your Stop Loss order according to the price move:
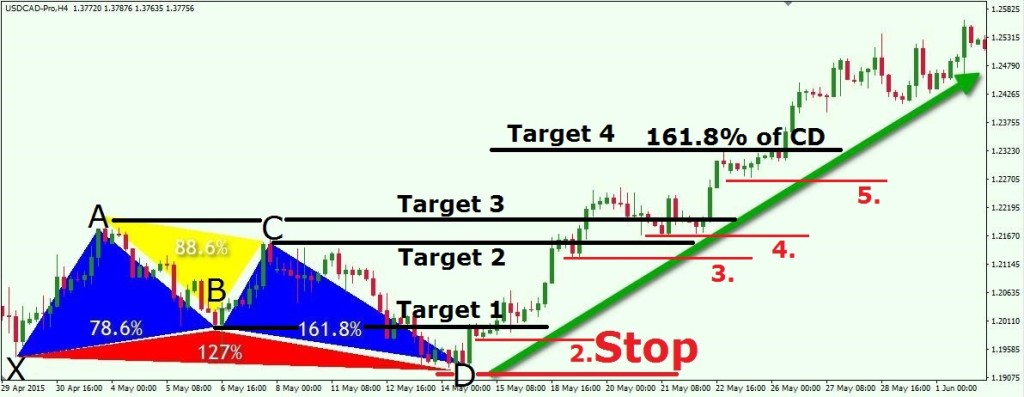
We use the same USD/CAD chart with the bullish Butterfly pattern.
Every time the price completes a target, we adjust the Stop Loss order to be located below the lowest bottom at the time of the target break. On our image above we see that this guarantees us a stay in the market even after the fourth target is completed.
Conclusion
- The harmonic chart patterns are an advanced form of chart pattern analysis based on Fibonacci numbers.
- The basic harmonic patterns consist of four price moves which are contrary to each other. The four legs are named XA, AB, BC, and CD.
- The difference between the harmonic patterns is the Fibonacci levels they retrace or extend to.
- The oldest recognized harmonic pattern is the Gartley pattern. The other harmonic chart figures are Fibonacci modifications of the Gartley pattern. These are:
- Bat Pattern
- Butterfly Pattern
- Crab Pattern
- Cypher Pattern
- We should always implement sound risk management rules when trading harmonic patterns, or any strategy for that matter.
- Stop Losses should be placed right beyond the D point after the price confirms the pattern and then reverses the move.
- There are four targets that can be used when you trade harmonics – the A, B, and C swing levels and the 161.8% Fibonacci extension of the CD price move.