Have you ever heard of Fibonacci ratios in Forex trading? If not, then you have come to the right place. And even if you have, you may just learn a thing or two. Today I am going to explain to you the importance of the Fibonacci sequence in Forex trading and its importance as potential support and resistance levels.
Fibonacci Numbers Explained
You have probably heard about the famous Fibonacci numbers. But what is the significance of these numbers actually in trading? Well we are going to dive into that, but first lets go thru a little bit of history.
Centuries ago, a mathematician named Leonardo Fibonacci, introduced an interesting relation between numbers. He introduced a number sequence, which starts with zero and one (0, 1). Then to each number he adds the previous one which results in the following sequence:
0, 1, 1, 2, 3, 5, 8, 13, 21, 34, 55, 89, 144, 233, 377, 610, 987, 1597, 2584, 4181, 6765, 10946…
…and so on and so on.
Notice again that each number of this number succession is formed by the sum of the previous two.
So, what is so interesting about this Fibonacci number series…You ask?
Fibonacci discovered an interesting relation between the numbers in his sequence, He realized that each number is 61.8% of the next number in the set. That’s right! He discovered one more thing. Each number in the set is 38.2% of the number two positions to the right in the sequence. Let’s look at an example:
Let’s take number 987 from the Fibonacci set and see how it relates to the next number in the sequence – 1597.
987 / 1597 = 0.61803381
When you convert 0.61803381 to a percentage you get 61.803381% = 61.8%.
Let’s take another example:
We take the same 987 number and we will now see how this relates to the number which is two positions to the right of it in the set – 2584.
So, here it is:
987 / 2584 = 0.38196594
When you convert 0.38196594 into a percentage you get 38.196594 = 38.2%.
In case you think this is a coincidence, I will do another demonstration for you:
This time we pick a bigger number – 4181. Now we will see what percentage this number corresponds to with the one which lies next to it – 6765.
4181 / 6765 = 0.61803400
When we convert 0.61803400 to a percentage value we get 61.803400%, which is rounded at 61.8%.
Let’s now see what we will get if we divide 4181 with the number which is two positions to the right – 10946:
4181 / 10946 = 0.38196601
After converting 0.38196601 to a percentage value we get 38.196601%, which is 38.2% after rounding.
Another ratio could be extracted from the Fibonacci sequence. Every number in the set is equal to 23.6% of the number which is three positions to the right of it.
Let’s take the number 2584. If you run thru the sequence you will see the third number to the right of this would be 10946. And so…
2584 / 10946 = 0.2360679700347159
When we convert this number into a percentage, we get 23.60479700347159%. After rounding, this is 23.6%.
This is how the Fibonacci number set works.
>
How Do the Fibonacci Numbers Apply in Nature?
In order to understand the Forex analysis relationship of the Fibonacci ratios, we first need to look a little deeper into these values from a different angle.
Fibonacci soon realized that his ratios were prevalent everywhere in the natural world and that the ratios 38.2% and 61.8% held special significance.
The 61.8% and the 38.2% ratios are all around us in the universe. You find these values all over the natural world – in plants, in animals, in space, in music, in people’s fingerprints, and even in human faces! Have a look at the image below:
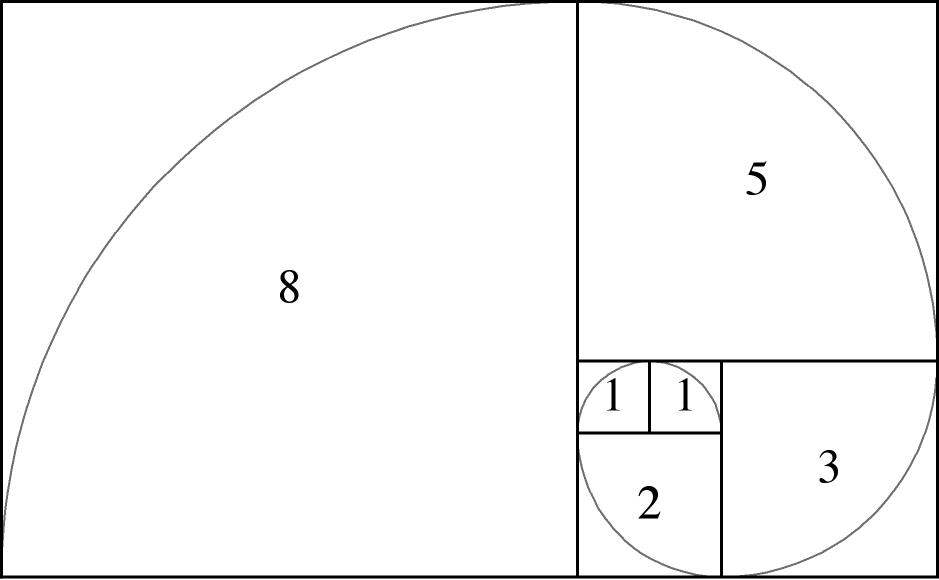
This shape is the basic Fibonacci Spiral. Notice that the volume of each segments of this shape is equal to the Fibonacci sequence itself: 1, 1, 2, 3, 5, 8, and the spiral curls and curls to infinity. So, when you take a closer look at the Fibonacci spiral, does it look familiar to you? Let me introduce few more images to you

All four of these images portray the Fibonacci Spiral found in nature. Since the human eye constantly sees Fibonacci shapes it has become accustomed to them over the centuries, perceiving them as harmonious.
This understanding also applies to human psychology and facial features. If someone’s face matches the Fibonacci parameters, it is generally perceived as beautiful and good looking to others. Have a look at the image below:
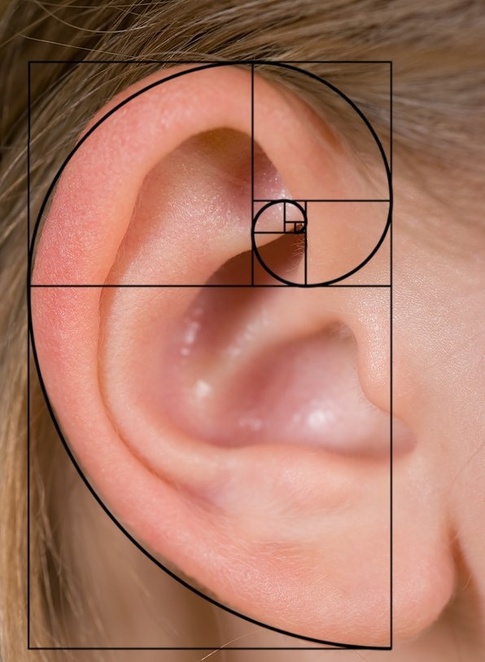
This is a picture of a human ear with absolutely proportional size and shape. As you see, the Fibonacci Spiral is added to the image showing that the parameters of the ear match the Fibonacci sequence. The ear on the image above is considered beautiful to the human eye, because it responds to the Fibonacci ratios. Since the human eye constantly observes this ratio in nature, the human eye has adapted over the centuries to perceive as beautiful, those shapes which match the Fibonacci values.
Now look at this image:
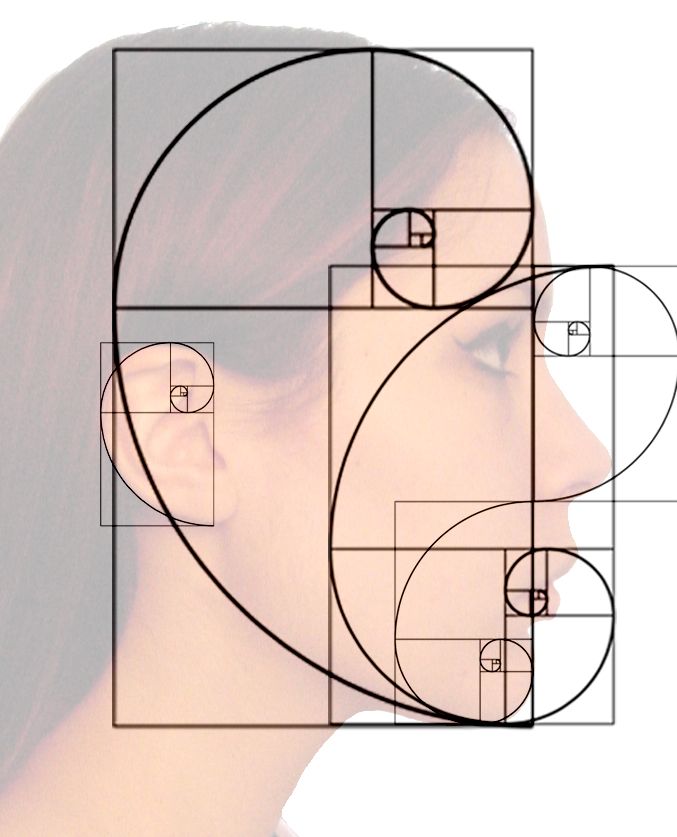
This is a facial portrait, which is highly responsive to the Fibonacci ratios. And it would be generally accepted, that this face is considered appealing and beautiful. On the other hand, faces with parameters that are not as responsive to the Fibonacci values is not as likely to be attractive to the human eye.
Some of the big corporations around the world take advantage of the Fibonacci sequence and its meaning to the human’s perception. For example, many of the well-known brand logos around the world are conformed to the Fibonacci ratios on purpose, so they can be appealing to the human eye. Have a look at the logo below:
![]()
I bet you recognize this company logo. Yes, this is the well known Apple logo. This company logo is fully conformed to the Fibonacci ratio in order to be attractive and receptive to the human eye. Fascinating, isn’t it?
How to Implement Fibonacci Analysis in Forex Trading?
So we have now seen how the Fibonacci numbers relate to the natural world and human perception. But how can we apply Fibonacci in Forex trading and how can we improve our analysis with Fibonacci ratios?
Imagine the price of a Forex pair is trending upwards as a result of the bulls dominating over the bears. Then suddenly, the bears overtake the bulls and the price direction reverses. The price starts dropping against the previous trend, but for how long? This is where the Fibonacci ratios can be applied and prove useful in our trading decisions.
When the primary trend is finished and a contrary movement occurs, it is likely that the contrary move to equal 38.2% or 61.8% of the previous trend. The reason for this is that investors tend to change their attitude after the price retracements of 38.2% or 61.8% of the general trend. As we have already said, human nature has gotten used to the Fibonacci ratios within the natural environment and so it is just a natural tendency for traders, whom are part of the natural environment, to react at these levels. Traders are likely to switch sides when the price interacts with a crucial Fibonacci level.
Now that we have a basic understanding of the Fibonacci sequence and its effects in the financial markets, we turn our focus to the various trading tools that help us find these hidden levels on a chart
Fibonacci Retracements
This is the most famous Fibonacci tool and is available on nearly every Forex trading platform. It consists of a line, which is used to locate the Basic trend. With manually adjusting the line on the trend line, the Fibonacci levels are being automatically drawn on the price chart. When you settle on your Fibonacci Retracement instrument on the chart you will get horizontal lines, which indicate the levels 0.00, 23.6, 38.2, 50.0, 61.8, and 100. Once we get our Fibonacci Retracement levels, we can start our Fibonacci analysis. Let’s take a look further to see how this would work:
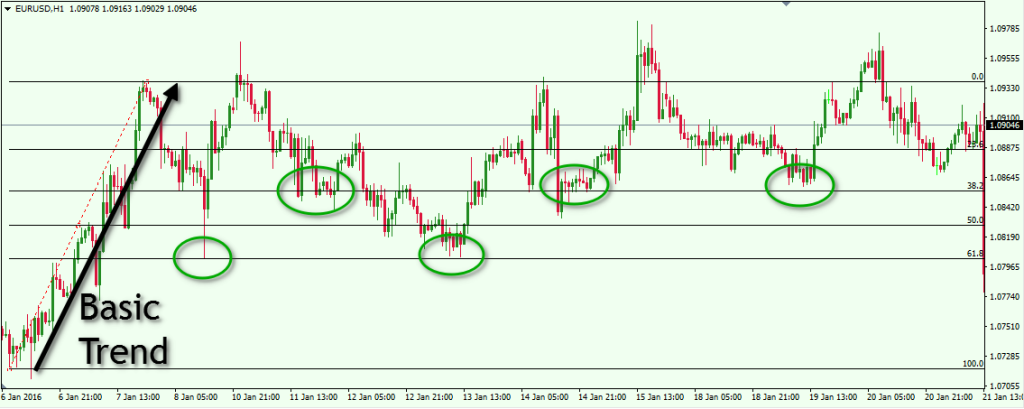
This is the 60 min chart of the most traded Forex pair – EUR/USD. The time frame is from– Jan 6 – 21, 2016. As you can see from the image above, we have marked the basic trend, by marking the bottom to the top of the trend. This is what we would use to calculate the Fibonacci retracement ratios. The horizontal lines mark the Fibonacci percentages based on the Fibonacci sequence.
Let’s see how the price reacts to the Fibonacci levels on this chart:
- After the end of the bullish trend, the price drops and finds support at the 61.8% fib retracement level.
- After rebounding to the trend’s top, the EUR/USD drops to test the 38.2% retracement level. Notice that the price tests this level about three times.
- Then we get a slight increase to 23.6%. The price tests the level and drops again.
- The following drop reaches 61.8%. This level gets tested couple of times. Then we get another increase to 100%.
- Then another price drop to test the 38.2% level.
- Later on, we see another bounce from our 38.2% fib retracement area.
Fibonacci analysis can be used as part of a trading strategy or as a stand alone trading method. A simple set of rules would be to go long whenever the price bounces from 61.8% or 38.2%. Place a stop loss right below the bottom of the bounce. If the price moves in your favor, adjust the stop upwards. If the price breaks a new Fibonacci Level, move the stop to the middle of that Fibonacci Level and the Lower one. Hold the trade until the price reaches 0.00% or until the stop loss is hit. Let’s now play this strategy over the chart above:
- The first green circle shows the first bounce off the price from the 61.8% level.
- Go long when the price touches that level and bounces in bullish direction.
- In this position, the close signal comes when the price hits 0.00%.
- This long position could have generated profit equal to 136 pips.
- The next long position should come in the second circle when the price bounces from 38.2%
- Unfortunately, one of the last candlewicks during the bounce hits the stop loss order.
- This position would have generated a loss of 10 pips.
- The third long position could come right after the decrease to 61.8% in the third green circle.
- An increase comes and when 23.6% is broken upwards, the stop should be adjusted between 23.6% and 38.2%.
- After consolidation around 23.6% the price drops and hits the stop.
- From this long position one could have made 41 bullish pips.
- In the next green circle, you see the fourth potential long position. Go long after the bounce from the 38.2% level.
- This long position leads right to the 0.00% level, which is the close signal.
- One could have made 76 bullish pips out of this long trade.
- There is even an opportunity for a fifth trade on this chart. One should go long after the bounce from 38.2% shown in the last green circle.
- Again, the close signal comes with the break through the 0.00% level.
- This potential long position equals 66 bullish pips.
The total outcome from this simple Fibonacci Retracement strategy implemented on the chart above could have made profit equal to 309 pips. But keep in mind that this is an overly simplistic trading example just to show you the power of the Fib levels in trading, however, the true power of Fibonacci trading is realized when you combine other Key Support and Resistance levels with Fibonacci retracement levels. And so when you get a confluence of Support and Resistance around these levels, then there is a high likelihood of prices holding there.
Fibonacci Fan
This is another useful Fibonacci tool. It is based on the Fibonacci ratios, but it takes a different form on the chart. You draw your Fibonacci Fan the same way you do it with the Fibonacci Retracement, just identify the trend and stretch the indicator on it. The other components of the Fibonacci Fan will appear automatically. These are three diagonal lines, which vertically are distanced with 38.2%, 50.0% and 61.8% from the top of the trend. After we place our Fibonacci Fan on the chart, we observe the way the price reacts to the diagonal Fibonacci levels. The image below will make it clearer for you.
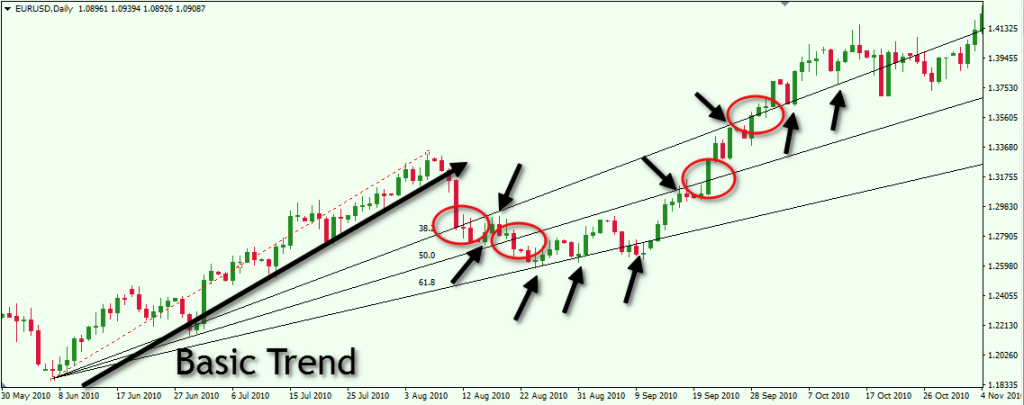
This is the Daily chart of the EUR/USD for the period May 30 – Nov 3, 2010. We have identified the basic trend, where we place our Fibonacci Fan instrument. The small black arrows show the areas where the price bounces from the Fibonacci Fan levels. The red circles show where the levels get broken.
Notice the way the price interacts with the trend lines of the fib fan:
- After the end of the trend, the price drops through 38.2%.
- The price reaches 50.0 afterwards and bounces upwards.
- Then we see a test of the already broken 38.2% as a resistance and a bearish bounce from this level.
- The price breaks 50.0% afterwards and drops to the 61.8% level.
- The 61.8% level gets tested as a support three times in a row.
- After the third bounce the price jumps upwards breaking the 50.0% level.
- The increase continues and we see a break through 38.2%
- 2% level gets tested as a support afterwards.
Let’s say we want to create a simple Fibonacci System to trade using the Fib Fans. What we could do is every time the price bounces from 38.2% or 61.8% a long position could be opened. Stop losses should be placed right under the bottom of the tests. The trade could be held until the price breaks one of the fan levels in bearish direction.
In our case, we have no bounces from 38.2%. However, there are three bounces from 61.8%. Let’s simulate the eventual trading:
- Go long right after the first bounce from 61.8%.
- The price goes upwards and then drops again to 61.8% for a test.
- The level sustains the price and we see another price increase.
- Close the trade when the price closes a candle below 61.8% – the third bottom on that level.
- One could have made a profit of 22 pips from this trade.
- Then we can go long again when the price closes a candle above 61.8%.
- Hold the trade until there is a break in the stop loss right below the third bottom on 61.8%, or when you see the price breaking one of the fan’s levels in bearish direction.
- The price starts a strong bullish increase through 50.0% and 38.2%.
- 2% gets tested as a support afterwards.
- Stay with the trade until the price breaks 38.2% in bearish direction.
Keep in mind this is a simplified example to demonstrate the use of Fib Fans in trading. But the real power of Fib Fans and Fib Retracements as well, come from confluence with other technical analysis tools.
Conclusion
- The Fibonacci projections come from a number sequence starting from (0, 1), where each number should be added to the previous one, which creates the next number of the sequence – 0, 1, 1, 2, 3, 5, 8, 13, 21, 34, 55, etc.
- The relation between these numbers generates the basic Fibonacci Ratios – 61.8% and 38.2%.
- These ratios are found all around us in the natural universe,
- Since people constantly see Fibonacci ratios subconsciously, human nature has been adapted to perceive this as a harmonic ratio.
- The Fibonacci Ratio is present in the financial markets, since the markets are really just a reflection of human emotions.
- When the price reverses a trend, the reversal intensity is likely to start hesitating or even stop around 38.2% or 61.8% the size of the previous trend.
- Some of the Fibonacci trading tools to measure these ratios on-chart are the Fibonacci Retracements and the Fibonacci Fan.
- Fibonacci Ratio tools should be used in conjunction with other technical analysis methods and when technical confluence is present around these levels, then there exists a possibility of a high probability trade setup.