What is a Moving Average?
The Moving Average indicator is one of the most basic Forex technical analysis tools. It is an on-chart lagging line, which smooths the price action. The reason for the lag is that the Moving Average averages a certain number of periods on the chart.
The basic function of the Moving Average is to provide the trader with a sense of overall trend direction, but is can also provide signals for upcoming price moves. In addition, the Moving Average line can act as an important support and resistance area. The reason for this is that price action tends to conform to certain psychological levels on the chart.
Calculate Moving Average
Every Moving Average is subject to a calculation, which gives an output that can be plotted on the price chart.
Imagine you have a 5-period Simple Moving Average (SMA) on the EUR/USD chart. This means that each period on the SMA will give you an average of the 5 previous periods on the chart.
In this manner, if the price of the EUR/USD starts increasing, the SMA will start increasing 5 periods later. If the EUR/USD accounts for 1.1000, 1.1100, 1.1200, 1.1300, and 1.1400 in five consecutive periods, then the 5-period SMA will give us a value of:
(1.1000 + 1.1100 + 1.1200 + 1.1300 + 1.1400) / 5 = 1.1200
This is why the Moving Average is a lagging indicator – because it needs a certain number of periods to average in order to show a value. In regards to that, a Moving Average could be set to whatever period you want.
This is how a Moving Average looks on the chart:
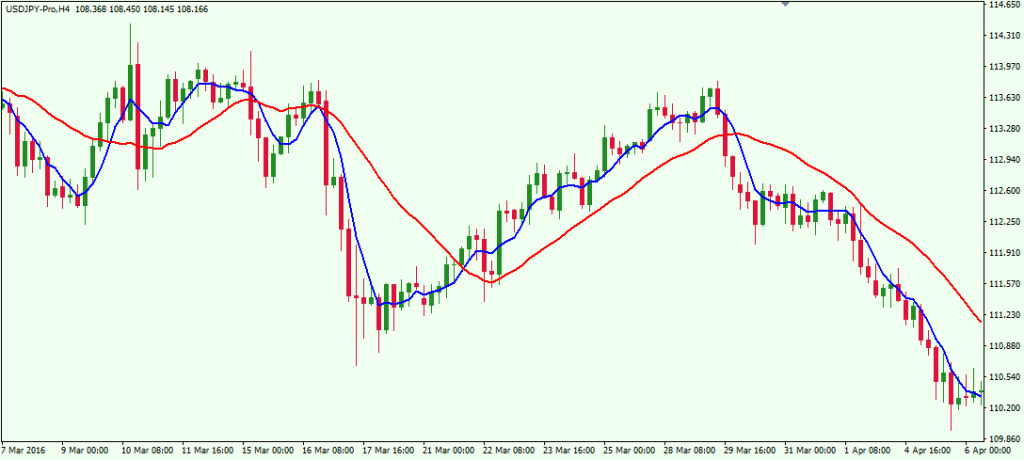 This is a price chart with two Simple Moving Averages on it. The blue line is a 5-period SMA, which takes into consideration 5 periods on the chart to show a value. The red line is a 20-period SMA, which takes into consideration 20 periods from the chart to show a value.
Notice that the red 20-period SMA is slower than the blue 5-period SMA. It is smoother and it does not react to small price fluctuations. The reason for this is that the 20-periods SMA takes more periods into account. In this manner, if we have a rapid price change which lasts for one period, and then the price gets back to normal, the other 19 periods will neutralize this fluctuation. See the calculation below:
Let’s say the price stays at 1.50 for 10 periods. On the eleventh period, the price reaches 1.55 – a substantial 500 pips move. Then during the next 9 periods the price returns and stays at 1.50 again. What will the 20-period SMA show?
(19 x 1.50 + 1.55) / 20 = 1.5025 (20-period SMA value)
Now let’s say the price starts at 1.50 for the first period. Then during the second period the price reaches 1.55. Then for the next three periods the price returns and stays at 1.50 again. What will our 5-period SMA show?
(4 x 1.50 + 1.55) / 5 = 1.5100 (5-period SMA value)
So, in the first case we have a 1.5025 value, which barely differentiates from the basic 1.50 price range. In the second case we have a 1.5100 value, which is 75 pips more. So in essence, the bigger SMAs react smooth price better and react less to price individual bar fluctuations.
Types of Moving Average
There are different types of Moving Averages depending on how they are calculated. For example, Some of the Moving Average lines weigh recent price action more heavily than past price action, others treat all price action the same for the entire period. Let’s now at some of the most popular types of Moving Averages:
Simple Moving Average (SMA)
Above you saw the structure of the most common Moving Average – the Simple Moving Average. It just gives an arithmetic mean of the periods on the chart.
Exponential Moving Average (EMA)
The Exponential Moving Average (EMA) is another Moving Average, which Forex traders frequently use. It looks the same as the Simple Moving Average on the chart. However, the EMA calculation differs from the SMA calculation. The reason for this is that the EMA puts more emphasis on the more recent periods. This is the Exponential Moving Average formula, used to calculate an EMA.
EMA = M x P + (1 – M) x (EMA previous)
- M: multiplier
- P: current price
- EMA previous: previous EMA value; If there isn’t previous EMA value, use value of the same period SMA.
Now we have to calculate the multiplier. This concerns another formula:
- M = 2 / n + 1
- M: multiplier
- n: respective periods
Let’s now calculate a 20-period EMA. We will first calculate the multiplier.
- M = 2 / 20 + 1
- M = 2 / 21
- M = 0.095 (0.0952380952380952)
We will now calculate the current EMA. However, we will need a previous EMA value. Let’s say the previous EMA value is 1.40 and the current price is 1.38. We apply the values we have in the formula:
- EMA = M x P + (1 – M) x (EMA previous)
- M = 0.095
- P = 1.38
- EMA previous = 1.40
- EMA = 0.095 x 1.38 + (1 – 0.095) x 1.40
- EMA = 0.1311 + 0.905 x 1.40
- EMA = 0.1311 + 1.267
- EMA = 1.3981
The multiplier we calculated determines the emphasis put on the recent periods. In this manner, the more the periods there are, the less the emphasis will be, because it will embrace more periods. Now let me show you the way the EMA differs from the SMA on the chart below:
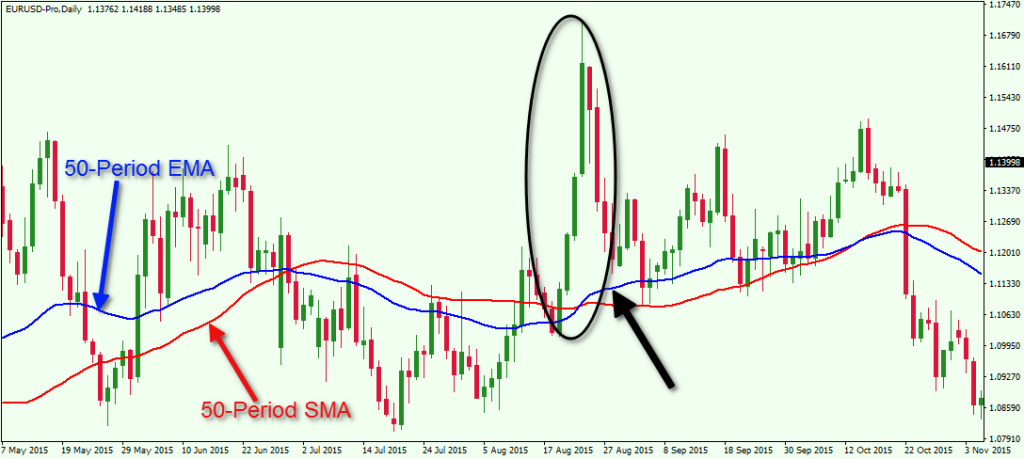
This is the daily chart of the EUR/USD with a red and a blue 50 Day Moving Average on it. The red one is a 50-period SMA and the blue one is a 50-period EMA. As we said, the EMA and the SMA differ and they do not move together, because the EMA puts emphasis on the more recent periods.
Now look at the black ellipse and the black arrow on the chart. Notice that the candles in the ellipse are big and bullish, indicating a strong price increase. This is when the blue EMA switches above the red SMA, because the EMA’s emphasis falls more on these candles.
Volume Weighted Moving Average (VWMA)
The Volume Weighted Moving Average has a similar structure to the Exponential Moving Average.
The difference is that the VWMA puts emphasis on the periods with higher volume. This is how a 5-period VWMA is being calculated:
5-period VWMA = (P1 x V1) + (P2 x V2) + (P3 x V3) + (P4 x V4) + (P5 x V5) / (V1 + V2 + V3 + V4 + V5)
- P: price of the respective period
- V: volume in the respective period
So, the higher the volume of a period, the more the emphasis will be on this period. Have a look at the image below.
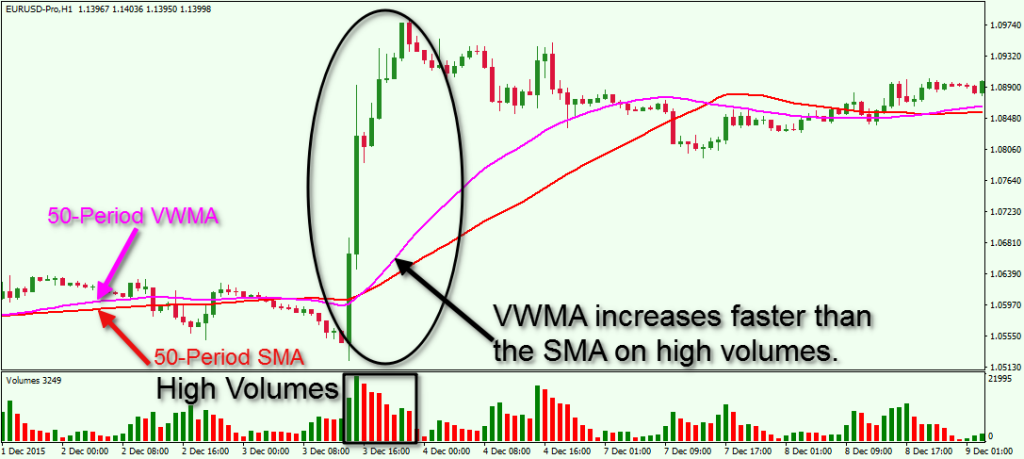
This is the hourly chart of the EUR/USD showing a rapid price increase on high volumes. We have two Moving Averages on the chart. The red line is a 50-period Simple Moving Average and the pink line is a 50-period Volume Weighted Moving Average.
In the black ellipse we see a rapid price increase. In the black square we see that the price increase is due to high trading volumes on the EUR/USD. This is why the VWMA switches above the SMA at this time – volumes are high and the VWMA puts emphasis on the higher volume readings.
Trend Analysis with Moving Average
The Moving Average indictors can help us to identify the beginning and the end of a trend. The Moving Average Trading method involves a couple of signals that tell us when to be prepared to enter and exit the market. Let’s talk about these further.
Price Crosses the Moving Average Line
The most basic Moving Average signal is when the price crosses the Moving Average. When the price breaks the Moving Average upwards, we get a bullish signal. And on the flip side, when the price breaks the Moving Average downwards, we get a bearish signal.
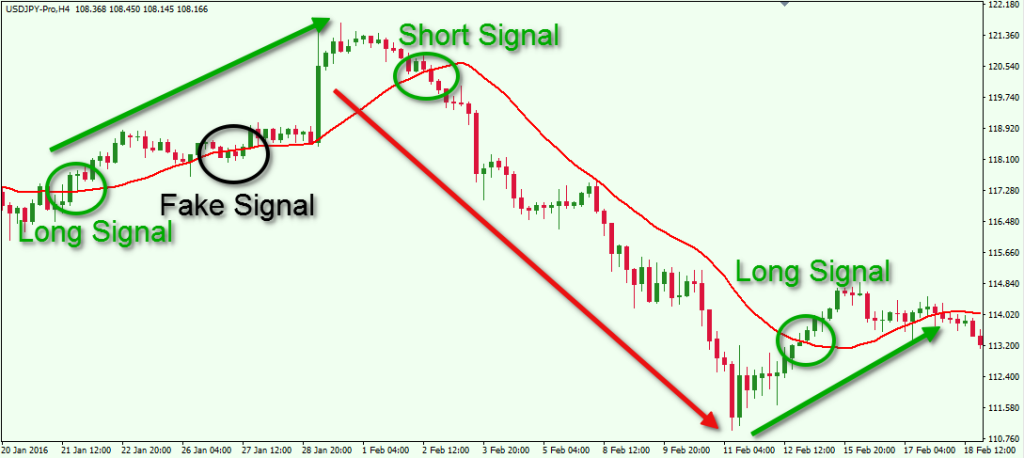
This is the 4 hour chart of the USD/JPY for Jan – Feb, 2016. We have a 20-period SMA on the chart. The image shows four signals caused by price action and the Moving Average line interaction.
In the first case the price breaks the 20-period SMA in a bullish direction. This creates a long signal. The price increases afterwards. The second signal on the chart is bearish. However the signal is a false breakout and the price quickly returns above the SMA. Then the price breaks the 20-period SMA in a bearish direction creating a short signal. The following drop is quite strong and sustained.
If you trade with this strategy you should remember that in general, the more the periods included in the Moving Average, the more reliable the signal is. And many traders who follow a simple moving average system watch the 50 day moving average and the 200 day moving average line very closely. However, when using a higher moving average, the lag of the Moving Average line to Current Price Action will be greater too. This means that each signal will come later than when we use a Moving Average with less periods.
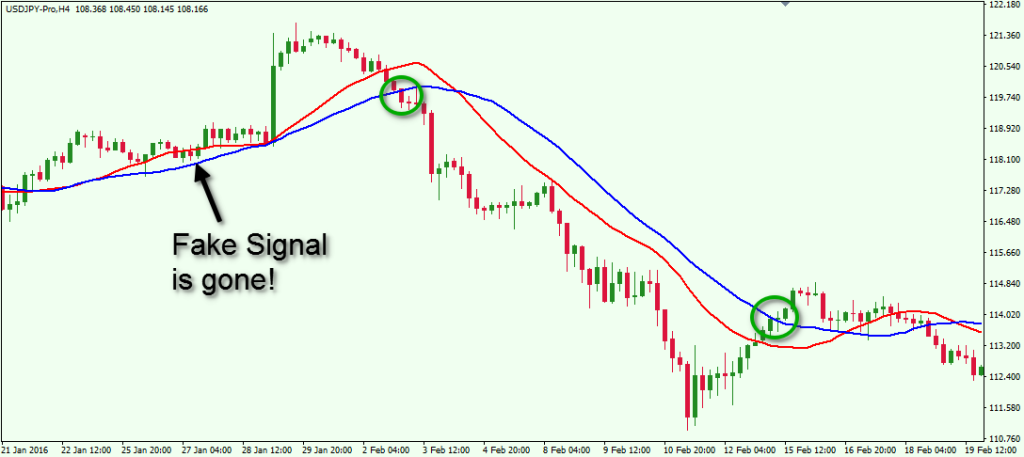
This is the same USD/JPY chart, but this time we have a 30-period SMA on the chart along with the original 20-period SMA. Notice that the blue 30-period SMA isolates the fake signal. However, the signal for the strong bearish trend comes later than with the 20-period SMA (red). The long signal at the end of the trend comes later too. Keep in mind there is no optimal Moving Average line that can used in all markets or even in the same market. This is an important point that should be factored into any Moving Average based trading strategy.
Moving Average Crossover
A Moving Average crossover signal involves the usage of more than one Moving Average. To get a Moving Average crossover, we need to see the faster Moving Average breaking the slower moving average. If the crossover is in bullish direction, we get a long signal. If the crossover is in bearish direction, we get a short signal.
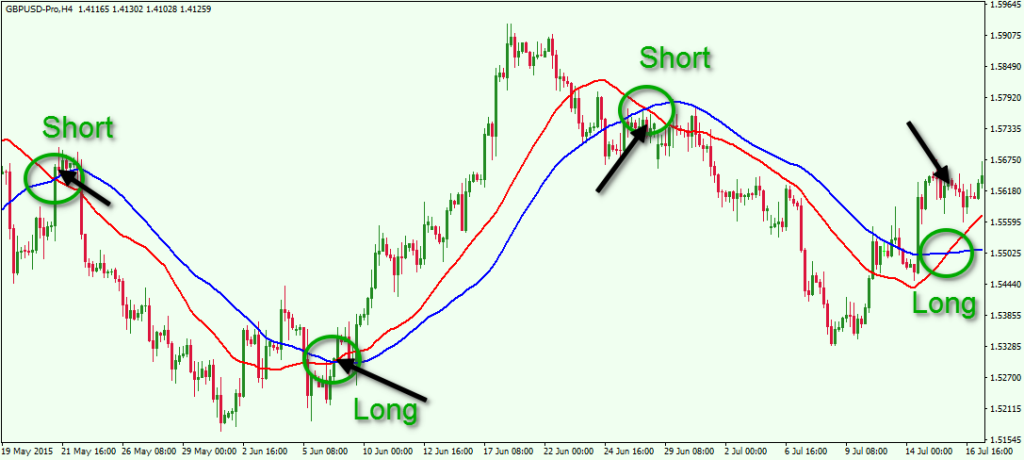
The candlestick chart above shows the H4 chart of the GBP/USD Forex pair for May 19 – Jul 16, 2016. The red line is a 30-period SMA and the blue line is a 50-period SMA. In this manner, the red SMA is faster than the blue SMA, which creates the crossover signal. We have three trending moves on the chart. For each of these we have a Moving Average crossover on the chart. The black arrows point to the candle which responds to the time of the SMA crossover.
Traders can use crossovers as entry points for their trades. Some traders use the crossovers as exit points as well. However, if you want to exit the market based on a Moving Average signal, you have two other options. You can exit your trade when the price breaks the faster Moving Average, or when the price breaks the slower Moving Average. It is not necessary to wait for the crossover when you exit a trade based on your Moving Average strategy.
Important Moving Average Levels
Even if a Forex trader doesn’t base his trading strategy on Moving Averages, they should still study price action at crucial Moving Average levels on the chart. The reason for this is that, in many instances, price action conforms to crucial Moving Average levels. Some most important Moving Average levels are the 50-period SMA, 100-period SMA, the 150-period SMA and the 200-period SMA. As you see, these Moving Averages are relatively big in terms of periods. But that is also why they are closely watched as areas of interest. These levels are considered important in terms of support and resistance. The image below will show you an important longer term Moving Average in action.

This is the monthly chart of the EUR/USD covering the period between 2007 and 2016. The blue line on the chart is a 150-period SMA. Notice that couple times the EUR/USD price tested the 150-period SMA as a support. The two tests happened in the middle of 2010 and in the middle of 2012. Then in the middle of 2014 the price decreased to the 150-period SMA for a new test. However, the SMA was sharply broken in bearish direction, bringing the EUR/USD price to a 12-year low.
Here is another example:
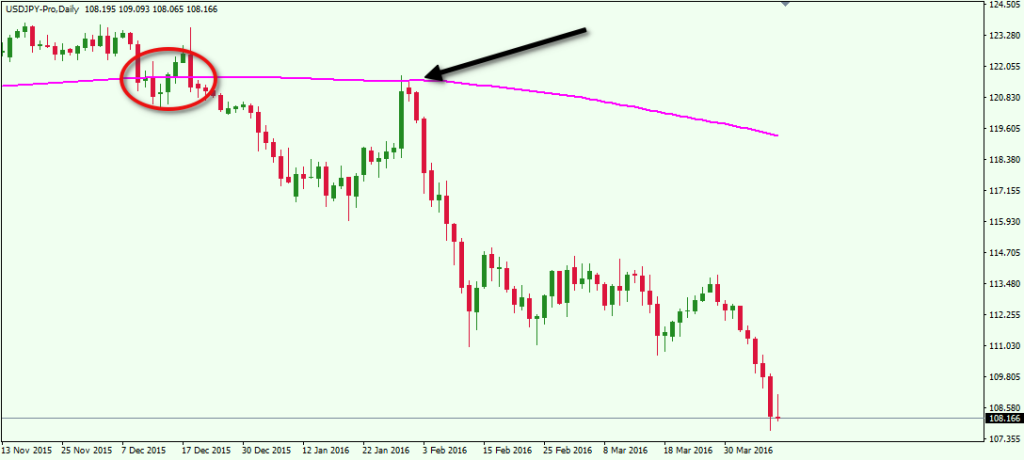
This is another Moving Average example at the daily chart of the USD/JPY. The image shows a 200 day Moving Average line on the chart. The price breaks the 200-day SMA and then tests it as a resistance. This speaks of the importance of the 200-period SMA on the daily timeframe chart.
Fibonacci Moving Average Trading
There is a psychological relationship between Fibonacci ratios and certain Moving Averages. Traders can use Fibonacci based Moving Averages to help discover dynamic Support and Resistance areas on a price chart. Let’s take a look at the example:
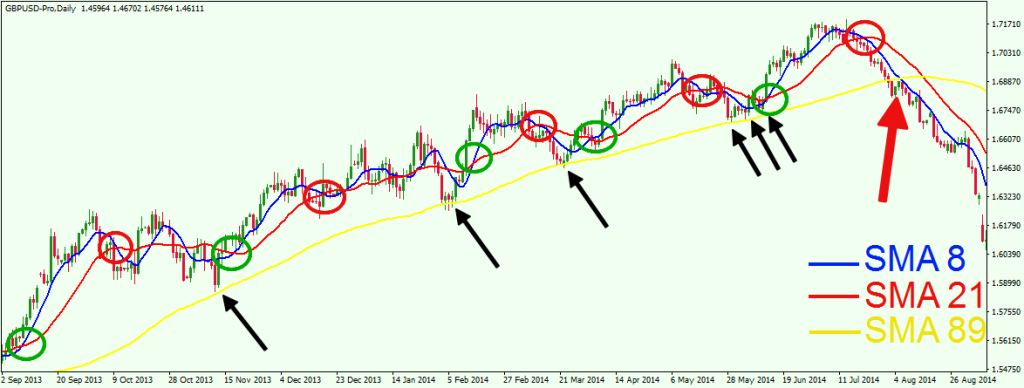 The image above shows the daily chart of the GBP/USD for Sep, 2013 – Aug, 2014. There are three Simple Moving Averages plotted on the chart, which corresponds to the following Fibonacci numbers:
Blue: 8-period SMA
Red: 21-period SMA
Yellow: 89-period SMA
As you see, the number periods of these SMAs are taken from the well-known Fibonacci sequence:
1, 1, 2, 3, 5, 8, 13, 21, 34, 55, 89, 144, etc.
On the chart above we use the yellow 89-period Simple Moving Average as a support of a strong uptrend. At the same time, crossovers from the blue 8-period and the red 21-period SMAs can be used to attain exact entry and exit points of potential trading positions. In our example, we have 5 potentially good trade setups on the way up. When the price tests the yellow 89-period SMA as a support and bounces upwards, the long signal comes when the blue and the red SMAs cross upwards after the bounce (green circles). The exit signal comes after a crossover in the opposite direction (red circle).
Notice that after the last long opportunity, the Cable price decreases through the yellow 89-period SMA, giving a strong reversal signal.
In all the examples above we used Simple Moving Averages, because it is the one most commonly used in Forex trading. Nevertheless the trading strategies above would work the same way with different moving averages – Exponential, Volume Weighted, etc.
Conclusion
- The Moving Average indicator is one of the most important technical analysis tools in Forex.
- There are different types of Moving Averages based on the criteria for averaging periods. Some of the most widely used Moving Averages are:
- Simple Moving Average (SMA): It is a simple arithmetic mean of the selected periods.
- Exponential Moving Average (EMA): It puts emphasis on the more recent periods.
- Volume Weighted Moving Average (VWMA): It puts emphasis on the periods with higher trading volumes
- Moving Averages can be used to get entry and exit signals on the chart. The two basic Moving Average signals are
- The price crosses the Moving Average
- Multiple Moving Average crossover
- Some of the most important Moving Average levels are:
- 50-period SMA
- 100-period SMA
- 150-period SMA
- 200-period SMA
- Traders could implement Fibonacci trading with adding Moving Averages, which respond to Fibonacci numbers from the well-known sequence. Some of the most used ones are:
- 8-period SMA
- 21-period SMA
- 89-period SMA