Developing and applying a Forex strategy with a distinct edge plays a crucial role in the success of a trader. Therefore, it is essential to learn and test different currency trading techniques so that you can get some idea as to what style of trading you are most comfortable with.
In this article, we will discuss a few different types of market strategies which should help you with your own evaluation process.
Foreign Currency Trading Strategies Explained
At a basic level, a forex trading strategy represents a set of trading rules within a trading plan that is implemented to generate profit from currency fluctuation.
Since there is no possibility of any FX trade strategy being correct 100% of the time, the primary goal is to enhance the odds in the trader’s favor, and apply the given edge in the market with as much frequency as the market allows.
Forex traders have a wide array of trading tools at their disposal to develop their trading strategies. The tools and techniques used will depend a lot on whether a trader is a technical analyst or fundamental analyst.
For a technical trader for example, some of these tools are price derivatives such as indicators, oscillators, and moving averages. Other type of analysis could be implemented on a naked chart using price action, where traders directly analyze price using tools such as trend lines, channels, chart patterns, candle formations, etc.
Types of Strategies for Forex Trading
There are two primary classes of Forex market analysis – technical analysis and fundamental analysis.
Technical Forex Trading Strategies
Technical trading strategies are based on chart analysis and thru the examination of previous price fluctuation. Looking at previous price action, traders make an assumption for what the future price action is most likely to do.
When building a technical Forex trading strategy, traders can choose from a multitude of studies, and in fact technical analysis itself has many sub-categories within it that a trader can explore.
Some of the most popular building blocks for a trading strategy include technical indicators such as Moving Averages, MACD, Stochastic, Relative Strength Index, Volume, Bollinger Bands, and Keltner channels to name a few.
Most forex trading platforms have dozens of technical indicators built-in. Some platforms such as Ninjatrader even allow you to create and back test strategies using their built-in indicator library in an easy to use environment based on conditional rules without any programming knowledge required.
Fundamental Forex Strategy
Fundamental analysis relies on economic and geo-political news releases and data to drive the trade decision process. Since every currency represents the economic performance of its respective country, fundamental traders use information about a country’s economic health to determine future price moves of a currency pair.
If a country announces a better-than-expected figure for an important economic report, this may boost the bullish sentiment in the currency, leading to a price increase. If a country announces a worse-than-expected figure for an important economic report, this may boost the bearish sentiment in the currency, leading to a price decrease.
For example, if the EU Central Bank announces that it will increase the interest rate in the Euro Zone, a fundamental trader may believe that this is likely to decrease the price of the Euro versus other major currencies.
Their reasoning could be based on the assumption that an increase in rates is likely to result in less attractive spending conditions in the country (loans are expensive). And a deteriorating spending condition would be reflected in the Euro becoming more devaluated.
So, the fundamental trader may contend that if the European Union decreases the Euro Zone interest rates, we will most likely see a decrease in the EUR/USD exchange rate – Euro depreciates versus the American Dollar.
This may or may not happen obviously, however, this is an example of how a fundamental analyst would likely arrive at a trading decision, which is a stark difference to how a technical trader approaches the market.
So generally, fundamental traders typically use economic news releases and data to speculate on price moves. If the news release is more optimistic than expectations, a fundamental trader may buy the respective currency on the assumption that it will appreciate.
If the news release is more pessimistic than expectations, then a fundamental trader is likely to sell that respective currency assuming that it will depreciate.
It is important to note that expectations are as important is not more to the news trader than the actual figure, because it is the divergence between what is actually reported and what the prior consensus expectations were that will fuel the price movement.
Technical Traders vs Fundamental Traders
As we have touched on thus far, Forex traders are often divided into two sides based on their analysis approach – technical analysts and fundamental analysts.
Technical analysts believe that future price moves can be forecasted based on chart analysis techniques. They believe that most available information is already priced into the market.
Many fundamental analysts believe that technical analysis is merely a self-fulfilling prophecy and that the best way to analyze currency movements is thru the study of economic, political, and social conditions of countries – the fundamental data.
The truth is that both technical and fundamental analysis have their merits and drawbacks, and there should be no reason to approach them in a mutually exclusive manner.
Technical traders who rely primarily on their chart would surely benefit from having a basic understanding and knowledge of a country’s fundamentals. At the same time, fundamental analysts can benefit greatly from the use technical methods for better market timing of their fundamentally based market outlook.
Forex Strategy Examples
Now that you are familiar with the two primary types of Forex trading philosophies, we will move on to illustrating three simple strategies that you can add to your toolbox. We will take a look at a few trade examples using price action analysis, technical indicators, and economic news releases.
Forex Trading Strategy Using Chart Patterns
The first strategy we will discuss relies on traditional technical analysis. Pure price action analysis is typically implemented on naked charts that contain no trading indicators or oscillators. Price action traders often use horizontal and diagonal lines to find key support and resistance areas on the chart.
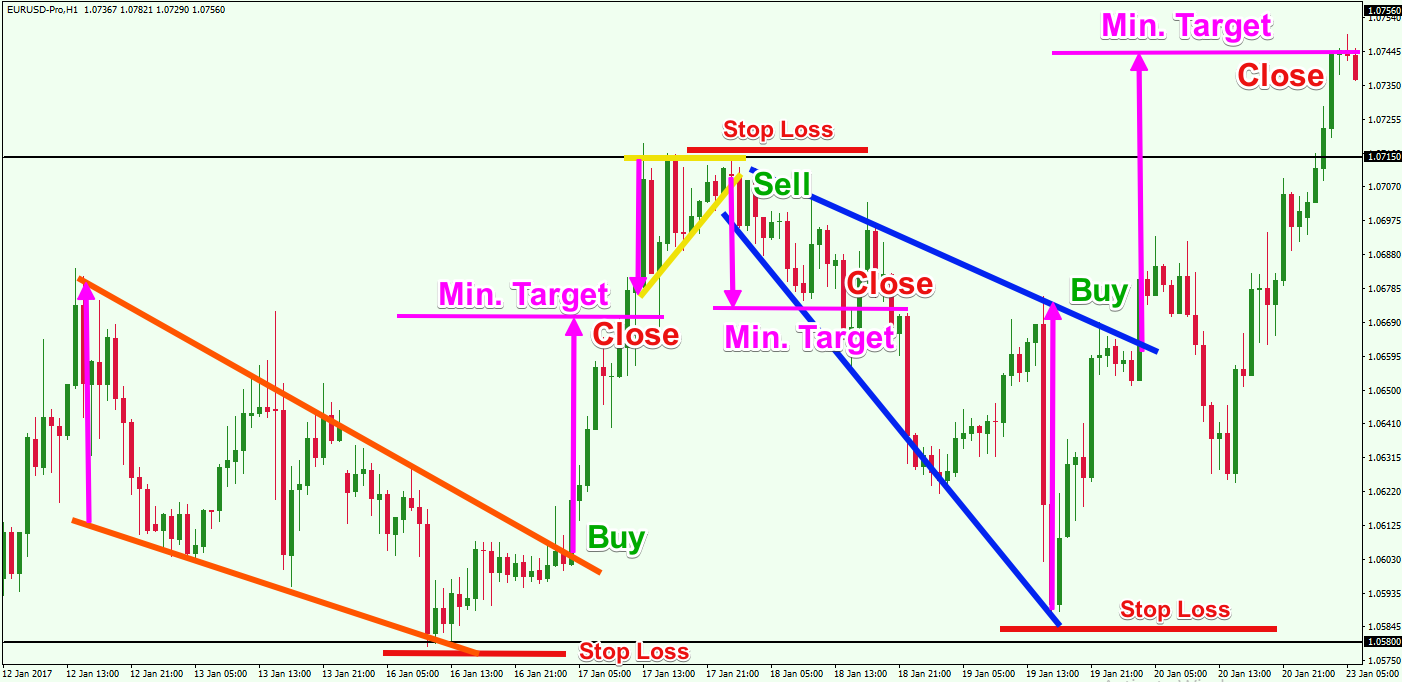
The image above shows three trade setups based on pure price action analysis. The chart we are using is the hourly chart of the EUR/USD for Jan 12 – 23, 2016.
The first pattern we notice on the chart is a Falling Wedge formation, which we have marked with orange. The price action moves downward as the tops are decreasing with higher intensity than the bottoms. The EUR/USD price gradually reaches the support at $1.0580. Soon after, price breaks the wedge through the upper level and begins to move in a bullish direction.
You could go long at the breakout placing a stop loss order below the lowest point of the Wedge. You would want to hold the trade for a minimum price move equal to the size of the Wedge at its widest part. This is the measured move projection for the falling wedge.
The bullish run propelled the price to the resistance at $1.0715 where the EUR/USD started consolidating again. The range resembles an Ascending Triangle, which we have marked in yellow.
The Ascending Triangle has the potential to push the price towards a move equal to the triangle’s size at its wider part. However, the directional potential of the pattern is unknown. Therefore, you should wait and carefully watch the price action for a breakout through one of the two levels.
In this case, the break is to the downside. Therefore, you could short the EUR/USD pair at the breakout, placing a stop loss order above the upper level of the pattern. Then you would hold the trade for a minimum price move equal to the size of the triangle.
On the way down the price action creates another triangle pattern – Expanding Triangle (blue). Since the triangle is inclined downwards, it has a bullish potential. Therefore, you could position to buy the EUR/USD when the price action breaks the pattern through the upper level, placing a stop loss order below its lowest point. Again, you would want to hold the trade for the price move equal to the size of the pattern measured by its widest part.
FX Strategy Using 2 SMA + Volume
If you prefer a more systematic type of approach, you can develop a strategy based on a combination of technical indicators. Most indicators are mathematical derivatives of price that can be programmed and automated to generate trading signals.
Some indicators are plotted directly on the price chart (Moving Averages, Bollinger Bands, and Parabolic SAR), while others are added to the bottom in a separate field below the chart (MACD, Stochastic, RSI, or Volume Indicator).
The example we will look at now combines three indicators – a 20-period Simple Moving Average, a 50-period Simple Moving Average, and a Volume Indicator. Since the 20-period SMA is faster than the 50-period SMA, we would use that as the trigger SMA. So, we will open trades when the 20 SMA crosses the 50 SMA. If the crossover is to the upside we will go long. Conversely, if the crossover is bearish, we will go short.
We will also add an important filter to weed out low probability trade signals. We will use the Volume indicator as our filter. So, we will only take signals that are created during recent high or increasing trading volumes.
We will place the stop at a relative distance near an important swing to protect our account from an adverse price move. And finally, we will hold the trade until the SMA crosses in the opposite direction.
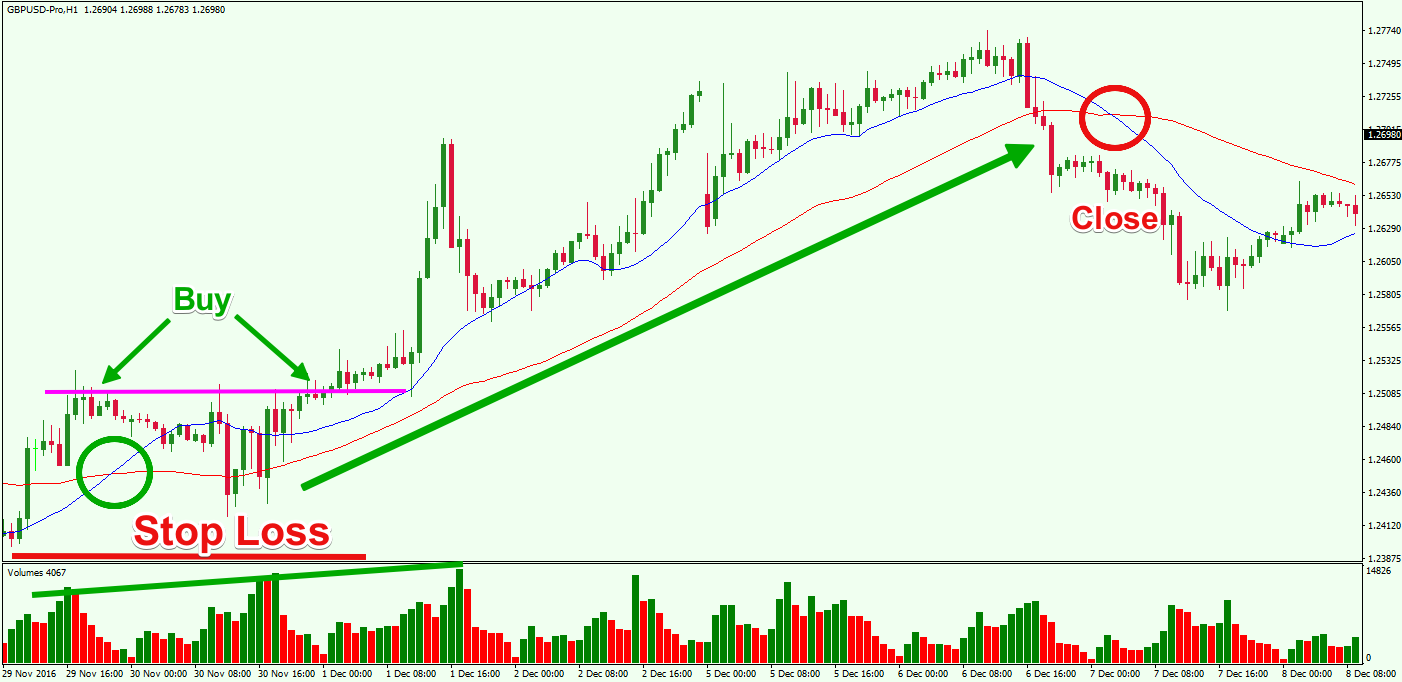
The example on the chart above takes place on the H1 chart of the GBP/USD Forex pair for November 2016. The blue curved line you see on the chart is the 20-period Simple Moving Average. The red curved line, which is smoother, is the 50-period SMA.
The chart starts with a bullish SMA crossover where the blue 20 SMA crosses the red 50 SMA in the bullish direction. This happens during a relatively high period of recent trading volumes. We place a stop loss order near a recent swing and at a reasonable distance below the entry point.
Price action initially fails to move in the bullish direction immediately, and price pulls back creating the magenta resistance line you see on the chart. Eventually price does breaks thru the resistance zone and begins to move higher.
A week later the price action starts to decrease and the two SMAs gradually start to converge. Then, the blue 20-period SMA crosses below the red 50-period SMA, which gives us an exit signal.
News Scalping Forex Strategy
The last trading strategy we will take a look at involves a fundamental analysis approach based on a scheduled economic news event.
Every morning you should pull up an economic calendar to find out what important news and events are scheduled for the trading day. This is especially important for news traders who are looking for potential volatility plays that may offer scalping opportunities.
News scalping is not for the faint of heart and timing and execution is of great importance with this type of trading. In addition, you should ensure that bid/ask spreads are not so wide that it would drastically limit the potential profit on the trade. You need to be extremely quick in opening your trades since the market reacts almost instantly. You should place a stop fairly liberally as knee jerk reactions in both directions are often common.
Now let’s take a look at an example of a news release scalp trade.
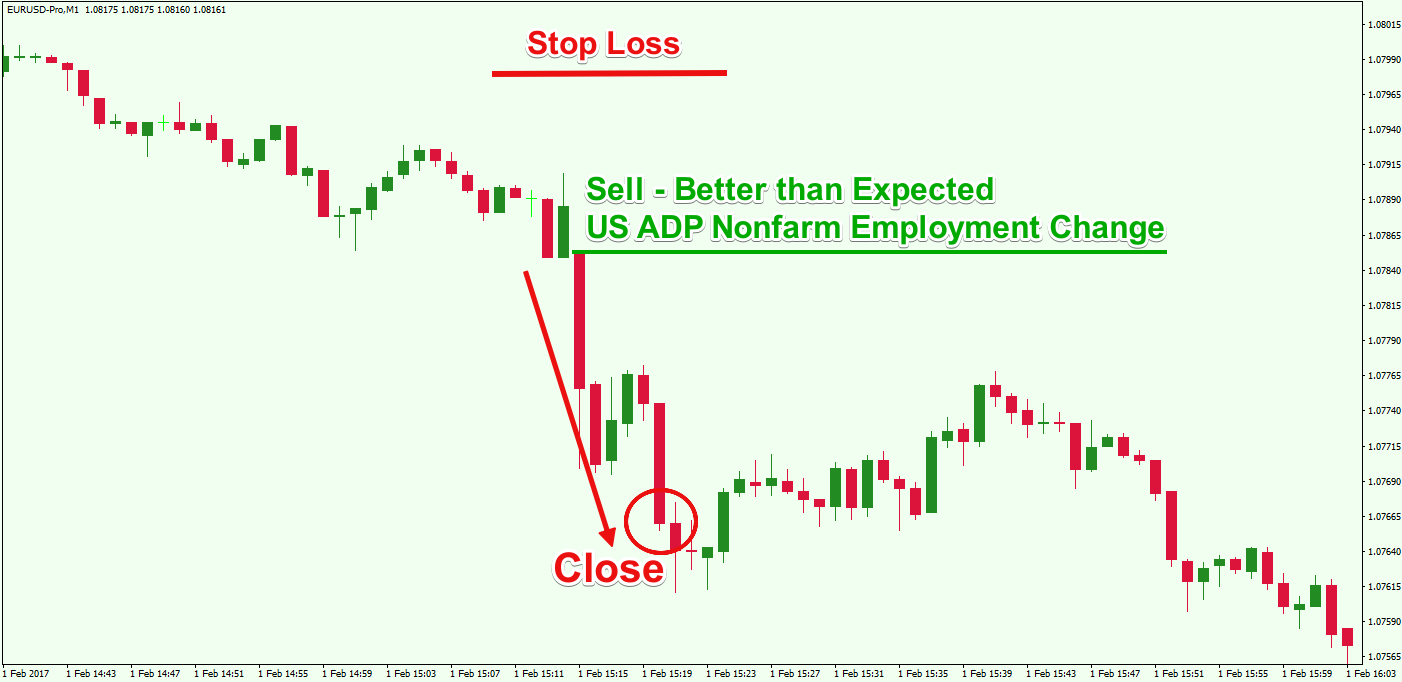
The example you see above takes place on the 1-minute chart of the EUR/USD chart. We will demonstrate how to scalp for a quick short-term price move resulting from an economic data report.
In this example case, we take the release of the US ADP Nonfarm Employment Change on February 1, 2016. The figure released is 246K, which is 81K more than the expectation of 165K. This means that the US ADP Nonfarm Employment Change is more optimistic than consensus estimates, and as a result, this is bullish for the Dollar and we should have at least a short term move down for the EURUSD pair.
We instantly short the EUR/USD on the print of this data, again, on the assumption that the US Dollar will increase versus its European counterpart as a result of an immediate reaction to the better than expected US data release. We short the EUR/USD and place a stop loss order at a relative distance from the entry point.
As you can see, the EUR/USD price drops quickly and sharply affected by the optimistic US data release. Keeping in mind that this is a scalp trade, we hold the trade around 5 minutes and then exit the market.
Note that if the data release was worse than expected (pessimistic), you would have bought the EUR/USD on the assumption that the USD will depreciate versus the EUR. In other words:
To short the EUR/USD based on economic data release, you either need positive data coming from the United States, or negative data coming from the Euro Zone. On the contrary, to buy the EUR/USD based on economic data print, you either need good economic data from the Euro-Zone in relation to expectations or bad data from the United States in relation to expectations.
It works the same way with other currency pairs and the respective economies they represent. This is a rather generalized explanation, but serves to illustrate the thinking and mindset when trading the news for short term reactions.
Conclusion
- There are two primary types of Forex trading approaches:
- Technical Analysis – Involves the use of trading tools like indicators, oscillators, candle patterns, chart patterns, trend lines, channels, support, and resistance levels.
- Fundamental Analysis – Involves the use of economic indicators and data releases.
- You should choose a forex trading strategy that is best suited to your own personality.
- You should keep in mind that technical and fundamental analysis are not mutually exclusive approaches. You can combine them into a cohesive trading strategy to gain benefits from both viewpoints.
- Three basic trading strategies we discussed are:
- Chart Pattern Trading: Using price action analysis to spot chart formations.
- 2 SMA + Volume Indicator: Dual SMA crossover supported by increasing trading volumes.
- News Scalping: Waiting for impactful news releases to take advantage of short term volatility expansions.