Chart pattern recognition is one of the most popular techniques to trading the forex market. There are many different types of chart formations that a trader can study and incorporate into their setup arsenal. Today we will go through one of the more reliable chart patterns within the pattern universe. What I am referring to is the classic Head and Shoulders Pattern.
Head and Shoulders Pattern in Forex
The Head and Shoulders pattern is a chart figure which has a reversal character. As you might image, the name of the formation comes from the visual characteristic of the pattern – it appears in the form of two shoulders and a head in between. The pattern starts with the creation of a top on the chart. The price action then creates a second top, which is higher than the first top. A third top is created afterwards, but it is lower than the second top and is approximately at the same level as the first top.
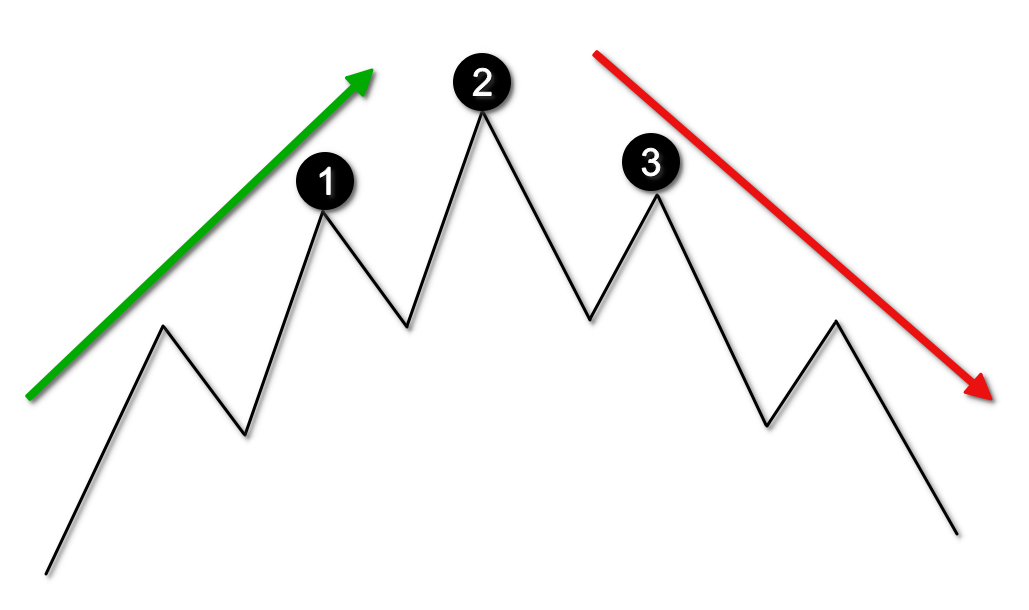
The image above is a sketch of the Head and Shoulders chart pattern. The tops at (1), (2), and (3) create the three important swing points of the pattern.
- Top (1) corresponds to the first shoulder of the pattern.
- Top (2) is the “head” of the pattern.
- Top (3) corresponds to the second shoulder of the pattern.
Notice in the sketch above, there is an initial bullish trend (green arrow). Then the left Shoulder is created, followed by the Head, and finally the right shoulder is completed. Often you will see a divergence pattern between the left shoulder and the Head.
Psychology of the H&S Technical Pattern
As I have mentioned, the Head and Shoulders formation is a reversal chart pattern. In this manner, the formation represents the loss of faith in the prevailing trend. The right shoulder on the chart which is lower than the head presents some important clues to the trader. The tops have been increasing initially until the creation of the third top (right shoulder). This decreasing top on the chart, represents the deceleration of the trend which is likely to lead to a trend reversal.
Head and Shoulders Pattern Rules
Let’s now discuss some trading rules surrounding the Head and Shoulders Pattern. After we go through these guidelines, you will be ready to start scanning for this pattern on your own price charts.
Drawing the Head and Shoulders Chart Pattern
The first important sign of an emerging Head and Shoulders reversal pattern comes from the bottom created after the head is formed. If you have and established trend on the chart, this bottom is likely to create a slowdown in the trend’s intensity. In many cases this bottom also creates a breakout from a bullish trend line.
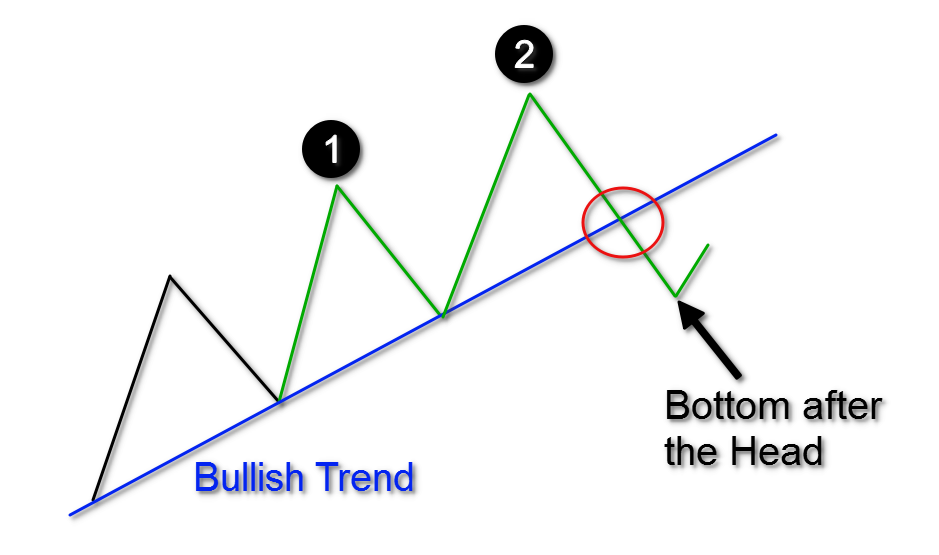
This is the first indication of a reversal potential and an emerging Head and Shoulders reversal pattern on the chart. We have two tops which are increasing and correspond to the bullish trend. However, the bottom created after the head formation, typically breaks the trend line and ends near the same level as the previous bottom. This indicates that the bullish momentum is slowing.
After the head is completed, followed by a bottom outside the trend line, we should anticipate the third top, which will be lower than the head. Sometimes, during the formation of the right shoulder, price may test the already broken trendline as a resistance.
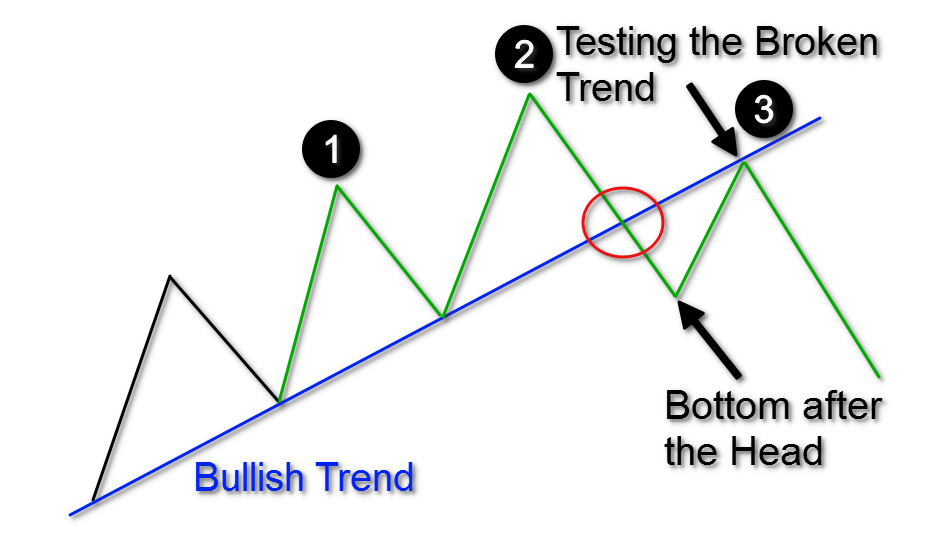
The creation of a third, lower top on the chart creates the H&S formation on the chart. However, this doesn’t mean that the pattern is confirmed. We will discuss how to confirm a valid Head and Shoulders pattern in the next section.
Head and Shoulders Neckline
The Head and Shoulders neckline is considered the most important component in trading the H&S pattern. The reason for this is that the H&S neckline acts as the trigger line for trading the pattern.
The neckline needs to be manually drawn on your chart. To draw the neckline, you need to locate two bottoms – the bottom just prior to the head formation, and the bottom just after the head formation. Then you should connect these two swing points with a line.
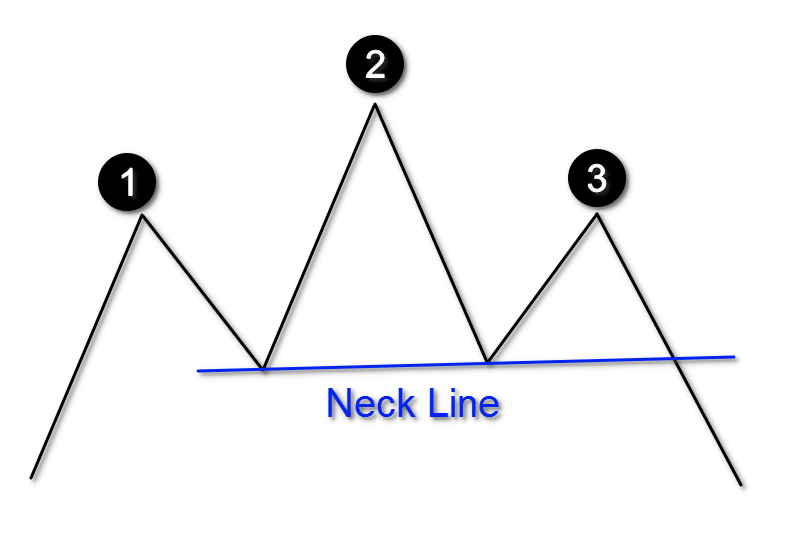 The sketch above shows you how a Head and Shoulder neckline should be built. It is important to note that this line could be horizontal, or it could be inclined if the H&S chart pattern is inclined itself. Also, it is possible for the neckline to be declined, but that is less common. Regardless, it makes no difference whether the pattern has a straight, inclined, or declined neckline, as long as the price action follows the Head and Shoulders pattern rules.
Head and Shoulders Breakout
The Head and Shoulders breakout is the signal we need in order to open a short trade. To get a valid H&S breakout, we need to see the price action breaking through the neck line of the pattern. It is when a candle closes below the neckline, that a short signal is triggered for the Head and Shoulders setup.
Head and Shoulders Stop Loss
The Head and Shoulders trade setup should be used in conjunction with a stop loss order. Obviously, the H&S pattern, like any other pattern, does not provide a 100% success rate, so we must protect our trading account in case price moves against us.
The optimal place for your stop loss order is above the second shoulder on the chart. This corresponds to top (3). When you short the Forex pair after a Head and Shoulders breakout signal, you place the stop above the 3rd top of the pattern.
Head and Shoulders Price Target
The next question we must ask ourselves is “How long should we stay in the Head and Shoulders trade?” The answer to this question is a two-step process:
Measuring the Size of the Head and Shoulders Pattern
The size of the Head and Shoulders structure holds a direct relationship with the potential target for the trade. Therefore, it is paramount to understand how to measure the size of the H&S pattern. To do so, you need to take the distance between the tip of the head and the neck line. This will yield the size of the head and shoulders pattern.
Applying the Size of the Head and Shoulders Pattern
Now that you have the size of your H&S pattern on the chart, you should apply this length downwards, starting from the initial breakout through the neck line. This is the price move you should expect when trading the Head and Shoulders setup. In other words, the expected price move after the H&S pattern equals to the size of the pattern. This is often referred to by chart technicians as a measured move. Take a look at the diagram below:
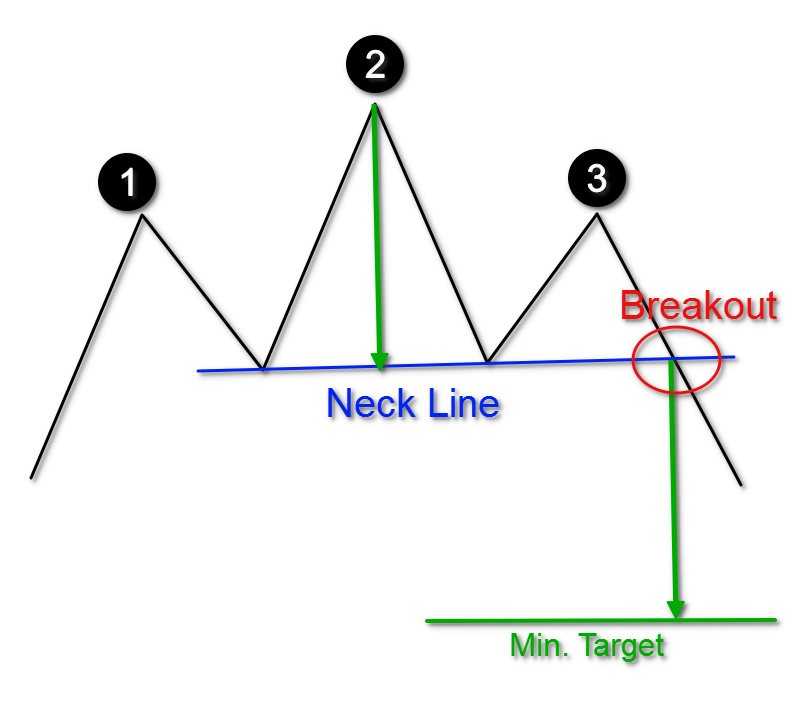 Notice that in this diagram, we have applied the target of the Head and Shoulders pattern. The size should match the distance between the head and the neck as shown on the image. After you measure the size, you simply add it downwards from the point of the breakout. When the price reaches the minimum target, it is an opportune time to close out the trade in full, or at least a sizable portion of it.
So, as an option you can keep a portion of your position open beyond the minimum target. After all, if the price is trending in your favor, you may want to see if you can catch a runner. If you want to extend the target on the chart, you can do this by using simple price action rules or a trailing stop. Be on the lookout for important support and resistance levels, as well as trend lines, price channels, or reversal candles and chart patterns. Each of these might help you to determine your exit point on the chart.
Inverted Head and Shoulders Pattern
The Head and Shoulders pattern has its bullish equivalent. This is the inverted Head and Shoulders pattern. Contrary to the H&S pattern, the inverse H&S pattern appears during a bearish trend and it implies that the existing bearish tendency is likely to be reversed.
This pattern looks the same as the standard Head and Shoulders, but inverted. And so, the inverted Head and Shoulders pattern formation concerns bottoms, and not tops. This is how the inverted Head and Shoulders figure appears:
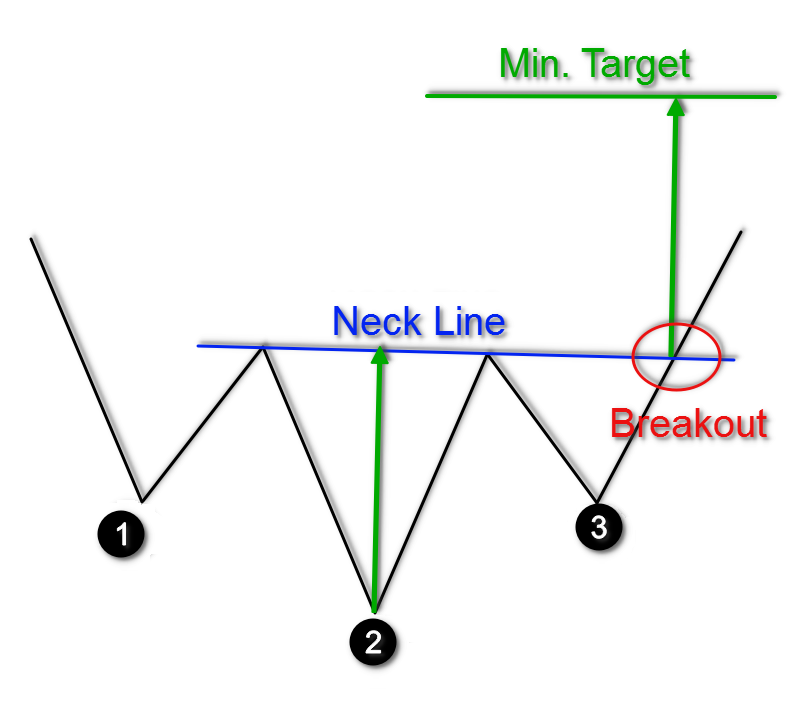
This sketch shows you that the inverse Head and Shoulders is an exact mirror replica of the Head and Shoulders pattern. Thus, the potential of the formation is reversed. The Head and Shoulders pattern has a bearish potential outlook, while the inverted Head and Shoulders has a bullish potential outlook.
Technical Analysis Using Head and Shoulders
Now that we have discussed both the bullish and the bearish versions of the Head and Shoulders reversal pattern, I will now show you a couple of H&S trading examples as part of a technical analysis approach.
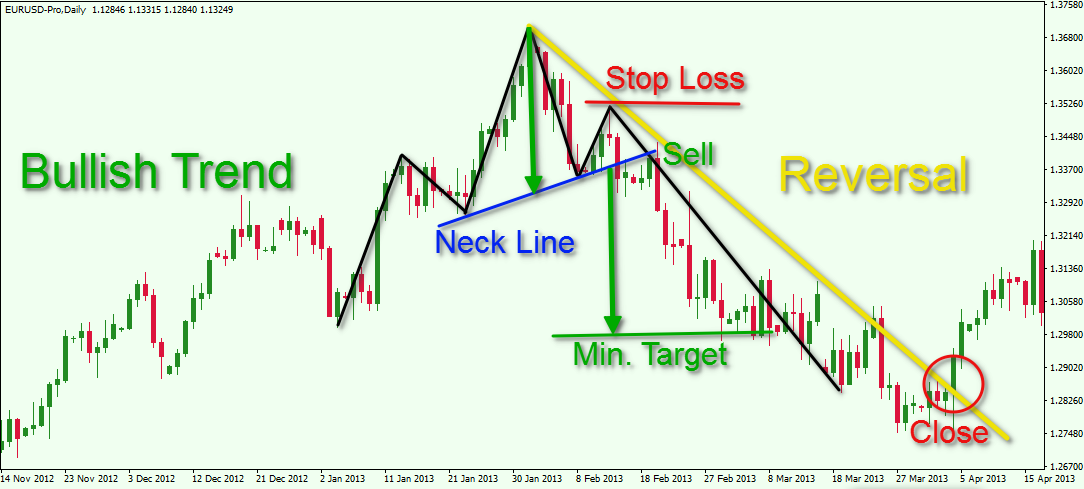
You are looking at the EUR/USD chart for Nov, 2012 – Apr, 2013. The image illustrates a Head and Shoulders trading example.
The chart starts with a bullish trend which lasts from November, 2012 to January, 2013. On the way up the price action creates a Head and Shoulders chart pattern. We have marked the figure with the black lines on the graph.
Since we have now identified the pattern, we will now draw in its neck line. This is the blue horizontal line on the chart. A short position could be opened in the EUR/USD when a candle closes below the blue neck line. Also, a stop loss order should be placed above the second shoulder of the pattern as shown on the image. The minimum target of the pattern is applied with the two green arrows. The minimum target equals the size of the pattern as we discussed earlier.
As you can see, the EUR/USD price enters a bearish trend after the pattern gets confirmed. Fourteen periods after the Head and Shoulders breakout, the price action completes the minimum potential of the pattern.
At this point you could either close out your entire position or decide to keep a portion of it open, to try to gain further momentum from the trade. If you decide to keep a small position open, you will want to take clues from the price action so that you can exit the remaining position in an informed manner.
The yellow bearish line on the chart is the trend line, which marks the bearish price action. The Head and Shoulders trade could be held as long as the price is located under the yellow trend. When the price closes a candle above the yellow trend line, the trade should be closed on the assumption that the bearish trend has been interrupted.
Let’s now turn our attention to another Head and Shoulders trading example:
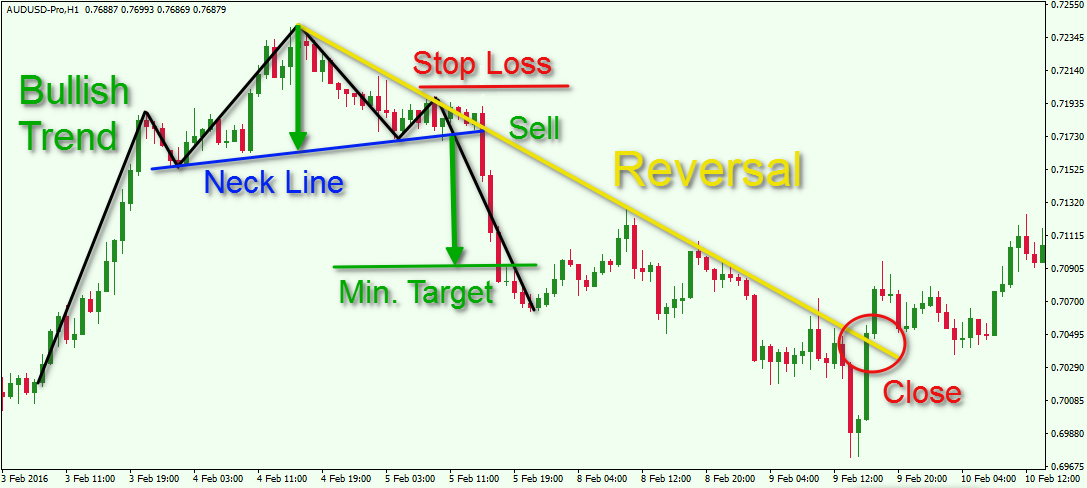
This is the H1 chart of the AUD/USD major currency pair for Feb 3 – Feb 10, 2016. The image shows another trading opportunity based on a Head and Shoulders chart pattern.
The H&S figure is illustrated with the black lines on the image. The blue line represents the neck line of the pattern, which goes through the two bottoms at the base of the head. The short trade should be opened when the price action breaches the blue neck line of the pattern. A stop loss should be placed above the second shoulder as shown on the image. Then the size of the pattern needs to be measured in order to attain the minimum potential price move. This is shown with the green arrows on the chart.
The price action enters a strong bearish trend after the short Head and Shoulders signal on the chart. I have outlined the bearish price move with a bearish trend line on the chart (yellow).
Although the price action completes the minimum target of the pattern in just three periods, the trade could be held further since the AUD/USD momentum was sharply downwards. This short Head and Shoulders trade could be held until the price action breaks the yellow bearish trend line in the bullish direction.
Inverted Head and Shoulders Trading Example
Let’s now look at a trading example of the Inverted Head and Shoulders setup. We will apply the same pattern rules we used for the Head and Shoulders pattern, but reversed.
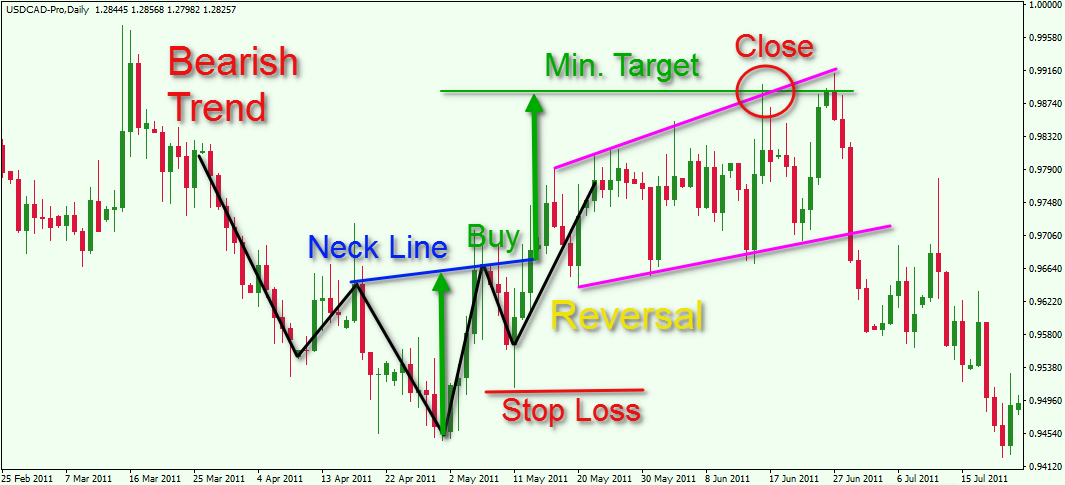
Here is the daily USD/CAD chart for Feb, 2011 – Jul, 2011. The black lines on the chart illustrate an inverted Head and Shoulders chart pattern.
Notice that the pattern comes after a bearish trend and reverses the price action. The blue line on the image is the neck line of the pattern. This time the neck connects tops and not bottoms, because the pattern is upside down. The USD/CAD pair could be bought when the price action closes a candle above the blue neck line. A stop loss should be placed under the second shoulder which forms the pattern.
Then you need to determine the size of the inverse Head and Shoulders pattern and to apply it upwards starting from the breakout through the neck line. This is illustrated by the green arrows on the chart.
The price starts increasing after the long signal on the chart. However, the price increase is not very sharp and it shows price hesitation. The pink lines on the image show that the price increase resembles a consolidation in the shape of a Rising Expanding Triangle. This type of triangle has a strong reversal potential. Therefore, the best option in this case would be to close the trade immediately upon reaching the minimum target of the inverted Head and Shoulders Pattern.
Conclusion
- The Head and Shoulders pattern is one of the most reliable chart patterns in Forex.
- It forms during a bullish trend and has the potential to reverse the uptrend.
- The name of the Head and Shoulders pattern comes from its visual structure – two tops with a higher top in between.
- The H&S pattern consists of three tops:
- The first top should be found in the context of a bullish trend.
- The second top should be higher than the first top.
- The third top should be lower than the second top and should be approximately on the same level as the first top.
- To trade the Head and Shoulders chart pattern you should apply the following rules:
- Identify a valid H&S pattern and draw each of the three tops that form the pattern.
- Apply a neck line through the two bottoms at the base of the head.
- Identify a Head and Shoulders breakout. Open a short trade when the price action breaks the neck line downwards.
- Put a stop loss above the second shoulder – the top prior the neck line breakout.
- Stay in the trade for a minimum price move equal to the size of the pattern – the distance between the tip of the head and the neck line.
- You can stay in you trade longer and use price action clues to exit, if you expect additional gains from your H&S trade.
- The Head and Shoulders chart pattern has its opposite equivalent – the inverse Head and Shoulders pattern.
- The inverted H&S pattern could be found during a bearish trend and it is expected to reverse the downtrend.
- The Inverse H&S pattern requires analyzing bottoms to confirm the formation.
- The neck line should go through the two tops that are immediately before and after the head formation.
- The stop loss order should be placed below the bottom, which corresponds to the second shoulder on the chart.
- Determine your price target using the Measured Move rule.