There are many different analysis tools in Forex trading. If you look at a chart template that some traders use, you might get easily confused by the many indicators plotted. Although Forex indicators can be helpful, basic trend analysis using simple tactics such as analyzing swing highs and lows can provide us crucial information on the existing trend of lack thereof. Trend analysis is an essential component of successful trading. In this lesson, we will go through the process of identifying and trading trends in Forex.
What is a Forex Trend (Tendency)
A trend or a tendency is a price behavior, which involves overall price increase or decrease. A currency pair is trending when it is increasing or decreasing for a longer period of time. There are two types of trend tendencies in Forex – a bullish and bearish trend.
Bullish Trend
We have a bearish trend when the price accounts for higher bottoms and higher tops on the chart. In this manner, the trend line during a bullish trend should connect the price bottoms on the chart. So the bullish trend line acts as a support. Following this tendency, in case of a new price interaction with a bullish trend line, we typically expect the price to bounce in a bullish direction.
Bearish Trend
Bearish trends have opposite functions to bullish trends. The trend is bearish when the price action creates lower tops and lower bottoms on the Forex chart. In this case the bearish trend line should be drawn through the swing tops on the chart and the resulting trendline acts as a resistance for the price. Following the bearish trend, in case of a new price interaction with the trend line, we expect the price to typically bounce in a bearish direction.
Forex Trend Line
There exists various trend indicators, however, one of the simplest and most effective ways to analyze trends is thru the use of trend lines.
A trend line is an on-chart diagonal line, which connects a number of tops or bottoms on the Forex graph. If the trend line manages to connect a number of price peaks, then we expect the price action to conform to this trend line. In this manner, we can say that the basic function of the trendline is to act as a support, or resistance for the price action.
The image below will show you a classical Forex price tendency with its respective trend line and eventual breakout.
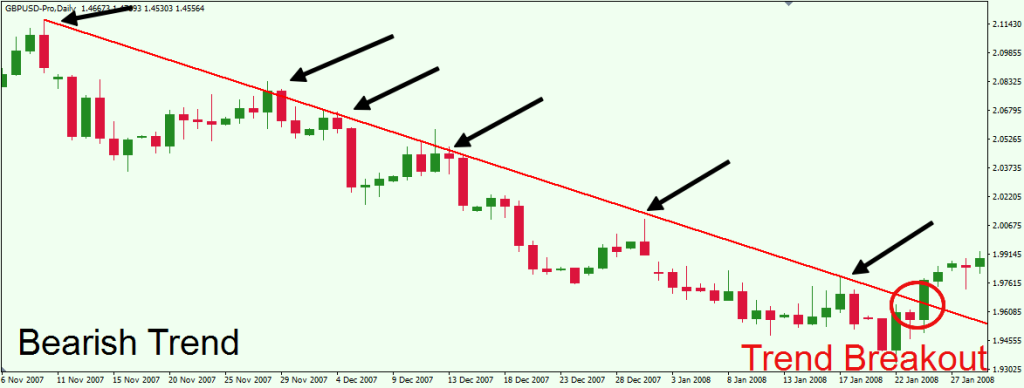
Above you see the daily chart of the GBP/USD Forex pair for November 2007 – January 2008. As you see, the Cable price accounts for lower bottoms and lower tops. This implies the presence of a bearish trend.
The red diagonal line is the bearish trend line, which contains the price action on the way down. The black arrows point out the places where the price tests the trend as a resistance. In this manner, we have a 6-times-touched bearish trend line. On the 7th interaction of the price with the bearish trend we get a bullish breakout through the down trend (red circle). The price closes a candle above the bearish trend line, implying that the trend is broken and the GBP/USD price direction is likely reversing.
Trend Following System
In a trending market, there are two types of systematic price moves which occur on the chart. They are related to the trend and they are important to your understanding of a trend trading system. These two types of price moves are called impulses and corrections.
Trend Impulse
The trend impulse is the price move which comes after the interaction with the trend line and after the price bounces in the direction of the trend. These are the types of moves that a trend trader pursues. The reason for this is that the trend impulses lead to bigger price moves for a relatively shorter period of time.
Trend Corrections
The corrective moves during trends in Forex come after the impulse and lead the price back to the trend. The correction moves on the chart are not as attractive for trading. Traders without sufficient trading experience should stay out of the market when the price is in a correction phase. The reason for this is that corrections are relatively smaller and often last longer than the trend impulses. Why take a position for less profit potential, and for more time risk in the markets? This is definitely a riskier initiative.
The image below will show you the basic mechanics of a trend with its respective price impulses and corrections:
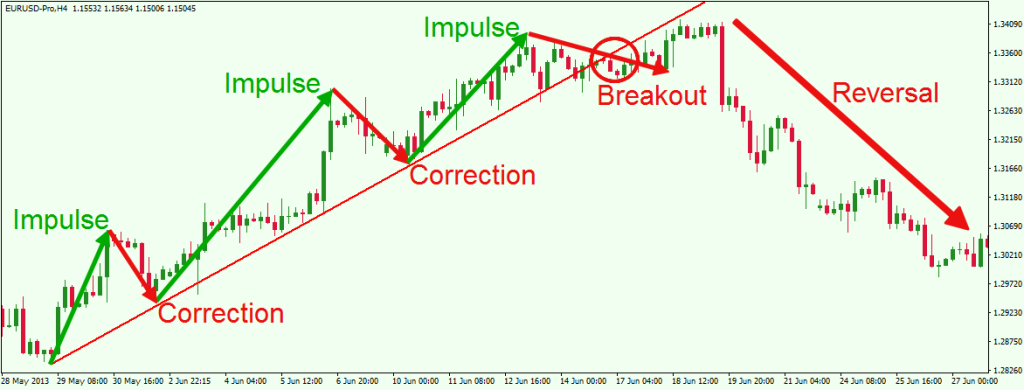 Above you see the 240 minute chart of the most traded Forex pair – EUR/USD. The period is May, 2013 – June, 2013.
As you see, the EUR/USD price on the image above records higher tops and higher bottoms, which suggests that there is a bullish trend on the chart. The red bullish line on the chart is the respective bullish trend line. The green arrows indicate the price impulses and the red arrows indicate the corrections of the trend.
Notice that the trend impulses lead to relatively bigger price moves in the direction of the trend. Contrary to that, the corrections are small. The third correction on the chart has approximately the same duration as the last impulse, and later leads to a breakout in the trend. At the same time, the price move it creates prior to the breakout can be described as a tight consolidation.
After the breakout the EUR/USD pulls back to the trend line to test it as a new resistance and subsequently rotates to a new bearish trend move.
Identifying Trending Forex Pairs
Before you prepare to trade a trending setup, you must first be able to recognize that a potential trend is underway. This is a basic component to any Forex trend trading system. Seasoned traders will tell you that “The trend is your friend!” for good reason, because the profits from a trending pair are bigger and the trades can involve less risk. So, now that we realize the benefits of trading a trending move we have to create some solid rules to pinpoint a potential trend trade setup. We will discuss a few trading techniques for spotting potential trends on the chart.
Swing Tops and Swing Bottoms
Yes, we repeat this again, because price swings are the basic characteristic of every trend on a chart. If the tops and bottoms are increasing, we have a bullish trend. If the tops and bottoms are decreasing, then we have a bearish trend. In all other cases, we have a non trending environment, – a sideways market.
The Third Interaction with the Trend Line (The 3rd Impulse)
Every two points on the chart could be connected with a straight line. However, if a third point lines on the same line, then we have a tendency. In this manner, the trend confirmation usually comes after the price tests the trend at the third touch, and bounces from it. When you see the bounce, you can enter an open a position attempting to catch a new trend leg.
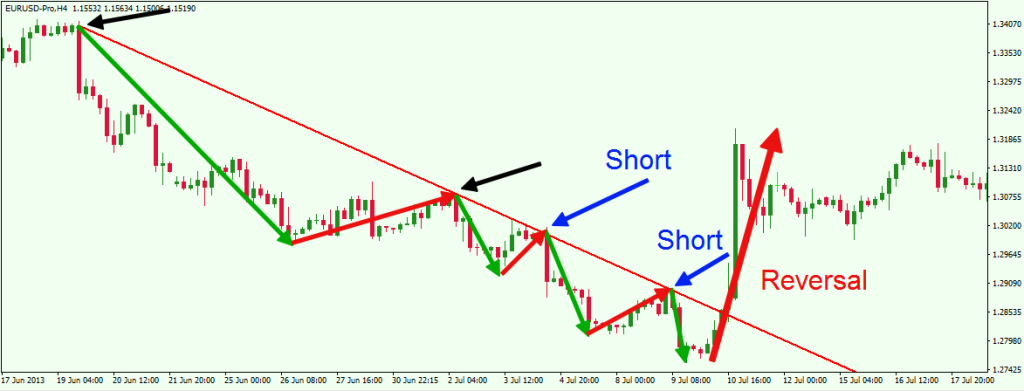 Let’s look at the EUR/USD example above. The arrows on the chart show the places where the price tests a bearish trend. The green arrows indicate the price impulses and the red arrows show the corrective moves.
The first two arrows pointing to tops on the trend are black. These are the first two points used to draw a trend line. Now we would sit tight, and wait for price interaction at the third touch. The third arrow on the trend is blue. You will notice a strong bearish response off the trend line. This would be considered our trend confirmation and prepare us for a short position. The fourth arrow is also blue, because the trend is already confirmed. In this manner, a return and a bounce from the trend would give us another trading opportunity.
The two short trades in this case both create a trading opportunity, though the 3 touch in general will typically provide a better return to risk ratio.
Trading Volumes
Volumes are helpful for identifying emerging trends. The reason for this is that in many cases the Forex pair will start trending after the volumes have increased. In this manner, the impulse trend moves appear during higher trading volumes. Corrections on the other hand appear during lower trading volumes. When volumes are high, there is a lot of action in the market. Therefore, high volumes are offer insights into emerging trend impulse waves. Let’s take a look at the Volume indicator on the chart below:
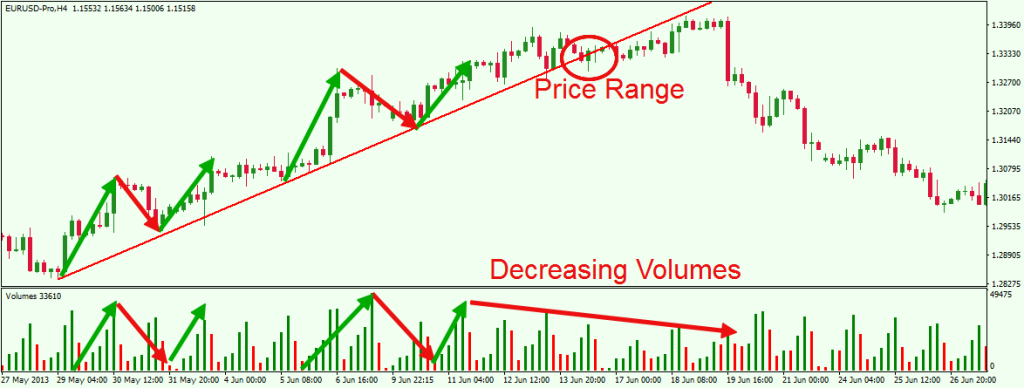 This is the same trend from the second example in this article. This time, you see a Volume indicator on the EUR/USD chart. Notice that the trading volumes pretty much respond to impulses and corrections as shown with the arrows above. At the same time, when the volumes start accounting for an overall decrease we see that the EUR/USD price enters a ranging phase, which leads to a breakout in the bullish trend. The trend reversal comes afterwards.
One caveat regarding Volume in Forex is that since there is no centralized exchange in the Forex Market, and thus no centralized source for Volume data, the volume readings are typically taken from your forex broker’s available data, and as such will not provide a complete picture of overall volume within the traded pair. However, using the Volume indicator with the understanding of this limitation in mind, can assist you in your trend analysis nevertheless.
How to Trade with the Trend?
Since you are now familiar with the process of identifying trends on the chart, it is now time to discuss a way to take advantage of trading currency trends. We will now exhibit a trend trading strategy, which is straight forward and relatively easy to implement.
We are going to use an assistant indicator to support our trend trading strategy. This will be the Moving Average Convergence Divergence (MACD) indicator. But before we dive into the actual strategy, let’s take a closer look at the MACD.
MACD Crossover
The MACD consists of two Moving Average based lines, which interact with each other above and below a 0 level. When the faster line breaks the slower line in bearish direction while being located above 0, we expect the price to start trending in bearish direction. When the faster line breaks the slower line in bullish direction, while being located below 0, we expect the price to start trending in bullish direction.
MACD Histogram
The MACD indicator also has a histogram. This histogram displays the exact difference between the faster and the slower line.
If the histogram is positive, then the faster line is above the slower line – long signal. If the histogram is negative, then the faster line is below the slower line – short signal.
MACD Divergence
The Moving Average Convergence Divergence is also good for spotting divergence between price and the indicator. If the price is increasing and the MACD is decreasing, then we have a bearish divergence, which indicates that the trend is likely to reverse.
The same is in force but in the opposite direction for a bullish divergence pattern. If the price is decreasing and the MACD is increasing, then we have a bullish divergence. In this manner, we expect the bearish trend to switch to bullish activity.
MACD Trend Trading Strategy
One way to trade trends is by combining Trend lines, MACD and the Volume indicator.
We can try to match signals from the MACD indicator and the potential emerging trend line and perform a volume analysis. Imagine you have an upward price movement on the chart. At the same time, the MACD signals a bullish crossover below the 0, supporting the price increase. In this case, we can look to go long until we see a contrary signal from the MACD.
A stop loss order should be placed here below the recent swing bottom.
The same technique is in force for bearish trends. If the price starts accounting for lower tops and lower bottoms, we use a bearish MACD crossover above the 0 in order to short a currency pair.
The image below will show you how exactly this trading strategy works.
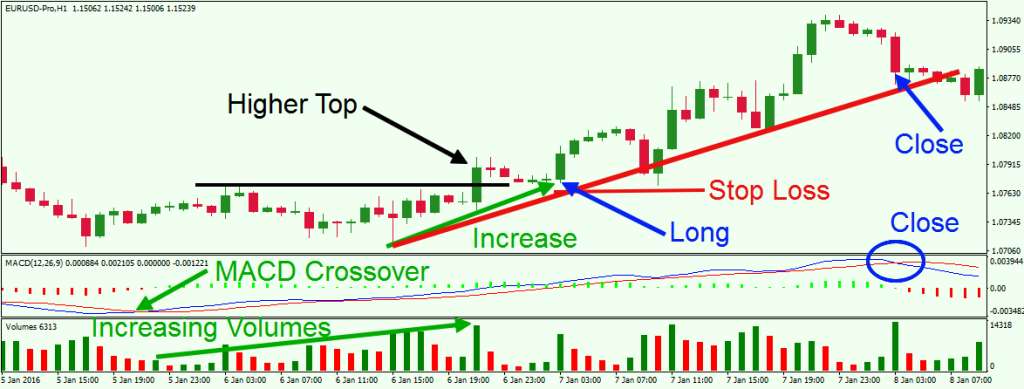 Above you see the H1 chart of the EUR/USD Forex pair. The date is Jan 5 – Jan 8, 2016.
This example starts with a bullish MACD crossover. Notice that at the time of the crossover and continuing afterwards, the EUR/USD price is ranging. However, during the horizontal move the EUR/USD trading volumes are consistently increasing. Suddenly, the price action creates a higher top, breaking the level of its previous top. This clues us in to a possible price increase, and after a short correction there is an opportunity for a long position on the chart. The stop loss order should be located right below the bottom, which should be used for the long position.
The price action continues with a new impulse on the chart. The following correction nearly hits the suggested stop loss placement. However, the price action doesn’t manage to decrease significantly below the previous bottom and the stop loss sustains the danger. The price continues with two more impulse moves and their adjoining corrections.
Notice that the MACD indicator is now located in its top area, indicating that we might see the end of this bullish trend soon. However, the trade should be held until the MACD lines signal a bearish crossover as stated in the trading strategy. The last correction on the chart is sharper than usual, which causes the two MACD lines to interact with each other. This acts as an exit signal for this trade and one should close the position for a profit. As an alternative to using the MACD crossover as the exit, you could have also considered waiting for the trend line break instead to close out the long position.
Conclusion
- Understanding price action trends in Forex helps keep trades on the right side of the market.
- Trends could be bearish or bullish:
- Bearish trends: They have lower tops and lower bottoms on the chart.
- Bullish trends: They have higher tops and higher bottoms on the chart.
- If a trend is not present on the chart, then we have a price range – a sideways price movement.
- Some ways to visualize a tendency on the chart is by using Swing High/Low Analysis, or the trend line indicator.
- The trend line is applied by simply connecting the tops, or the bottoms on the chart.
- When a Forex pair is trending it accounts for two types of movement:
- Trend Impulses: These are the moves in the direction of the trend. They are attractive for trading.
- Trend Corrections: These are the moves which lead the price back to the trend line. They are not as attractive for trading and it is not recommended to trade them if you are not an experienced trader.
- One way to confirm a trend is to identify the beginning of the third impulse related to the plotted trend line.
- Volumes are helpful for trend confirmation. Impulses usually happen during higher volumes, while corrections appear during lower volumes.
- One way to trade trends is by combining Trend lines, MACD and the Volume indicator.