When you trade Forex, you need to stack the odds in your favor. Forget about trying to be right 100% of the time. That just not possible or even practical. If you are trading with a good risk to reward ratio then you can be right on less than half your trades and still make very healthy returns. You have to know how to spot a nice opportunity, and be ready to execute your trade plan according. Some of these high probability trading opportunities are provided when trading breakouts in Forex. So in this lesson, I will discuss some of the advantages of trading Forex breakouts and go over a few breakout trading techniques.
What are Forex Breakouts?
We have a breakout when the price of a Forex pair overpowers and eventually breaks out of a specific psychological level. When you look at the price behavior on a chart, you will notice that the prices typically tend to move within and conform to specific levels.
When you see the price hitting a level and quickly reverse, we consider this as an important clue about the strength of the level. And so when price comes back to retest that level, we have to watch price action closely and anticipate a potential breakout or rejection trade setup.
Sometimes, you might see the price hitting the same level a few times. This means that the particular level may be stronger than usual. However the price will eventually break thru any contained levels at some point. This is when we have a breakout trading setup.
Why Trade Forex Breakouts?
Breakout trading setups in Forex can provide nice trading opportunities. The reason for this is that breakouts often lead to new price moves and trends. In this manner, traders attempt to enter the market right when a breakout occurs in order to get in early on a potential emerging trend.
In addition, many of the more reliable breakouts tend to occur on high momentum, and price action traders attempt to maximize their profit from the rapid price moves. Breakout trading is a simple and popular trading technique used by many Forex traders for good reason.
Where Do Breakouts Occur?
Breakouts occur on psychological price levels. These could be:
- Supports or Resistance
- Time Highs or Lows
- Trend Lines
- Price Channels
- Moving Averages
- Chart Pattern Levels
- Fibonacci Levels
- Pivot Points
- Round Numbers
One of the reasons, breakouts can move prices quickly, is that the levels around the potential breakout are being watched by many market participants and when one side is able to push thru, the other side has to quickly cover their losing positions, thereby creating sharp price movement after breakouts.
Spotting Breakouts
There are many different types of breakouts, including horizontal price breakouts, trend line breakouts, Fib level breakouts, Moving Average breakouts, and more. It is our job as traders, to find high probability breakout opportunities and execute the trade. But when trading breakouts in Forex, it is not always so clean cut. Typically support resistance lines drawn at potential breakout points should be considered as zones rather than fixed lines.
A breakout system requires the use of trader discretion to minimize false signals and fakeouts. For example, Let’s say the EUR/USD price is trending upwards. However, the bottoms of the price action cannot be connected with a single straight line. This doesn’t mean that the trend is not there. It actually means that the trend should not be considered as being contained by a single thin line.
Rather, on the contrary, the trend should be perceived as a zone. If the price does pierce thru and interrupt the upward sloping trend line, does this mean that the trend is over? Absolutely not! Sure we have to be cautious of a potential reversal, but keep in mind that price can and does pierce a trendline at times, without reversing price. The price will fluctuates dynamically and small breaches through levels are always possible. And this is in force not only for trendlines. This rule applies also to any other level. Therefore, we need to learn how to identify the real breakouts filter the fakeouts as much as possible.
Identifying the Psychological Areas
When you realize that the price is conforming to the same level over and over again, you identify that a psychological area is present. I take the lowest and the highest level of the price around that level and treat the distance between these two lines as a support/resistance area. Of course, if one of the candles on this level has a wick which goes far beyond the logical scope of the level, we disregard it as part of our psychological area. Let me show you an example of a breakout through a support area:
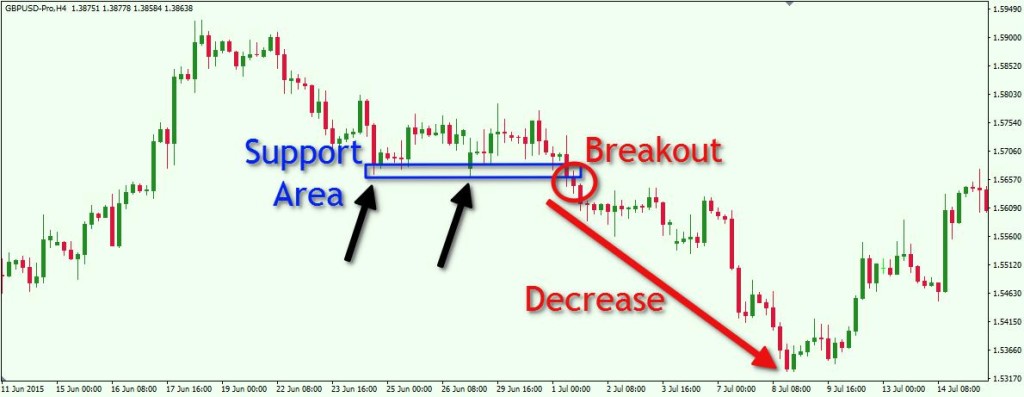
This is the 240 minute chart of GBP/USD for Jun 15 – Jul 16, 2015. As you see, after an uptrend, the price switches directions and starts a downward move. When a certain level is reached, the price starts moving sideways, creating a consolidation. Meanwhile, there are a couple of bottoms created. We use the blue rectangle to frame the area around the lower wicks of the candles, which creates our support area. When trading breakouts, it is best to wait for a candle close beyond the support / resistance area to confirm the breakout. On the above chart, when the price closes a candle below our support area, we identify this as a bearish breakout. After that, the price resumes its downtrend. Let’s have a look at another example
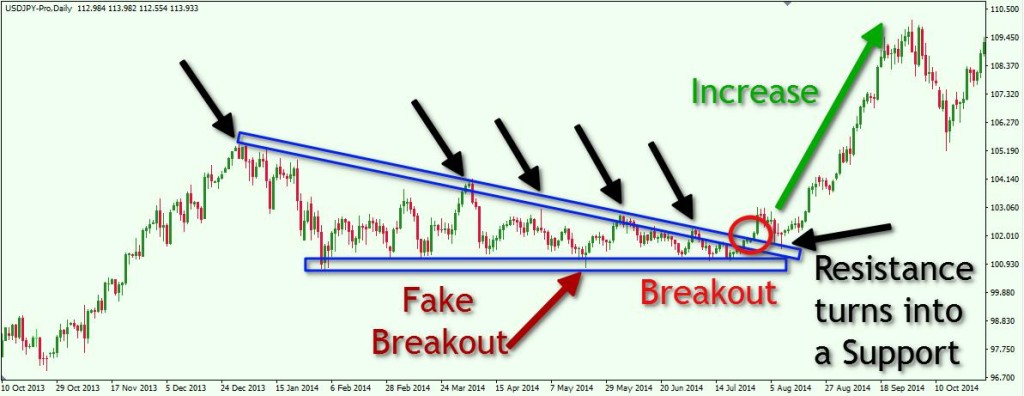
This is the Daily chart of the USD/JPY Forex pair for Oct 10, 2013 – Oct 10, 2014. Notice that the price has formed a Descending Triangle.
Descending Triangles are technical chart patterns that show price contraction, and this formation, like other contracting patterns, will eventually lead to a breakout and create a new price movement. The direction of the breakout is typically unknown. This means that the breakout from the pattern could send the price in either direction.
For this reason, we should carefully watch both the support and resistance levels for potential clues. Whenever we identify the likely breakout direction, we should react with a position in that respective direction. Notice in this example, that I have framed with rectangles the upper and the lower levels of the triangle. This way I know the exact areas which the support and the resistance of the triangle are likely to cover.
Notice that on the lower side of the triangle there is a candle wick which goes deep into the support area. If we had just a single line indicating our support, the wick might have lured us into thinking there was a bearish breakout.
In the red circle you see the exact location of the eventual breakout, which was to the upside. Notice the strong momentum on the breakout illustrated by multiple green marubozu candles. After the price breaks through the upper level of the triangle, it then retraces back in order to test the already broken resistance which is now considered a support area. This type of breakout pullback scenario is a very important confirmation signal in breakout trading, which we will discuss later in the article as well.
Separating Real Breakouts from False Breakouts
For me it is a general rule that a candle wick beyond a psychological area is not a breakout. I consider a real breakout to occur only in situations when the price of the pair closes the candle beyond the level. This way we get a more reliable breakout signal, one which can be used to trigger a position in the respective direction. Have a look at the image below:
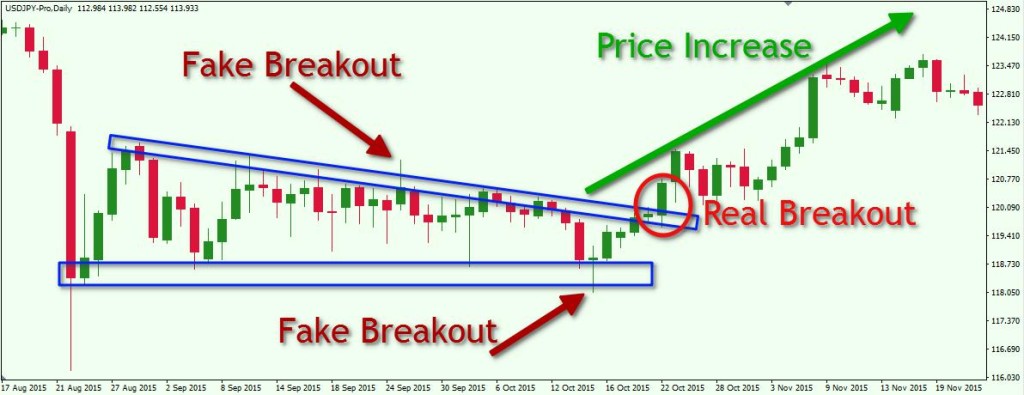
This is the Daily chart of the USD/JPY four Aug 17, 2015, Nov 19, 2015. Again, we have a descending triangle with an upper resistance area and a lower support area. I have marked these with the blue rectangles. Notice the way the rectangles contain the bottoms of the price. The lower rectangle is located according to the first and the second bottom of the triangle.
The upper rectangle contains all the tops of the price, except one candle which is pin bar style rejection candle. This is our first fake breakout. We have only a candlewick going above the resistance area. However the candle does not close with its full body above the resistance area. For this reason we disregard this breakout signal and we would classify it as a false breakout.
We get a second fake breakout afterwards. The last bottom of the price goes below the support area with its candle wick. The candle is also a Pin Bar formation, also called a hammer pattern, and bounces strongly off the support zone. Again, since we have no candle closing below the support area, we would disregard this as a breakout signal.
The Pin Bar subsequently pushes prices higher and five periods later we have a candle closing above the resistance area. This is our valid breakout signal. Notice that the breakout candle is a strong Marabozu candle, which further confirms that this would be a reliable breakout signal.
As a result of that, the USD/JPY price moves about 308 pips higher.
4 Steps for Confirming Forex Breakouts
Actually, it is not enough only to see the price breaking through a certain level in order to take a position in the respective direction. Though you can certainly initiate a trade after the initial candle close beyond the breakout point, there are better entry techniques in my opinion. They do require more patience on the part of the trader, and do not always materialize. But keep in mind, we are looking to trade the highest probability breakout trades, and not just every setup that comes around.
Therefore, I have prepared 4 steps for you, which will confirm a breakout and we will set certain rules for triggering a breakout trading position. The following example illustrates a bullish breakout:
Stage 1 : A breakout appears as in the examples above
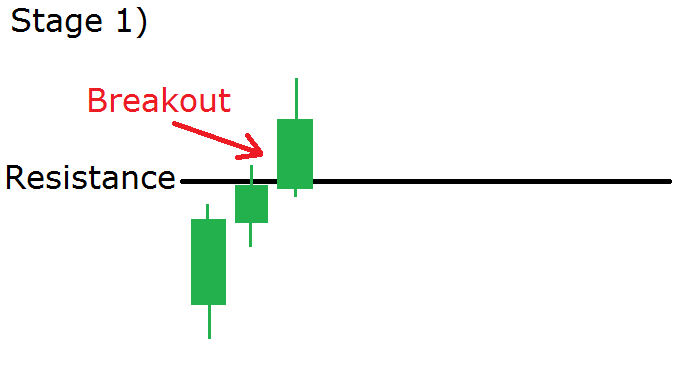
We observe price increasing and eventually goes through a psychological resistance. The price closes a candle above the resistance and we identify the breakout.
Stage 2: The price creates a top after the breakout.
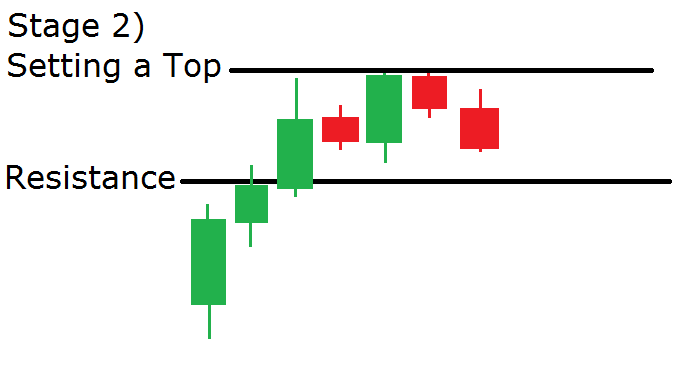
In this example, the increase continues for two more periods, and then starts to move downward. This creates the top we need. Typically the top we are looking for will be a fractal formation, meaning that the highest high will have two bars to the left of it with lower highs and 2 bars to the right of with lower highs. The reverse would apply for a bottom.
Stage 3: The price retraces back to the already broken resistance and tests it as a support.
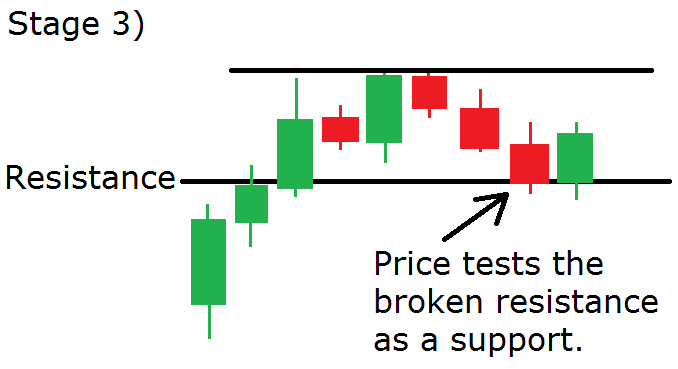
The decrease continues and the price tests the already broken resistance as a support. When the price touches the broken resistance, it bounces upwards, implying that this is now a strong support area.
Stage 4: The top after the breakout gets broken.
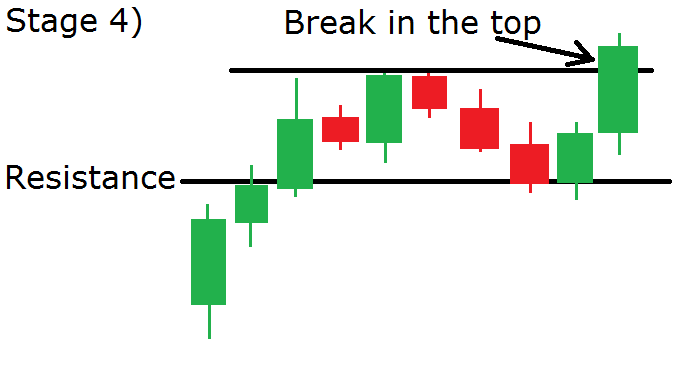
After we see a candle closing above the top, which was settled after the breakout, we have a strong confirmation that the price might really continue in this direction. Such situations are extremely useful to trade.
You could apply this 4 step breakout signal confirmation in order to trade range consolidations. These are situations, where you have a breakout in a chart pattern for example and you expect the price to move equal to the the size of the formation.
Finding a Good Breakout Indicator
If you are not confident in reading pure price action as it relates to breakouts, then you could consider using an additional trading indicator to help. One powerful indicator that a trader could utilize for a breakout trading system is the Momentum Indicator.
The Momentum Indicator consists of an area and a curved line which fluctuates in the area of the indicator. When the Momentum is moving upwards, it gives us a signal that the price is likely to follow this trend. If the Momentum is moving downwards, this hints that the price is likely to decrease too. Also, extremely high readings in the Momentum Indicator suggest that the uptrend is likely to continue. At the same time, extremely low readings in the Momentum Indicator are inferring that the current bearish trend is likely to expand.
I believe the optimal way to use the Momentum Indicator is for spotting divergences. We have a bullish divergence when the price is moving downwards and the Momentum Indicator is increasing. At the same time, we have a bearish divergence when the price is increasing and the Momentum Indicator is decreasing. The divergence is a good indication that the price is likely to reverse soon.
Have a look at how the Momentum Indicator works with a breakout trading strategy:
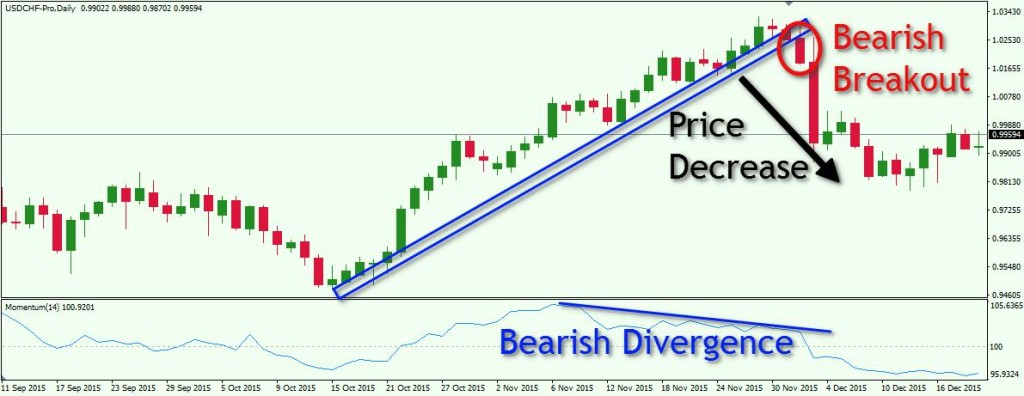
This is the Daily chart of the USD/CHF Forex pair for Sep 11 – Dec 16, 2015. At the bottom of the chart you see the Momentum Indicator with a 100 level on it.
As you see, the price is moving along with a steady bullish trend. Suddenly, the Momentum Indicator starts recording lower tops as prices continue to increase. This means that we have a bearish divergence between the price and the Momentum Indicator. This gives us a signal for an upcoming bearish move. As you see, the price closes a candle below the trendline zone and the next day, we see a sharp price drop followed by a second bearish wave.
Take Profit when Trading Breakouts
Within your breakout trading plan, it is essential to know and define when to exit the market. Since we discussed how to enter the market when trading breakouts we should now discuss how to take profits.
Many price action traders rely on simple but effective price action techniques in order to exit the market after a breakout price run by using swing high low analysis, and candlestick pattern recognition. However you also have other alternatives. One classical ways to take profits when trading breakouts is to include a moving average on the chart. When you enter a trade on a breakout, you could stay with your position until the price closes a candle beyond the moving average.
Have a look at the image below in order to see how a Moving Average exit works:
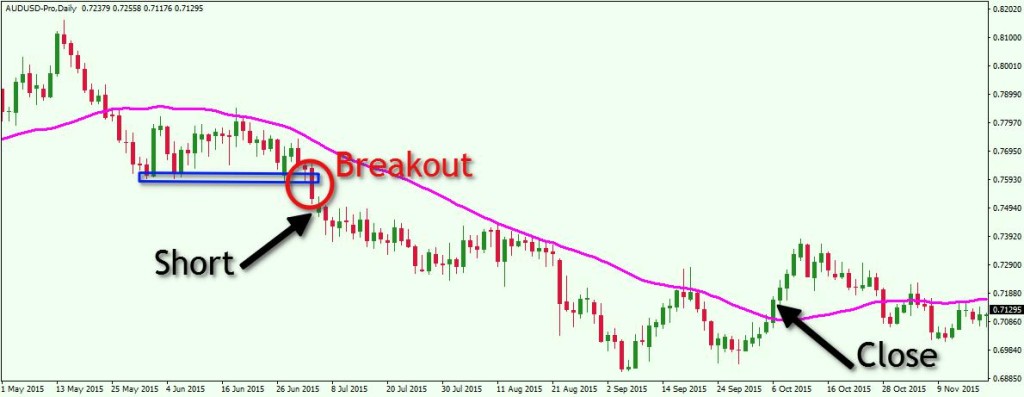
This is the Daily chart of the AUD/USD currency pair for the period May 8 – Aug 12, 2015. The pink curved line is a 34-period Simple Moving Average. There is nothing magic about the 34 period moving average, but I find that this setting provides for a robust exit strategy during most trending market conditions. I also favor it due to the fact that 34 is a Fibonacci number.
The blue rectangle shows a 3-times tested support area for the price. In the red circle you see the candle that breaks through and closes beyond the support area. We could use this breakout signal to go short. The price starts moving in bearish direction afterwards. Notice that many times the price attempts to break the 34-period SMA in a bullish direction. However, this Simple Moving Average contains the price in a relatively efficient manner, keeping us in this profitable trade for a longer period of time.
On October 6, 2015 the AUD/USD price closes a candle above the 34 period simple moving average, which gives an exit signal. In this trade of the AUD/USD, one could have made a profit equal to 338 pips using this combined entry and exit technique.
Conclusion
- A breakout trading method is an effective way to enter the market in the beginning of an emerging price move.
- We have a valid breakout when the price breaks and closes beyond a psychological level on the chart
- A psychological level should not be marked with a single thin line. We should perceive psychological levels as zones rather than an exact area marked by a fixed line.
- We have a breakout whenever the price closes a candle beyond that psychological area.
- If you want to get an additional confirmation you can use these 4 simple steps to identify real breakouts:
- The price closes a candle beyond a psychological level.
- The price creates a top (or bottom if the breakout is bearish) after the break.
- The price returns to test the already broken resistance as a support (or the opposite if it is a bearish breakout).
- The price bounces and breaks the already created top (or bottom if the breakout is bearish).
- If your price action rules are not sufficient for you to confirm a breakout, you can always use an additional trading indicator. A good indicator for confirming breakouts is the Momentum Indicator.
- In order to exit the market after a breakout trade you can use price action techniques, or another trading indicator. The moving average is an effective indicator to use for taking profits when trading breakouts.