One of the most crucial skills in Forex Trading is the process of finding support and resistance levels. This is so because knowing the basics of support and resistance would improve upon any trading method. Therefore, recognizing key levels is crucial to the success of any trader. In this article I will teach you how to identify these key levels and how to benefit from them. But first…
What is Support and Resistance?
Support and resistance are specific levels or zones on the trading chart, where the price of a Forex pair (or equity, commodity, etc.) is likely to find opposition. The reason for this is that these are psychological levels showing the different attitudes of the market players.
When price meets such levels it could lead to a bounce in the opposite direction of the trend or to consolidations (horizontal movement of the price). Also, the level could be broken and the price could make a rapid move.
Support and resistance areas are the zones where the interests of the market players intersect. Imagine a simple “Tug of War” game, where two teams are pulling a rope over a mud puddle. The weaker ones lose and end up in the mud puddle.
In our case these are the bulls and the bears fighting for dominance in the market. Some of them believe that the Forex pair will go up and some of them believe that it will go down. Therefore, we have a clash between buyers and sellers. The ones who prevail will push the Forex pair in their respective direction. Support and Resistance is essential to any price action trading strategy.
What is the difference between a support and a resistance?
The answer to this question is very simple. Supports are the levels which are beneath the current price, while resistances are the levels above. Furthermore, when price goes down through a support level and breaks it, this level becomes a new resistance and vice versa. In other words, when breaking the level in a bearish direction, price relocates under that level and the old support levels now becomes a new area of resistance. Have a look at the image below:
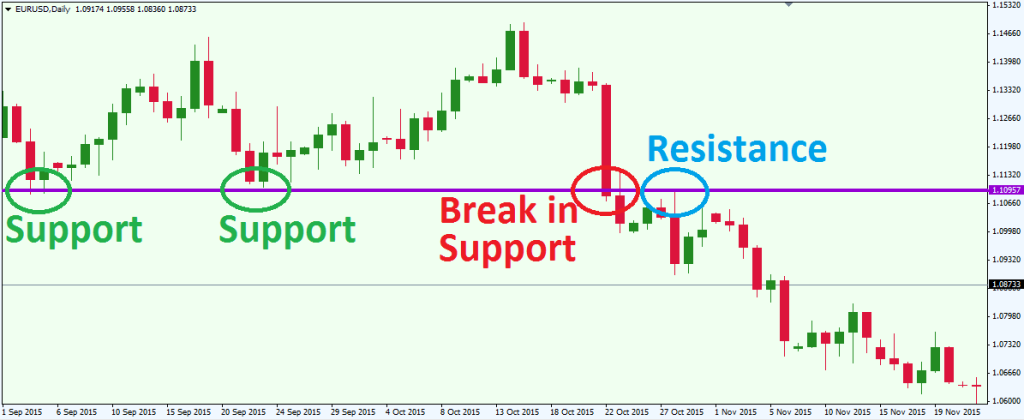
This is the daily chart of the most traded Forex pair – EUR/USD. The chart covers the time frame Sep. 1 – Nov. 19, 2015. The green circles show the places where the price gets supported by the purple 1.10957 level, the red circle shows the moment when the price breaks this level in bearish direction and the blue circle shows how the price tests the level as a new resistance.
This example shows how a support could turn into a resistance and how it could start acting as a level with opposite force.
How to find support and resistance levels?
For the most part, support and resistance levels are very easy to find on the Forex charts. Every bottom on the chart is a potential support and every top is a potential resistance. Notice that I call these potential and not actual. A potential support turns into an actual support, when the price conforms to its level more than once.
If we see the price dropping to a level and then going back up, we consider this area as an eventual point, where next time the market gets to that level, it might find opposition. If we see the price bouncing again from this level, then we confirm the level as a support. Then we assume that the price is likely to bounce off this support again in case of another drop. The same applies for resistance levels.
Not all support and resistance zones are created equal. We are only interested in trading valid supports and resistances as measured by their authenticity and potential. There are weak supports and reliable supports. There are weak resistances and reliable resistances.
As you probably guess, traders tend to stick with the more reliable levels, as they are more likely to point to a successful entry and exit point. The more reliable support and resistance levels are the ones, which are older and have generally been tested more times. The picture below compares two levels – a stronger resistance versus a weaker support:
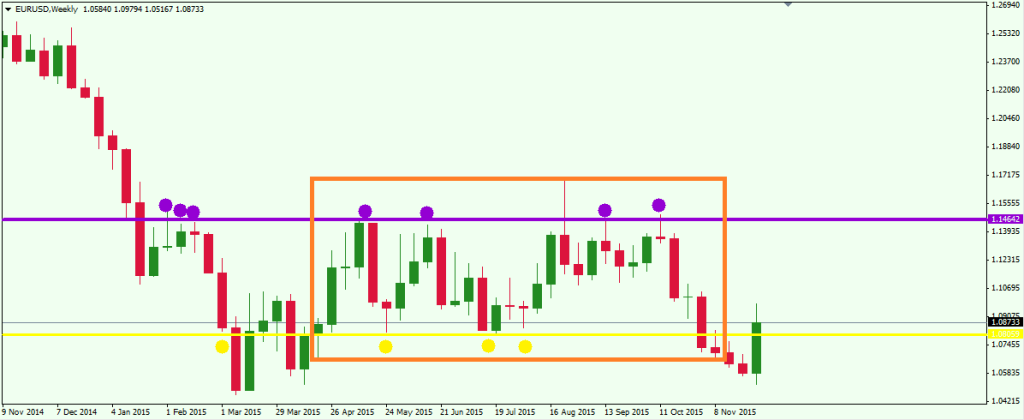
Let’s take a look again at the EUR/USD Forex pair but this time on a weekly chart. The image shows the move of the price between Nov. 2014 and Nov. 2015. The purple line is a 7-times tested resistance of the price, while the yellow line is a 4-times tested support. The circles point the exact place where the levels were tested. Since the purple level is older and has been tested multiple times, it is the stronger level. The orange rectangle shows the area where the two levels are consolidating, and bouncing back and forth in an attempt to breakout of the range.
We can expect one of the two levels to be broken. Since the purple resistance is older and has sustained the price longer than the yellow support, I would prefer to take a market position in bearish direction, because I assume that the yellow support will bend under the pressure of the purple resistance. Actually, this is exactly what happens in the end of the orange rectangle. The price gets through the yellow support, which from now on should be called resistance as prices fall below the prior support level.
How to set entry/exit points at support and resistance levels?
As we have discussed, support and resistance levels are used to place entry and exit points on the chart. If you learn how to operate with S/R entry and exit points, you will set the ground basics of your Forex trading knowledge. S/R entry and exit points are not just a newbie lesson!
These are the essentials of any Forex trading strategy, which every trader should know how to use! The reason for this is simple – no matter the strategy you use and the tools you apply, the price of every Forex pair constantly approaches different support and resistance lines, and so we must keep a watchful eye on price action surrounding these levels.
1) Setting entry points on S/R levels
Imagine the price of a Forex pair approaches an established support zone. Since the support is old and many times tested, I assume that this support level is reliable. For this reason I could try to enter the market and set an entry point after the price touches this support level. The right way to do this is to wait for the price to interact with the level first.
When this happens, I enter the market with a long position only if the price bounces in bullish direction from this level. If you go long on your support level, the most logical place to put your stop loss would be below the support area. You place your stop right beneath your support. Doing so will limit your loss in case the bounce is a fake and the support gets broken in bearish direction after all. Take a look at the example below:
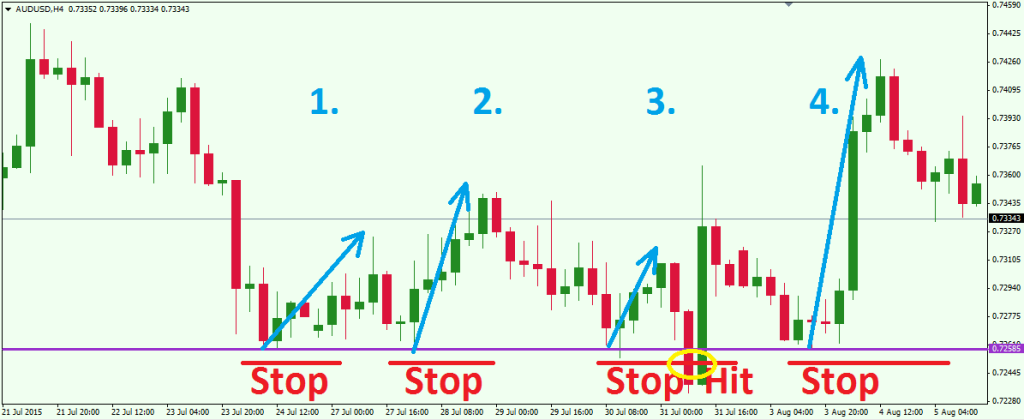
This is a H4 chart of the AUD/USD showing the move of the price between Jul 21 and Aug 5, 2015. The purple line is an old support level, which I consider reliable and good for setting entry points. The image stages four cases to enter the market on this support level. The blue arrows show the ascending move we get after the price interacts with the purple support.
Notice case 3 where after a short increase, the price does a rapid drop and hits our stop loss order. This is why it is paramount to always use a stop loss when trading. So, this support level gave us three good long positions and one bad, which equals to 3:1 success rate. Note that setting entry points on resistance levels works the absolute same way as setting entry points on support levels, but in the opposite direction.
2) Setting exit points on S/R levels
In order to set an exit point on a support or resistance level, you should already be in the market with a position. For this reason, imagine you have bought a Forex pair and the price moves in bullish direction according to your view. Suddenly, you see an established resistance area along the uptrend and you think: “The price might bounce in bearish direction from this old resistance and I might lose a big part of my profit! I should secure myself!” Therefore, you set an exit point on this particular resistance level. The image below will make this clear for you.
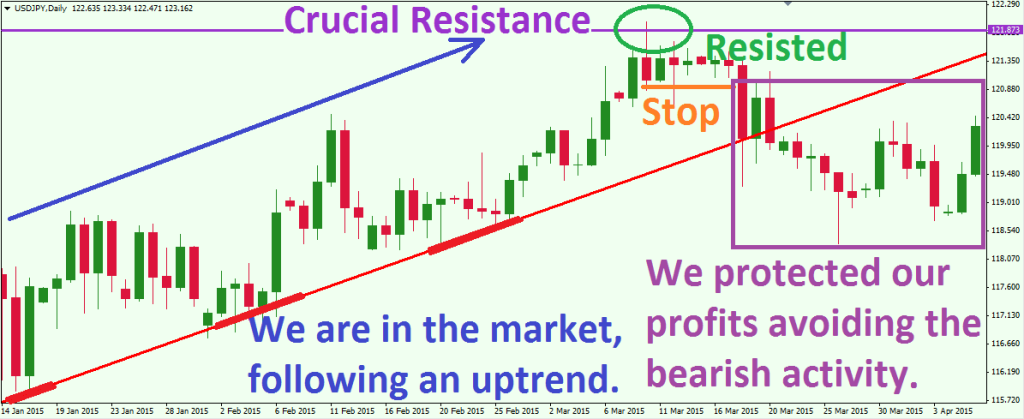
This is the daily chart of the USD/JPY Forex pair for the period between Jan 14, 2015 and Apr 3, 2015. I am in a long position after the red bullish trend line. The thicker parts of the trend show where the price finds support. While I am in my long position, I see the price getting close to an old resistance, which has already been tested few times and has sustained the price of the Yen. Therefore, it is a good approach to secure my position with an exit point below this resistance in order to avoid loss of already gained profit. Whenever the price touches the resistance, a stop loss could be placed below the candle, which has touched the level. On the image above this is the small orange line. If the price breaks the resistance in bullish direction, then I can reopen my position. But if the price does a rapid drop, I am protected with a stop loss order like in the example above. The stop loss covered us for the rapid decrease, which even got the price out of the red bullish trend.
But what if the price bounces from the resistance but then bounces up again from the red trend? In this case, if I see the price bouncing up, I go long and play again the resistance game with the stop loss. Note that in my example, the quick drop brought a bearish candle far below the trend, which infers the end of the bulls. Therefore, the exit point beneath the purple resistance saved me from an unwanted loss of profit. This same scenario could be played with an exit point on a support level, but in the opposite direction.
How to trade support and resistance?
For some newer traders, trading support and resistance using an additional Forex tool on your chart for confirmation can sometimes prove helpful. The reason for this is that support and resistance trading can give us false signals from time to time. For this reason some price action forex traders tend to confirm the signals they get with additional trading tools like candle patterns, chart patterns, oscillators, momentums, etc.
One of the most common ways to trade key levels is simply by trying to go with the market flow after the price has shown its bias toward a support or a resistance level.
Buy when the price approaches a support and starts bouncing in bullish direction and sell when the price touches a resistance and starts bouncing in bearish direction. Also, buy when the price breaks resistance and sell when the price breaks support.
For example, the price touches a resistance and bounces in bearish direction. The first candle, which closes lower than the prior candles could be used as a trigger of a short position. At the same time, I stay in the market until the price reaches the next important support zone and closes a candle above the previous one. If this happens I close my short position. At the same time, this gives me a signal to open the opposite position. For this reason, I could go long and do the same but in the opposite direction.
I am providing a basic illustration for our purposes here, but in reality, it is not quite as clean cut as we would like at times. You might find it useful to combine support and resistance with some other confirmation tools to help in your trading decisions. In this next example, I will show you how to trade S/R levels with the help of the well known Momentum Indicator.
The Momentum Indicator consists of a curved line, which bounces around a 100 or a 0.00 level depending on the different configurations of the indicator. The Momentum compares the current state of the price to its previous behavior certain periods ago, creating the curved line. The basic signal which the Momentum gives is with crossing the 100-level line in bearish or bullish direction, giving short or long signals respectively.
For this reason it is a good tool to verify signals and it will suit our S/R trading strategy. I will open a position whenever the price reacts to an S/R level, only if this behavior is confirmed by the Momentum Indicator. At the same time, I will exit the market only if the Momentum Indicator starts behaving the opposite way. Take a look at the picture below.
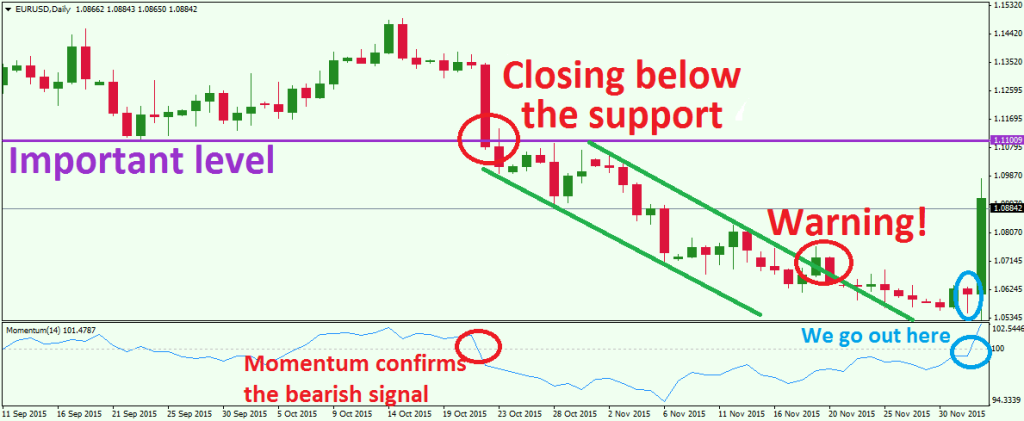
This is the daily chart of EUR/USD between Sep 16, 2015 and Dec 4, 2015. The purple line is an important level, which in our example is acting as a support. This level has been tested as a support and resistance more than 5 times during the last year. Therefore, I consider this a key level and I try to trade it! As you see on the image, during the last meeting of the price with the purple support, the bearish candle closes a bit below the level.
Meanwhile, the Momentum breaks the 100-level in bearish direction, which gives me the second signal I need and triggers my short position. I go short after the steady bearish trend marked with the green corridor on the chart. Little by little, the bearish trend starts slowing down and I get a “Warning!” signal when the trend gets broken in bullish direction.
Even though, I stay in the market until I get a bullish signal from the Momentum Indicator. This happens in the blue circles when the Momentum breaks its 100-level in bullish direction and gives me a bullish signal. This is my exit point and I go out of the market. The short position brought me a profit of nearly 450 bearish pips for a period of 6 weeks.
Conclusion
- Support and resistance are chart zones, which mark psychological trading levels.
- S/R trading levels are used to set entry and exit points on the chart.
- Support is a level below the current price. Resistance is a level above the current price.
- Any bottom could be a support and any top could be a resistance.
- The more the level is tested, the more reliable it is.
- Support and resistance trading could be used in a combination with additional trading tools, like the Momentum Indicator, in order to isolate as many false signals as possible.
- Support and resistance levels are essential for any Forex trading strategy.