High probability trading requires a certain level of skillset and mindset. The trader must have the proper technical or fundamental tools for market forecasting, along with the right mental perspective when interacting in the financial markets. Both are important in achieving consistent trading results. In this lesson, we will discuss what high probability trading entails and how we can gain an edge from our market analysis.
What is High Probability Trading?
When traders speak about high probability trading techniques, they are referring to specific techniques and strategies that can be employed to achieve a solid edge in the market. An edge is simply a statistically significant trade expectancy that when applied over a series of trades will yield positive results.
Some traders find this edge through technical analysis, while others find it through fundamental analysis. Additionally there are a group of traders known as high-frequency traders that rely on speed of execution as their primary edge. Each trader must evaluate their own personal skill sets, and find their own trading edge, if they are to achieve long-term success in the market.
While fundamental analysis can provide some valuable insights into long-term market trends, it doesn’t provide the level of market timing capabilities that technical analysis does. As for finding a speed edge similar to HFTs, that requires massive infrastructure and costs that are out of reach for the majority of individual traders and investors.
As such, for our purposes here, we will detail high probability trading tactics as it relates to a technical approach to the market. This type of analysis aligns well for most beginning and experienced retail traders, whether they specialize in spot currency, commodities and futures, stocks and ETFs, or cryptocurrencies.
As a matter of interest, there are two primary types of trading styles that are most often applied in market speculation. The first is the trend following approach, and the second is a contrarian approach. The trend following, or trend trading methodology focuses on finding high probability trade setups that are aligned in the direction of the larger trend.
The trend trader understands the importance of following the path of least resistance. The focus here is to follow the current momentum of the market, and ride the underlying trend for as long as the market can sustain the price move. Alternatively, a contrarian or mean reversion approach to market analysis seeks to find market extremes, and then fade the price action as it begins to snap back towards its equilibrium level.
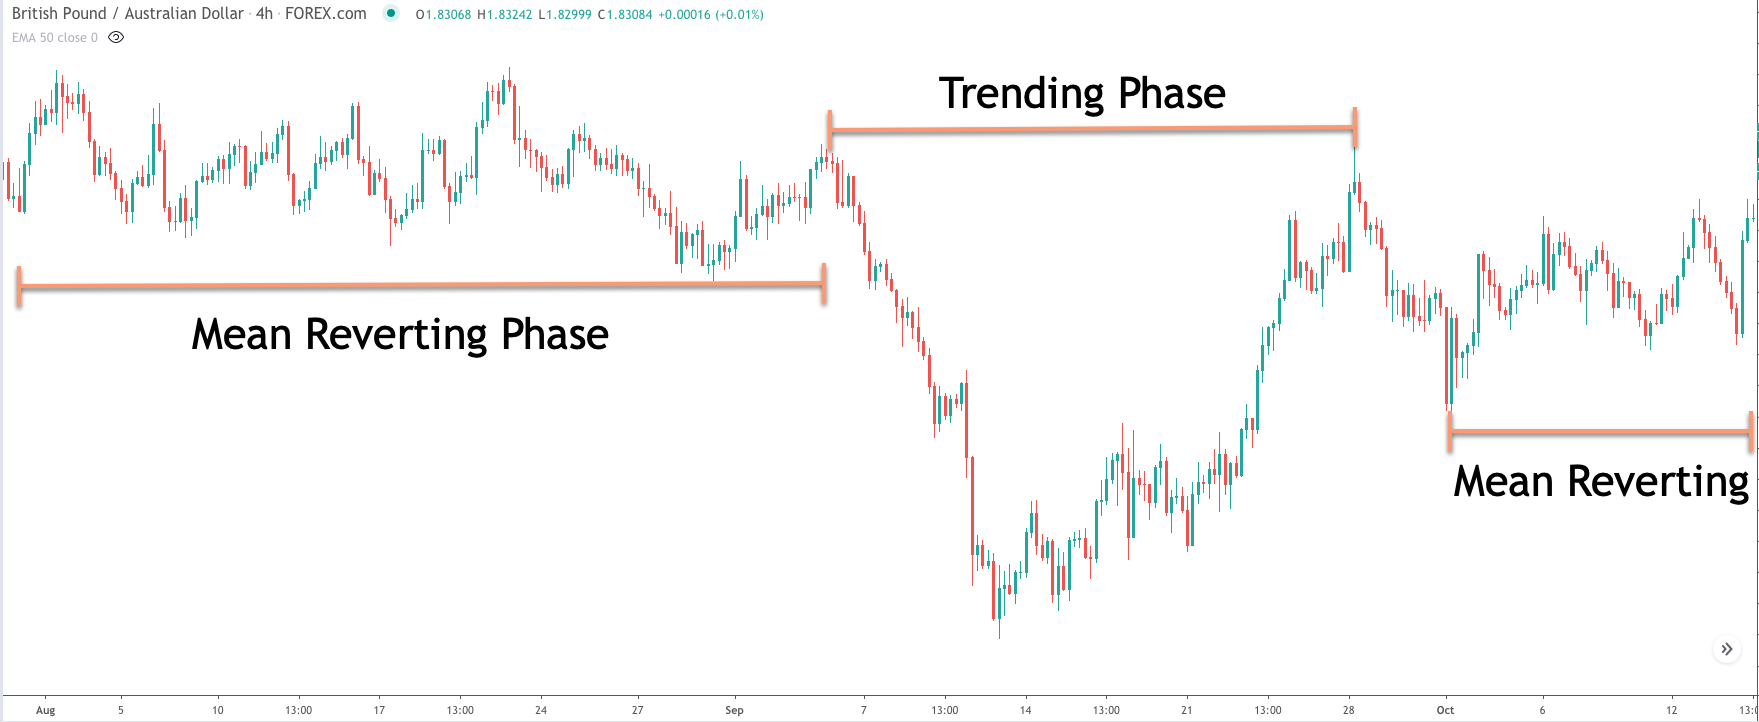
So then a natural question arises. Should I focus on a trend trading model or a mean reversion model? The answer to that question is not always clear cut. The reason being, there will be certain market conditions that favor a trend following approach, and other market conditions that favor a mean reversion methodology. It is our job as traders to evaluate the current market regime to decipher which model would provide the highest probability trading application at that specific time.
High Probability Chart Patterns
Technical chart patterns are a subset of technical analysis. It is a discretionary based trading technique that is quite popular among Forex and futures market traders. Classical chart patterns are essentially price action structures that form unique patterns on the price chart.
There are many chart patterns that can occur in the market. Some of the more common chart patterns include the head and shoulders, double top and double bottom, rectangle, wedge, triangle, flag, pennant, and cup and handle. Each of these patterns has a unique visual appearance, and when traded properly, they can provide for high probability trade signals.
Let’s take a closer look at three such high probability chart patterns.
Head and Shoulders – The H&S chart pattern is a reversal type pattern that is often seen at the end of an uptrend. And the inverse head and shoulders pattern appears at the end of a downtrend. There are three primary components within a head and shoulders pattern. This includes the left shoulder, which is an important swing high, followed by the head, which is highest peak within the pattern, and finally the right shoulder which is an important swing high that follows the head formation.
Below you can see an illustration of the head and shoulders pattern.
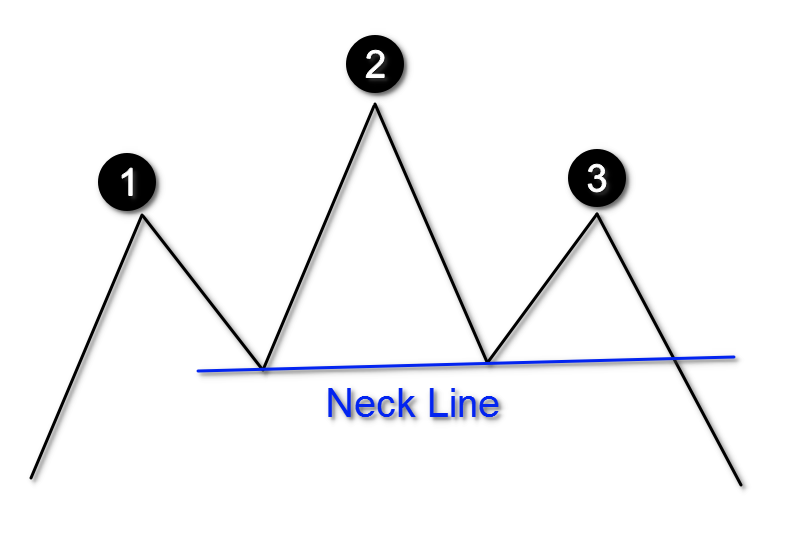
The neckline holds a special significance within the structure. Essentially the neckline is drawn connecting the two troughs within the larger structure. The neckline can be a straight line, or slanted slightly upward or downward. It serves as the signal point for the head and shoulders pattern. More specifically, a sell signal would be triggered when the price breaches the lower neckline.
Flag Pattern – The flag chart pattern is a continuation type pattern that is often seen following a sharp price move up or down. It resembles a zigzag or lightning bolt formation. It is a consolidation phase wherein the price action is contained within a parallel price channel. The upshot of the flag pattern is that once this consolidation formation ends, it will result in another price leg in the direction of the prior trend.
There are several different ways to execute a high probability trade using the flag formation. One could wait for a breakout of the resistance trendline in the case of an uptrend, or a breakout of the support trendline in the case of a downtrend. Alternatively, some traders prefer to use the Fibonacci retracement as their preferred high probability entry technique. Often, we will see the price action correct 38 to 50% of the prior leg before resuming in the direction from which it came.
Below you can see an illustration of the flag pattern.

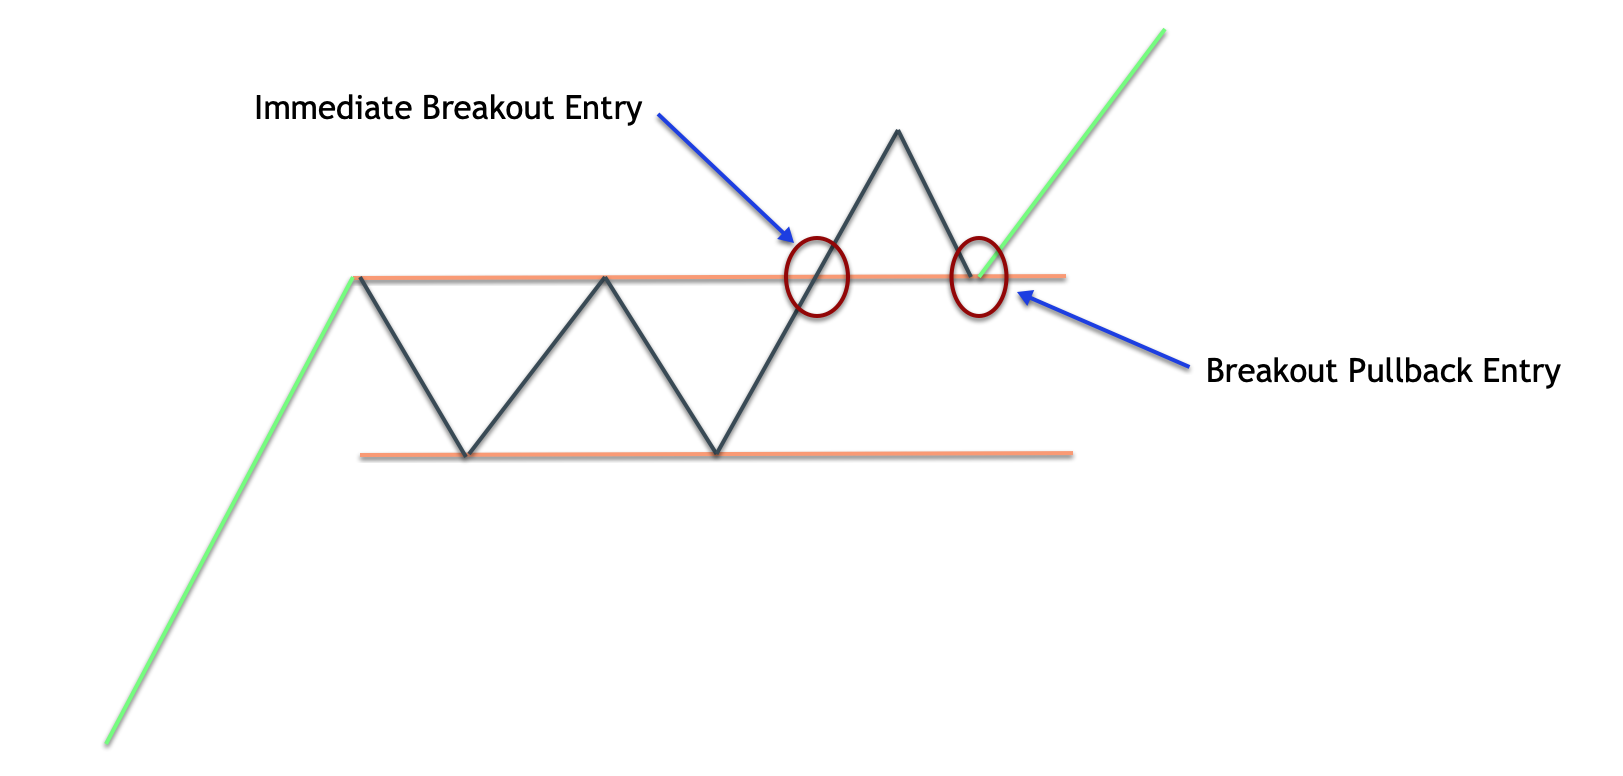
Rectangle Pattern – Another classical chart formation that is often seen within the price action is the rectangle pattern. Most times, the rectangle pattern is considered a continuation pattern, but sometimes it occurs as a reversal pattern. When it occurs as a reversal pattern is referred to as a rectangle top, or rectangle bottom. Regardless, the price action within the rectangle structure will consolidate between a horizontal resistance level, and a horizontal support level. These horizontal price levels will form what appears as a rectangle or a parallel price channel. The price action should be contained within the rectangle structure.
The high probability play would be to wait for a breakout from the rectangle pattern that aligns with the larger trend. That is to say that if the prices were trading higher leading up to the rectangle structure, then we would want to wait for a breakout of the rectangle’s resistance line and go long. And conversely, if the prices were trading lower leading up to the rectangle pattern, then we would want to wait for breakout of the rectangle’s support line and go short.
Below you can see an illustration of the rectangle formation.
Using Confluence To Find The Best Forex Trading Setups
There are certain steps that you can take as a trader to increase your chances of achieving a high probability trading strategy that works in the market. We discussed some different types of technical chart patterns as a starting point for building a profitable trading strategy.
There are countless other trading techniques that you can explore as well. However, there is one important trading concept that you should know because it will benefit any type of trading methodology used. And this concept that I am referring to is called, Confluence.
Confluence, as it pertains to trading the market, means that we should seek to have several different, uncorrelated market signals that are pointing to and confirming the same underlying premise. In other words, we would look for bullish confluence when we are seeking to take a long position, and conversely, we would want to see bearish confluence when we are seeking to take a short position.
Now, an important point about confluence that needs to be stressed is that we should be using non-correlated analysis techniques or indicators to confirm the trade. Many traders are under the impression that confluence simply means that all of your preferred indicators should be providing you confirmation on the trade. However, some of these traders fail to realize that many technical indicators are redundant and as such they may not provide unique information.
For example, some traders are keen on utilizing RSI, Stochastics, and MACD technical indicators. All of these indicators are considered momentum indicators. As such, if you rely exclusively on this class of indicators for confirmation , then you may be mistaken in believing that you are achieving a true level of market confluence.
The reason being is that true market confluence relies on receiving the confirmation from a non-correlated analysis technique or indicator. This is an important distinction that traders need to keep in mind if they hope to find the highest probability trade set ups in their chosen market.
An example of a high probability trading scenario that utilizes true confluence would include confirmation coming from a momentum indicator such as RSI, a horizontal support resistance level, and a candlestick pattern formation. All three of these market analysis techniques are uncorrelated in nature. Any one of these could provide for a viable trading signal, however, when they are combined, they can result in achieving a much higher probability of success on the trade.
Again, I’ve only illustrated these three technical studies as a point of reference to start thinking about how you can go about achieving trading confluence. You can use a countless array of different combinations in an attempt to build your own high probability trading model.
Now having said that, it’s also important not to overdo it. By that what I mean to say is that there is a point of diminishing returns. In other words, you should utilize two or three unique trading tools to find high probability trade setups.
Anytime you go beyond three or four confirmation parameters, it leads you down a slippery slope wherein you will either substantially reduce the frequency of your trades, or build a model that is too restrictive to trade in the real market environment. In which case, your trading method may not be statistically significant due to a lower number of occurrences observed.
High Probability Forex Strategy
You should now be more familiar with some of the components that constitute a high probability trading method in the markets. At this point, we will attempt to build a complete trading methodology that can be applied in the financial markets. The strategy can work on many different timescales and with many different financial instruments. In order to achieve the best results, I would suggest applying it to the four hour timeframe and above in the spot forex or commodity futures market.
This high probability trading tactic is built around three different technical studies. And all of which have a fairly low correlation to one another. As a result, it would provide us a high level of confidence in our trade because there are several unrelated analysis techniques pointing to a specific market signal.
The first of these indicators will be the 50 period exponential moving average. Essentially the exponential moving average takes into account the recent price action more heavily within its calculation that it does the latter data points. As such, the exponential moving average is a more sensitive moving average study compared to the simple moving average. For this particular strategy, we prefer to use the exponential variation.
In addition to this, you will be scanning for a very specific chart pattern, and one that we have touched upon earlier. What I’m referring to is the flag pattern. It’s a simple continuation pattern that sets up a new price move in the direction of the previous trend leg.
And lastly, we will use the MACD histogram as a means to measure the momentum of the price break from the flag structure. In the case of an upside breakout, will want the MACD to register a positive reading, whereas in the case of the downside breakout will want to MACD to register a negative reading.
And so these are the essential components of this high probability forex trading strategy. Let’s quickly outline the rules for a long and short trade.
The following rules apply to initiating a long position:
- A clearly defined flag pattern sloping downward must be present on the price chart
- Wait for a breakout and close above the flag’s resistance line.
- At the time of the upside breakout, the MACD reading must be above zero.
- At the time of the upside breakout, the price must be above the EMA (50).
- Upon meeting these conditions, enter a market order to buy.
- The stoploss would be placed below the swing low within the flag structure.
- The target will be set at the 61.8 Fibonacci projection level of the prior trend leg preceding the flag formation.
The following rules apply to initiating a short position:
- A clearly defined flag pattern sloping upward must be present on the price chart.
- Wait for a breakout and close below the flag’s support line.
- At the time of the downside breakout, the MACD reading must be below zero.
- At the time of the downside breakout, the price must be below the EMA (50).
- Upon meeting these conditions, enter a market order to sell.
- The stoploss would be placed above the swing high within the flag structure.
- The target will be set at the 61.8 Fibonacci projection level of the prior trend leg preceding the flag formation.
High Probability Trade Setup In AUDUSD
We will now apply this trade strategy to a forex currency pair. On the price chart below you will find the AUDUSD pair plotted on the four hour timeframe.
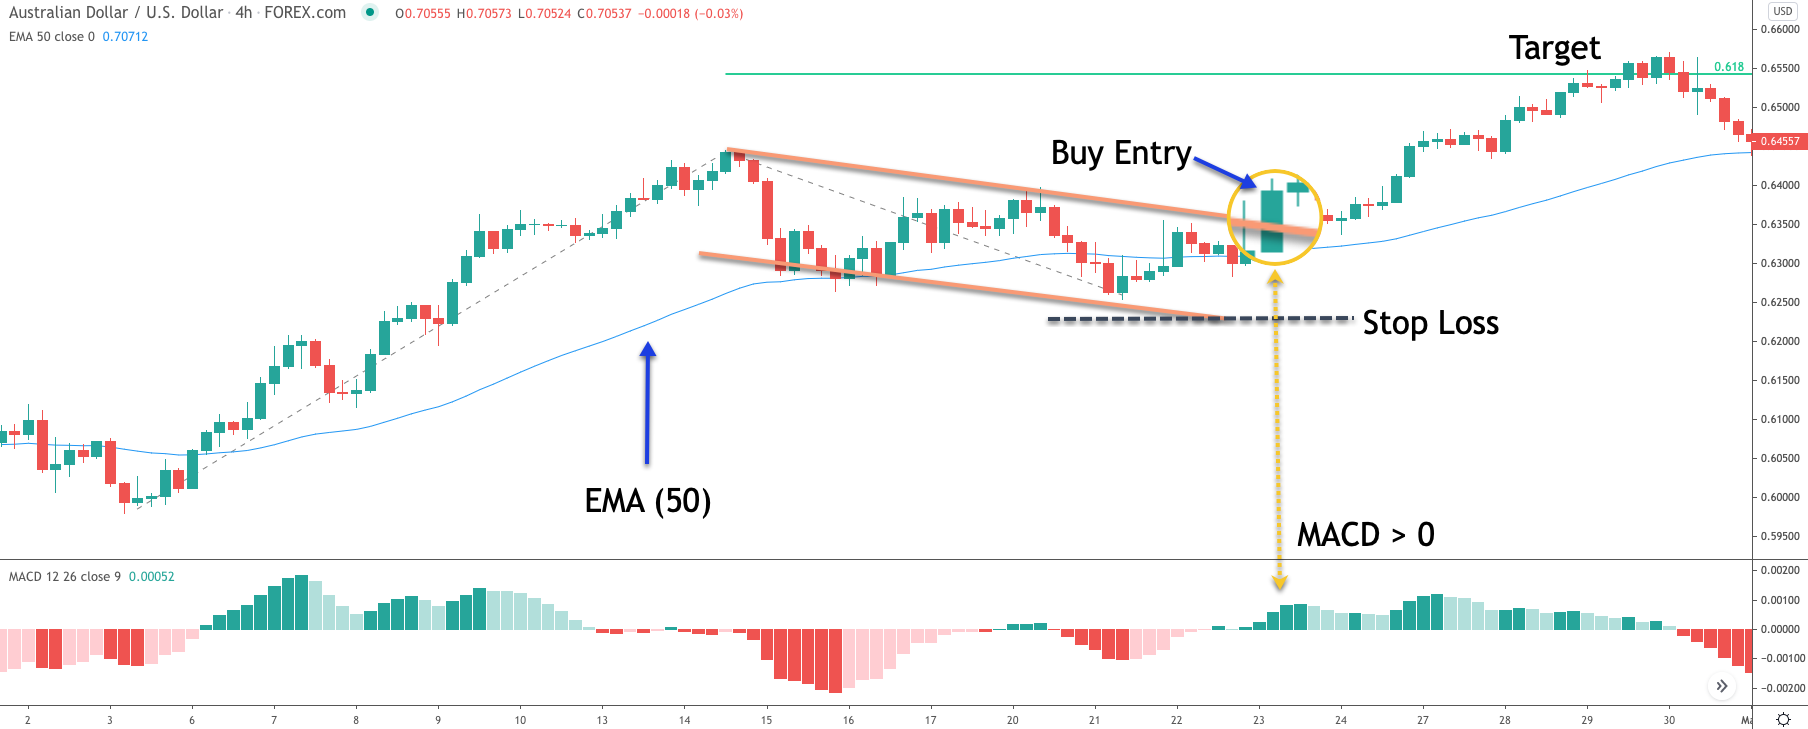
Firstly, we have outlined the flag pattern within the orange parallel channel. Notice how the price action is predominantly contained within this downward sloping parallel channel. You’ll also notice that it appears as a consolidation pattern following a sharp uptrend. This prior leg is often referred to as the flagpole. As such, we would expect prices to break the upper resistance line of the flag formation. After which, we should see another leg in the direction of the prior trend, which in this case is up.
Soon after the second swing low was put in within the flag pattern structure, prices began to move higher and eventually there was a candle that broke out and closed above the upper resistance line of the channel. That particular candle has been shown within the magnified area on the chart. As such, this event would’ve triggered our buy entry set up. But keep in mind, before we initiate the long position, we must ensure that our additional trade filters are aligning with this breakout signal.
Based on our strategy rules, the reading on the MACD histogram must be above zero. This particular filter ensures that at the time of the breakout there is positive momentum leading up to the breakout point. As we can see by the dashed yellow arrow, the MACD was moving higher and registered a reading above zero at the breakout point.
In addition to this, we will require additional confluence from the 50 period exponential moving average. The blue line on the price chart represents this important EMA 50 line. Notice again, where the closing price is trading following the breakout and its relation to where the EMA 50 is located. We can see that the closing price of the breakout candle is above the EMA 50 line. As such, our second filter also providing us with confirmation for the trade.
Now that all of the critical conditions for this trade set up have been met, we would continue by immediately initiating a market order to buy. The stop loss would be placed below the swing low within the flag structure. And finally, our take profit target would be set at the 61.8 Fibonacci projection of the prior trend leg.
The way that you would plot this level is by using the Fibonacci projection tool. Firstly, you would select the beginning of the prior trend leg, then select the end of the prior trend leg. And then finally select the swing low within the flag structure, which is where we would be projecting our target from. You can see these three points by following the light gray dotted lines within the price action. Once these three points have been selected you could set your projection tool to plot the 61.8% measurement.
Notice how the price reaches our 61.8% target level, and then begins to find supply in the market, which acts to drive the prices lower from this level. Ultimately, our trade would have ended up in the green and with a nice profit.
Summary
Building a high probability trading system or strategy requires a good deal of market knowledge and skill. But the time spent testing, refining, and optimizing your trading model is well worth the effort.
For most retail traders, the best course of action for developing a market strategy that can provide an edge in their trading, should start with a solid understanding of technical analysis. Once a trader has acquired the necessary skills in this analysis method, they can consider integrating other techniques to improve upon those trade setups that work for them.