The stochastic momentum indicator is one of the most popular technical analysis indicators used by Forex traders. The Stochastic Oscillator was invented by a Chicago-based securities trader and renowned technical analyst George C. Lane. He belonged to a group of elite traders in Chicago’s investment arena but, the invention of the Stochastic Oscillator was solely attributed to him, and, in fact, it was initially called the “Lane’s stochastics.”
The Stochastic indicator belongs to a cluster of oscillating technical indicators, which are calculated using a fixed number of time periods and wherein its values fluctuate within a set range around a center line.
Similar to the Stochastic Oscillator, a handful of other Oscillator indicators were developed around the same time using similar principles. Two of the more widely used are the Commodity Channel Index (CCI), and the Relative Strength Index (RSI)
Most beginner Forex traders get confused about how to correctly interpret the Stochastic Oscillator signals under varying market conditions. You see, you need to apply a specific type of stochastic trading strategy when the market is trending, but you need to read the stochastic technical indicator very differently under a range bound market condition.
If you misinterpret the market environment, the same Stochastic Oscillator value can translate into a very different signal. This is where most beginner Forex traders fail. They simple apply the Stochastic Oscillator in the same manner, regardless of the underlying market condition, and end up losing money as a result.
If you have felt frustrated when trying to apply the Stochastic Oscillator, then this lesson will certainly help you to better understand how the indicator generates its signals, how to interpret the signals, and how to apply the stochastic indicator signals correctly under different market conditions.
How Stochastic Oscillator Values are calculated
The key to using a technical analysis indicator is to know how the indicator values are calculated. Compared to some of the more complex technical indicators, the formula used to calculate the Stochastic Oscillator is rather straightforward.
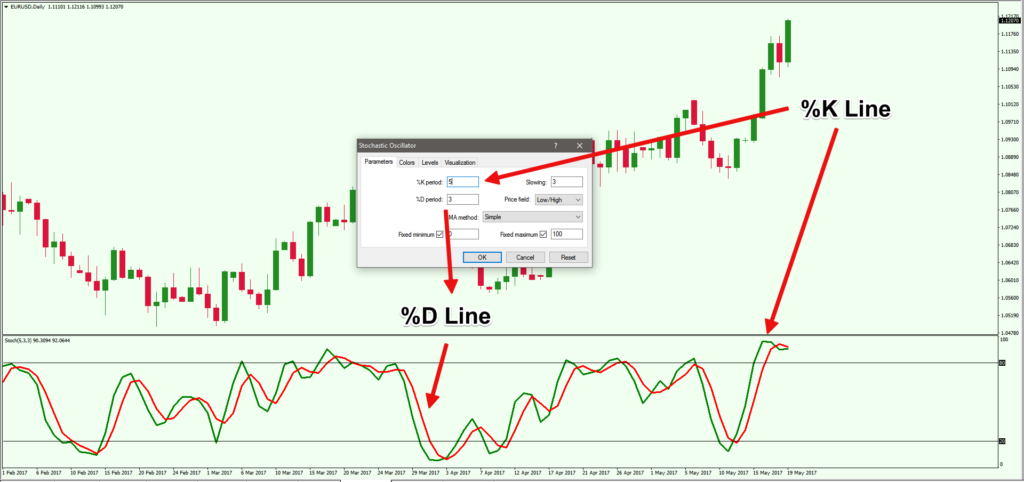
Figure 1: The %K and %D Lines of the Stochastic Oscillator
If you open the stochastic oscillator settings on any popular charting software, like the MetaTrader 4 platform, you can see the indicator has drawn two distinct lines that represent %K and %D values, which are calculated using the following stochastic formula:
%K = (Closing Price of Current Bar – Lowest Price of Calculating Period) / (Highest Price of Calculating Period – Lowest Price of Calculating Period) x 100
%D = The 3-Period Simple Moving Average of %K or 100 x ((K1 + K2 + K3) / 3)
By default, the Stochastic Oscillator on MetaTrader 4 calculates a 5 period Stochastic, as you can see the %K value is set to 5 in figure 1. However, most traders calculate the Stochastic Oscillator based on 14 periods, which can be 14 days on a daily chart or 14 hours on an hourly chart for example.
It is recommended that you double check the stochastic oscillator settings on your favorite charting platform to confirm the number of periods it is using.
Keep in mind that the volatility of different Forex pairs will vary. For example, the GBP/AUD is usually more volatile than the EUR/GBP, and the GBP/JPY is more volatile than EUR/USD, and so on. As the volatility varies based on which currency pair you are trading, you can try to tweak the period settings to improve the efficiency of the stochastic signal based on the price action of the currency pair.
If you are just starting out, you can stick to using the 14 period setting. However, if you already have some experience trading, it might be a good idea to spend some time back testing a currency pair and try to find an optimal time period range to calculate the Stochastic Oscillator values for that particular Forex pair.
Understand the Difference Between Fast and Slow Stochastic
When the Stochastic Oscillator was first invented, it was calculated using the formula we discussed above. However, the original Stochastic Oscillator formula seemed too responsive for some stocks and commodities markets, and traders applied an additional 3-period moving average to slow down the responsiveness of the indicator further.
You can see that there is an input box called “Slowing” in figure 1, which shows a value of 3. This value represents the additional moving average applied to the Stochastic Oscillator to make it a bit less responsive to price action, which results in a more measured output that helps improve the quality of the Stochastic Oscillator signals.
When you use an additional moving average to slow down the original Stochastic Oscillator formula, it is called a slow stochastic. Hence, by default, the MetaTrader 4 trading platform shows a slow stochastic based on an additional 3 period moving average.
On the other hand, if you stick to the original Stochastic Oscillator formula, then it would be called a fast stochastic.
To calculate a fast stochastic using MetaTrader 4 and other charting software, you need to set the value of slowing to 1.
So, to calculate a 14-period fast stochastic, you need to set the %K to 14, %D to 3, and slowing to 1. On the other hand, to calculate a 14-period slow stochastic, you need to set %K to 14, %D to 3, and slowing to 3.
Effective Use of Stochastic Oscillator Explained
The Stochastic Oscillator offers Forex traders three different types of signals
- Overbought and Oversold
- Stochastic Crossover
- Stochastic Divergence
Depending on the market conditions, these three signals can be interpreted differently. Therefore, it is imperative that you learn to identify the market condition before trying to interpret the Stochastic Oscillator signals.
Identifying Overbought and Oversold Market Conditions with Stochastic Oscillator
Often the most used Stochastic Oscillator signal is the overbought and oversold market conditions. As we discussed earlier, the Stochastic Oscillator is plotted on a fixed scale, and its value stays within 0 and 100.
When the Stochastic Oscillator value goes above the reading of 80, it is considered to be an overbought market condition, which signals that if you already have a long position, you should start reducing your position size or actively look for opportunities to sell the underlying asset.
By contrast, when the Stochastic Oscillator value goes below the reading of 20, it is considered to be an oversold market condition, which signals that if you already have a short position, you should start reducing your position size or actively look for opportunities to buy the underlying asset.
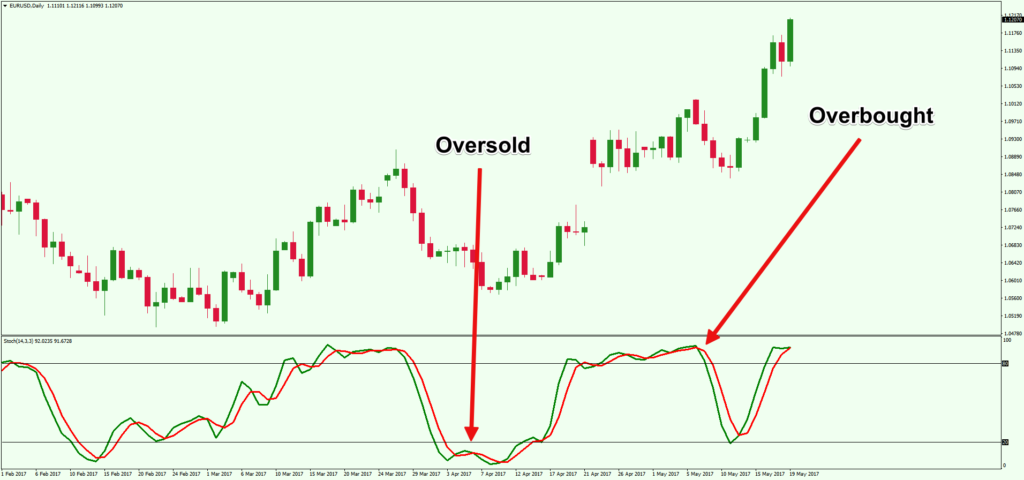
Figure 2: Overbought and Oversold Signals Generated by the Stochastic Oscillator Indicator
While the overbought and oversold signals generated by the Stochastic Oscillator is quite reliable, it is worth noting that these signals work best during a range bound market. However, during an uptrend market, the Stochastic Oscillator becomes overbought, and during a downtrend market, the Stochastic Oscillator becomes oversold very quickly and gives an illusion that the market is about to reverse. George Lane used to refer to these types of occurrences as the “Stochastic Pop”.
Beginner Forex traders often complain that they placed a buy or sell order during an uptrend or downtrend after seeing an overbought or oversold signal generated by the Stochastic Oscillator, which resulted in a loss. If you decide to counter trend trade using the Stochastic Oscillator signals during a trending market, you will get beat up quite badly.
During a trending market, you should apply additional filters such as trend lines and other trend reversal indicators to confirm if the trend is ending or it has already reversed before taking counter trend Stochastic Oscillator signals seriously.
Trading with Stochastic Oscillator Crossover Signals
The second most utilized Stochastic Oscillator signal is the crossover signal, which happens when the %K line crosses above the %D line and generates a buy signal. On the other hand, when the %K line crosses below the %D line, it generates a sell signal.
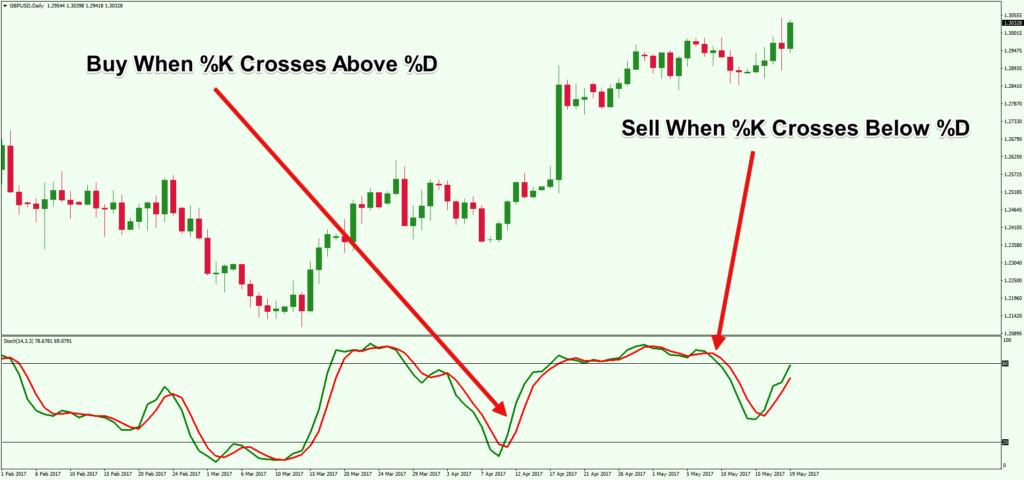
Figure 3: Stochastic Oscillator Generates Buy and Sell Signals with %K and %D Crossovers
Once again, these Stochastic Oscillator crossover signals are reliable during a range bound market, but these signals tend to become a lot less reliable when the market is in a strong trend.
However, you can still rely on the Stochastic Oscillator crossover signals as a trend continuation signal and open additional positions. For example, in figure 3 the GBPUSD is in an uptrend, and the Stochastic Oscillator generated a crossover buy signal. It indicated that the uptrend is likely to continue and the market did continue upwards. Similarly, if you see a crossover sell signal during a downtrend, you can also rely on the signal as supporting evidence that the downtrend is likely to continue.
This type of trend continuation signal tends to be reliable during trending markets. However, you should take caution and apply additional filters before trading against the trend using the Stochastic Oscillator crossover signal.
The last type of signal generated by the Stochastic Oscillator is called divergence signals. Stochastic Oscillator can generate both trend reversal and trend continuation divergence signals. The trend reversal signal is referred to as regular divergence signals, and the trend continuation signal is known as hidden divergence signals. The stochastic divergence signals tend to be the most powerful and reliable of all the different types of Stochastics generated signals.
Trading Regular and Hidden Stochastic Oscillator Divergence Signals
When price makes a lower low, but the stochastic oscillator fails to confirm and instead makes a higher low, this is considered a Bullish Stochastic Divergence signal. When price makes a higher high, but the stochastic oscillator fails to confirm and instead make a lower high, this is considered a Bearish Stochastic Divergence signal. Such conditions are known as a trend reversal divergence signal.
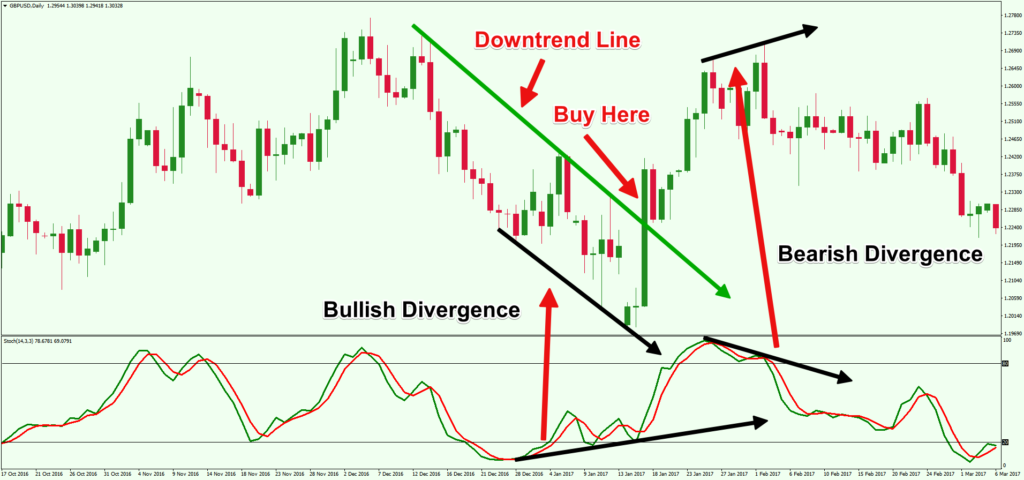
Figure 4: Examples of Regular Bullish and Bearish Stochastic Divergence
As you can see in figure 4, the GBPUSD price continued to go down while the Stochastic Oscillator continued to move up, which generated a classic regular bullish divergence.
A few days later, the Stochastic Oscillator generated a bearish signal, and both the %K and %D continued to go down while the GBPUSD price made a new high. This type of market condition is known as regular bearish divergence.
When you find a regular divergence, you should discount the Stochastic Oscillator crossover signal as it would often turn out to be a false signal. For example, in figure 4, the first few Stochastic Oscillator signals generated during the regular bullish divergence proved to be false.
Therefore, if you see a regular divergence, the best way to enter the market would be to apply a second uncorrelated technical indicator or price action signal. As you can see in figure 4, if you have waited for the GBPUSD price to break above the downtrend line after the formation of the regular bullish divergence, the trade would have yielded a profit, assuming you decided to exit after recognizing the bearish divergence afterwards.
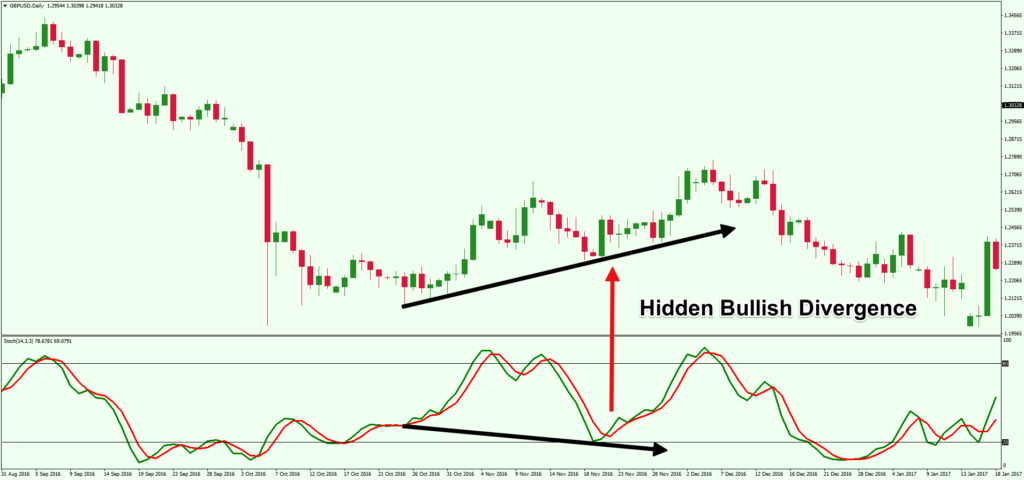
Figure 5: Example of Hidden Bullish Divergence Signal Generated by the Stochastic Oscillator
Hidden divergence is a trend continuation signal, and the Stochastic Oscillator can be used to find these occurances. If you learn to combine the crossover signal with hidden stochastic divergence, it can offer some good trading opportunities.
A hidden bullish divergence occurs when price is making a higher low, but the oscillator is making a lower low. And on the flip side, a hidden bearish divergence occurs when price is making a lower high, but the oscillator is making a higher high. For example, in figure 5, the Stochastic Oscillator value went below the previous low, but at the same time, the low of GBPUSD was higher than its previous low, which generated a hidden bullish divergence.
One approach to using Stochastic Oscillator trend continuation or hidden divergence signal is by combining it with the crossover signal. When the market generates a hidden divergence signal, and a Stochastic Oscillator crossover happens, the combination of these two can produce a high probability setup. As you can see in figure 5, as soon as the %K line crossed over the %D line, the GBPUSD price ended the retracement and resumed the uptrend.
Conclusion
Many Forex traders have experimented with trading with the stochastic indicator. When used correctly, this indicator can help you better gauge price movements in both trending and range bound markets. For example, a stochastic trading system is capable of generating reliable buy or sell crossover signals during a range bound market as well signal hidden divergences in a trending market.
And while the crossover signal does not work very well as a trend reversal signal during a strong uptrend, it can be very reliable as a trend reversal signal with regular divergences.
The Stochastic Oscillator can be a versatile tool within your trading arsenal. You can develop a stochastic oscillator strategy to generate sound signals regardless of whether the market is trending or range bound. However, you need to know how to apply the signals based on varying market conditions in order to trade with it successfully.
We have discussed some of different ways you can apply the Stochastic Oscillator to build a successful trading system. And in fact, the Stochastic Oscillator has been a building block of many past and currently traded systems. But remember that the desired way to profitably implement a forex stochastic strategy would be to identify the market condition first, then use a suitable stochastic signal for that market condition.