Although, the markets only trend about twenty percent of the time, it is during these trending phases wherein a trader is best positioned to make outsized gains. As a result, one of the most popular methods for trading the markets is through a trend following strategy. We will define what a trend following strategy entails, how you can build and execute such a strategy, and discuss some other ways you can participate in market trends.
What is a trend following strategy?
A trend trading strategy attempts to make profits in the market by trying to identify a persistent price move that is likely to continue in the same direction. Essentially, it is a strategy that aims to follow the trend and capture profits from that trend as it progresses. There are many different ways to identify the overall trend of the market. One of the more simple and effective ways is to analyze the swing highs and swing lows within the price action.
For example, if the overall price direction is up, and there is a series of higher swing lows and higher swing highs, then we can say that the market is trending up. Conversely, if the overall price direction is down, and there is a series of lower swing lows and lower swing highs, then we can say that the market is trending down. This is a very basic technique for identifying the trend of a market.
Trend trading strategies are a subset of the technical analysis approach. However, one important characteristic of a trend trading strategy is that it does not seek to predict market direction, but rather seeks to react to current market conditions that are displaying persistent price behavior. Once a trend trader is able to identify such a condition in the market, their goal is then to follow the market trend until such time the price action shows a clear sign of waning or reversing.
This is an important distinction and it differs from other types of market analysis models that attempt to predict future price moves. The primary goal for the trend following methodology is not to ask why a particular market move is occurring, but rather, to recognize and act on its mere existence, so as to benefit from the potential tradable opportunity.
Benefits Of A Trend Following Method
We’ve all heard the saying that the trend is your friend. This is one of the most recognized trading axioms around. But let’s dive a but deeper in our understanding of why a trend following approach is beneficial. Here are three reasons why you should consider trading with the trend:
Potential For Outsized Gains – Most traders will find that on average the vast majority of trades that they execute will typically net out to breakeven. It’s only on those handful of trades where the majority of the profits are actually realized. A trend following method forces us to stay in a winning position for as long as possible to maximize the gain on a trade.
Hand-and-hand with attempting to maximize profits on a trade, most trend following models are equipped with strict money management rules. For example, a position may only be allowed to risk 1% or 2% of capital on any one trade. As a result, trend followers can often realize reward risk ratios of 3:1, 4:1 and even higher because there are built-in mechanisms that require them to cut their losses short, while letting their profits run.
Lower Transaction Costs – Unlike the high frequency of trading in and out of positions that is common in shorter-term scalping, daytrading, and even some swing trading methods, a trend following strategy is much more passive. Sometimes the transaction costs for high volume traders can be as high as 60 or 70% of their gross returns. These are direct profits that they are giving back to the market. This can place a heavy burden on the overall profitability of the short term trading strategy. The costs associated with a trend trading strategy is often very nominal in comparison.
Reduced Time Commitment – Most trend following methodologies are built with a longer-term time horizon in mind. As such, most entry and exit signals for these long term trend following systems are generated using daily or weekly price bars. Because of this, the time required to manage a trend following portfolio is quite minimal. Typically, all that is required of a trend trader is possibly an hour or so a day for finding the best trending markets, executing new orders, and managing existing positions. This frees up a lot more time to devote to other work and life activities.
Common Trend Following Indicators
There are a host of different technical studies that can be used for building a trend following system. Some of functions that these technical indicators can serve include trend identification, entry signal, trade management, exit signal, and more. We will take a look at three common trend following indicators that can be used in various capacities within a trend following model.
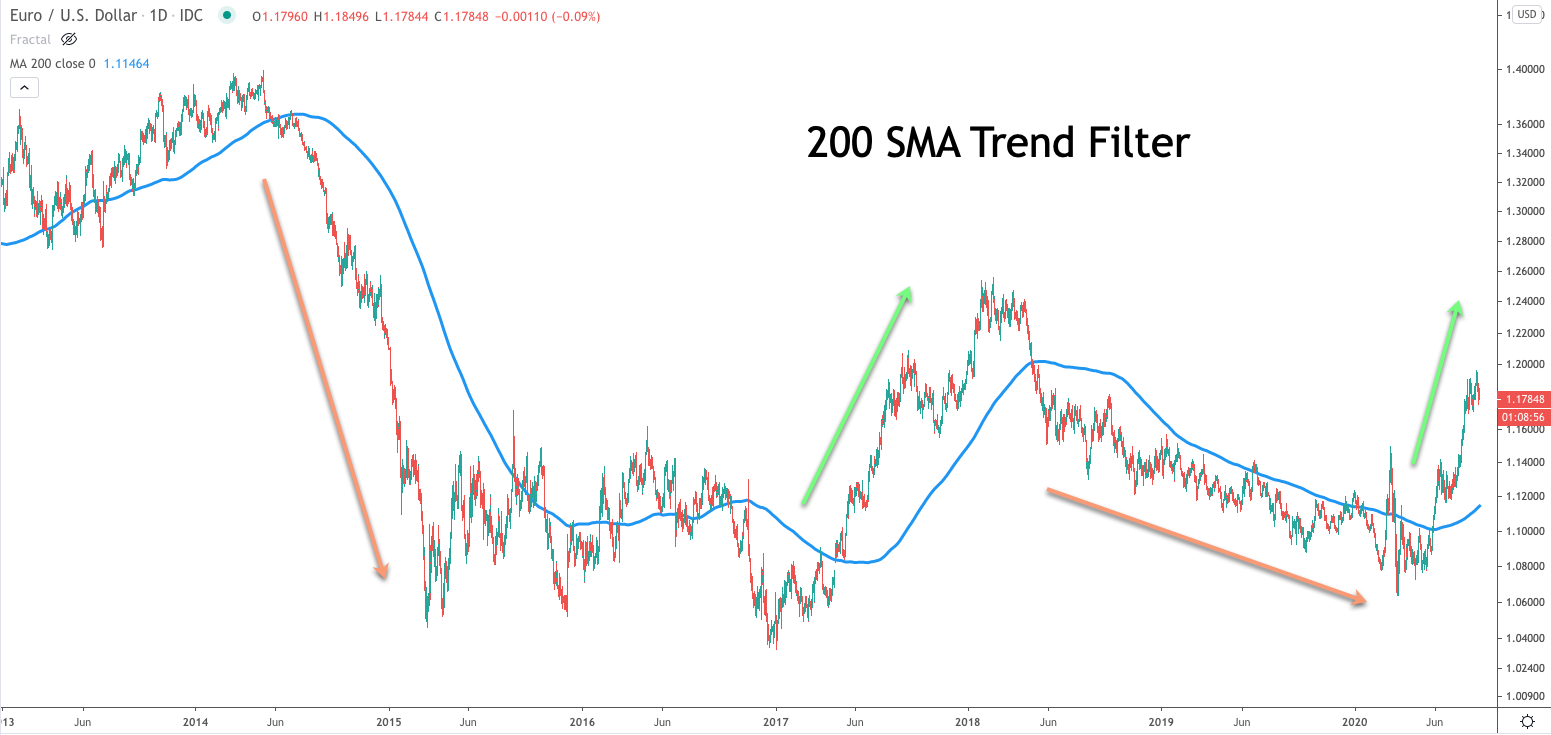
We’ll start off by taking a look at a trend identification indicator. The one that were going to look at is the Simple 200 period moving average, or SMA 200. The most common application of the 200 SMA is in forming a directional bias for a market. For example, if the price is trading above the 200 SMA, then we will only look to take long trade signals, and conversely when the price is trading below the 200 SMA then we will only look to take short trade signals.
Take a look at the price chart below which illustrates the 200 period SMA as a trend filter:
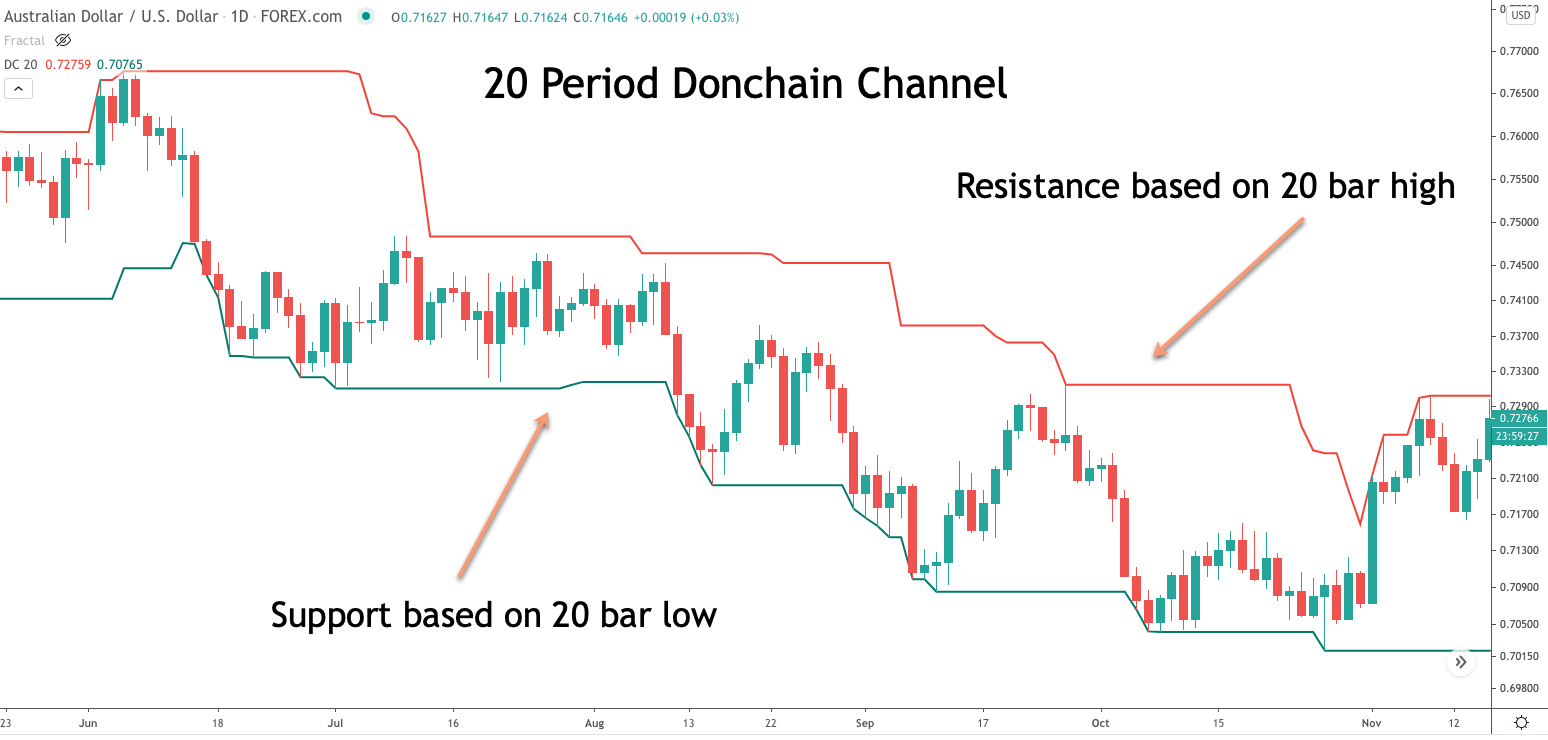
Let’s now move on and take a look at a technical indicator that could serve as a trade entry mechanism. The Donchain channel is a popular support and resistance based channel indicator that can be used to enter a market based on a breakout signal. The upper line of the Donchain channel represents the high of the last X bars, while the lower line of the Donchain channel represents the low of the last X bars. The middle line within the Donchain channel represents the average price between the resistance and support line.
An entry signal to go long would occur at a break above the upper channel line, and an entry signal to go short would occur at the break below the lower channel line. This type of X bar breakout entry is a very simple but effective breakout strategy incorporated within many different types of trend following systems.
Below you will see an example of the Donchain channel drawn on the price chart:
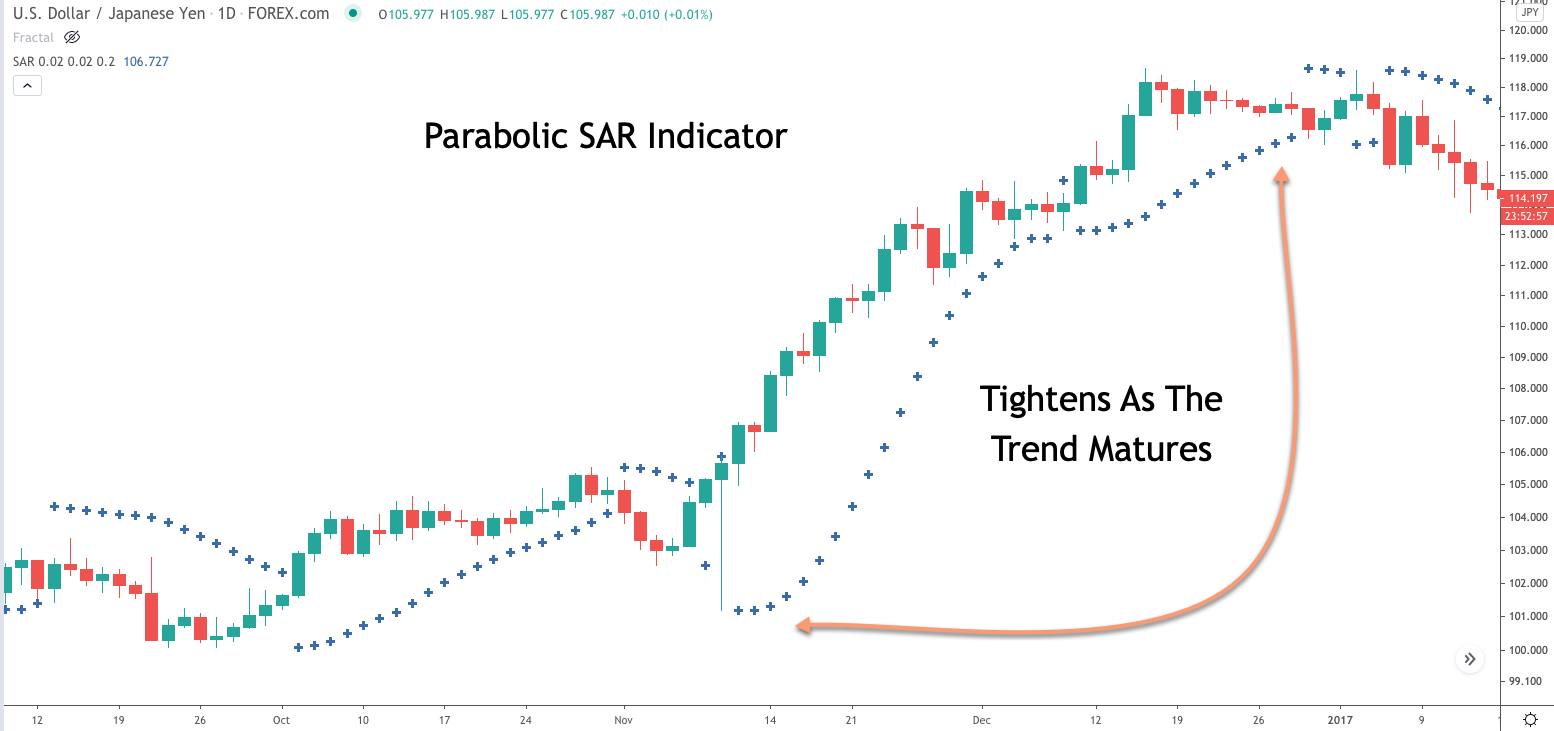
Moving on, let’s now refer to a technical indicator that can be useful as a trade management mechanism within a trend following model. This particular trading indicator is called the Parabolic SAR. It was created by J. Welles Wilder, the famous technician that is also credited with the creation of the RSI indicator.
The Parabolic SAR study is less well-known indicator even within technical circles. However, it is a study that can be applied effectively as a trailing stop within a trend following system. The Parabolic SAR appears on the price chart as a series of dots below the price candles in an up trending market, and as a series of dots above the price candles in a down trending market. As a trend gets underway the Parabolic SAR allows much more room between the price and the indicator. As the trend matures, the Parabolic SAR indicator begins to tighten, which serves to protect profits in case of a potential reversal after a mature trend move.
Let’s take a look and see what the parabolic SAR indicator appears like on a price chart:
Trend Following Trading Method
We briefly discussed a few technical indicators that could be utilized within a trend following framework. Let’s now build a trend following methodology based on those indicators, along with some other trend following rules. Our primary goal will be to trade with the longer-term trend. So for the purposes of identifying a trend, and confirming the trend direction, we will incorporate the 200 SMA into our strategy.
Next, we will require an entry mechanism for initiating new trades. We’ll want to ensure that we do not miss any major trade opportunities, and as such we will opt for a breakout entry rather than a pullback entry. As we learned in our previous section, the Donchain channel is a support and resistance based channel based on an X bar look back. So for our example trading strategy we will use the 20 bar lookback within the Donchain channel for our trade entry component. This default 20 bar lookback has proven to be good signal when attempting to follow longer term market trends.
What else do we need to incorporate into the methodology? Well, for one, we will need a way to limit our losses after our entry has been triggered. I like to use a recent minor or major swing for the purposes of placing a stoploss order. As such, once a trade entry has executed, we will refer to the price chart and manually place the stop loss order based on the recent price swing.
Building further on our trend following system, we need to have an exit plan. Our exit plan should allow us to maximize the gain on the trade while minimizing the chance of giving back too much open profit. The Parabolic SAR indicator can serve our purpose well in this goal. As mentioned, it allows more breathing room at the earlier point in a trend, while tightening the trailing stop as the trend matures. This helps protect our open profits in the event the trend reverses.
And so now with just three widely available out-of-the-box trading indicators, we have been able to create a fairly simple yet robust trend following strategy for trading the market. The beauty of most trend following systems is that they are pretty simple in their construction, with just a relatively few number of variables. The one that we’ve created here is not much unlike some commercially available trading systems that sell for hundreds if not thousands of dollars.
Now let’s recap the rules for this trend following strategy.
Enter into a long position when the following three conditions are met:
- Current price is above the 200 simple moving average line
- Price has closed above the 20 bar high, as can be seen with the resistance line of the Donchain channel.
- Parabolic SAR indicator is long.
Stop loss to be placed at a recent swing low. Exit long position when the Parabolic SAR indicator switches from long to short.
Enter into a short position when the following three conditions are met:
- Current price is below the 200 simple moving average line
- Price has closed above the 20 bar low, as can be seen with the support line of the daunting channel.
- Parabolic SAR indicator is short
Stop loss to be placed at a recent swing high. Exit short position when the parabolic SAR indicator switches from short to long.
Trend Following Trade Example
Now that we’ve outlined the trend following trading rules, let’s now study this trend following trading system in more detail by looking at a practical example. Below you will find a price chart of the British Pound US dollar based on the daily timeframe. On the chart we plotted the three primary indicators that we will use with this trend following strategy. These include the 200 day simple moving average, which is shown as a solid blue line, the 20 period Donchain channel, which is shown by the upper red line of the channel and the lower green line of the channel, and finally the Parabolic SAR indicator which is shown as the series of dots above and below the price action.
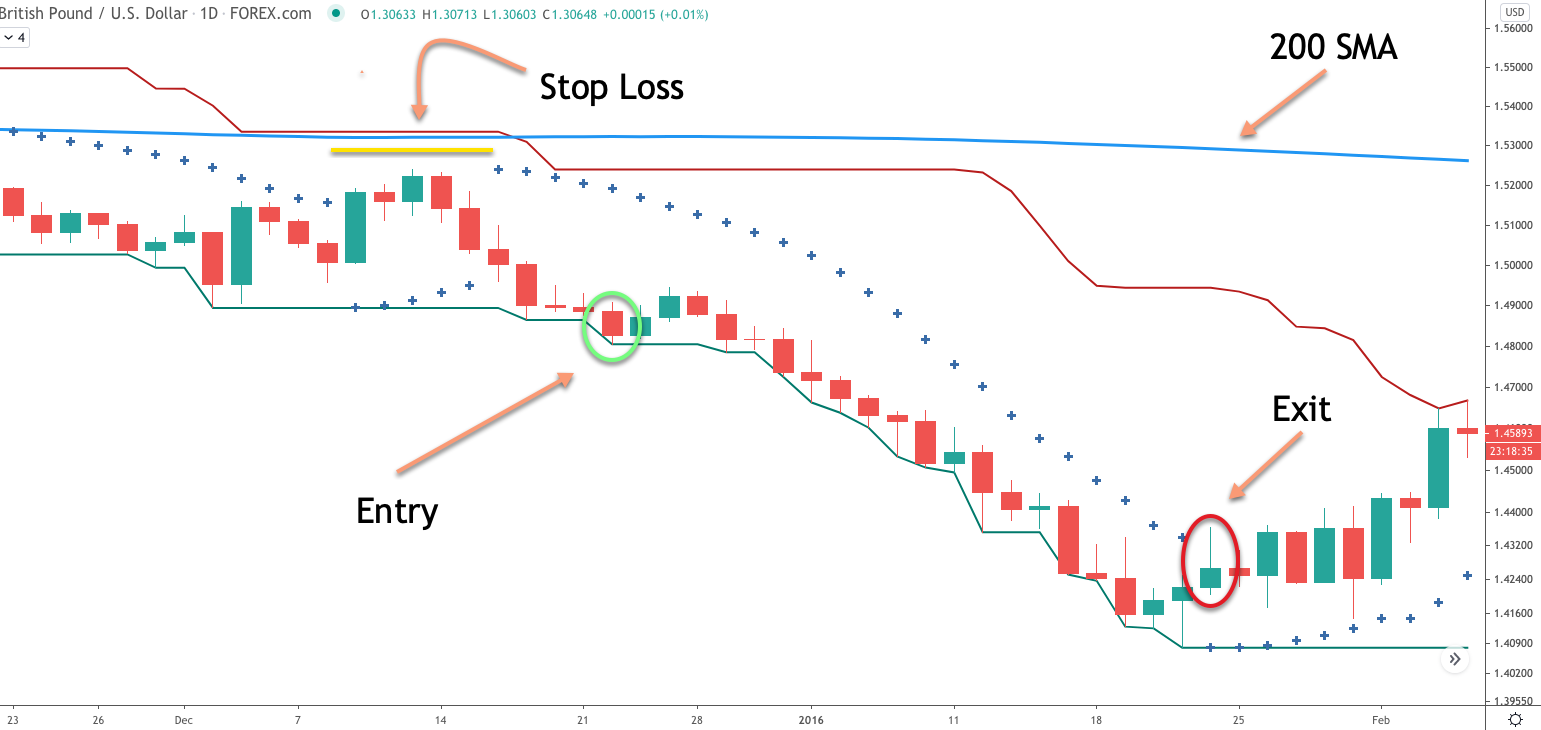
Looking at the far left of this price chart, we can see that the British Pound US dollar has been trading below the 200 Simple moving average line. Additionally as we move forward in time, we can notice that the Donchain channel formed a support line which was soon followed by a breakout and close below it. When this occurred, we can also see that the Parabolic SAR indicator is short. We know that our trading strategy calls for an entry signal to sell when the price is trading below the 200 SMA, the Parabolic SAR is short, and price closes below the Donchain channel support line.
All of these conditions were met at the close of the candle circled in green. As such we would open up a short position at the start of the following bar. Now that our short entry has been triggered, we need to refer to the chart to find a suitable location for our stop placement. Based on the rules of our trend following strategy, the stop loss should be placed at a recent swing high above the short entry. Notice the yellow line marked which shows a recent swing high prior to the short signal. This would be an ideal location to place our stop loss for this trade.
Now that we have taken care to limit our risk on this position in the event that prices continue to trade higher, will want to shift our focus to trade management. The trade management technique that we will employ for this particular strategy is based on the Parabolic SAR indicator. More specifically, we can see that the time of entry the dots that compose parabolic SAR indicator are above the recent price action. What this tells us is that the parabolic SAR is confirming the short signal, and we will need to wait until such time as the indicator reverses direction. And that reversal signal will occur on our short trade when the dots begin to print below the price action.
The move following the entry was quite bearish, as is evident from price action that was comprised of a majority of red candles. As each day passed, we would have monitored the trade to ensure that the Parabolic SAR indicator was still confirming our short trade. The moment that we would’ve seen the indicator print a dot below the price action, we would exit the position. The exit signal that we were anticipating occurred a few bars after prices began to stall on the move down. The actual exit bar would’ve occurred at the end of the daily bar that has been circled in red. Notice how the Parabolic SAR a dot prints just below that bar.
Systematic Trend Following vs Discretionary Trend Following
Now that we’ve had a chance to formulate a trading plan around a trend following system, let’s now discuss the two primary execution methods. Essentially there are two ways that an individual can trade a trend following model.
The first is what is called a systematic approach, while the other is referred to as a discretionary approach. The primary difference between the two is that a systematic approach is one wherein the signals generated are done so directly from a computerized algorithmic program.
All the trade rules and if-then scenarios are programmed into the trading algorithm, and then the Algo would interact directly in the market based on those pre-programmed parameters. On the other hand, a discretionary trend following approach, is not one wherein the trade logic is directly coded into a trading algorithm to be executed through a computerized model. Instead the individual trader would be responsible for all the decision processes involved in executing and managing the position.
Many professional traders that employ a trend following model gravitate towards a systematic approach. This includes large banks, CTAs, and hedge funds. The major advantage of a systematic approach is that it mitigates the adverse effects of emotion and psychology that all traders can fall victim to. The trend following algorithm has no such feelings or biases. It acts as a conduit for executing your trading rules in the market in a precise and methodical manner.
Now it should be noted, that although systematic trend following is the preferred method for most experienced trend traders, it is not without challenges and pitfalls. Those that employ a purely systematic trend following strategy must be ever cognizant of technical glitches that can occur within their trading system or outside of it from hardware related or connectivity issues. As such, close monitoring of all positions is a must for systematic based trend traders.
Trend Following and Diversification
We’ve outlined how one can go about building and trading a trend following strategy. But, during our discussion we focused on a trend following model that incorporated just one instrument. We have done this intentionally for the sake of simplicity, however, it’s important to understand that the true value of a trend following technique comes from trading a number of different instruments as part of a trend following portfolio.
There are quite a few reasons why diversification within a trend following model is important. The first of which is that one can never know which particular currency pair or financial instrument is likely to produce a large move over the course of any given year. As a result, in order to ensure that you’re able to capture those few price moves that are likely to produce the highest percentage gains, it’s essential that you apply a trend following system to a large number of uncorrelated financial products.
An example of a diversified trend following portfolio could include the following instruments for example: the US Dollar Index, Canadian Dollar, New Zealand Dollar, S&P 500 Index, US 30 year Bonds, 10 year German Bund, Wheat, Soybean oil, DAX index, Crude oil, Natural gas, Gold, Silver, Cotton, Sugar, and Lumber. This sample portfolio consists of 17 financial products, each of which would have a fairly low correlation to the aggregate portfolio as a whole.
At first it might seem like a daunting task to create such a portfolio, especially if you are largely unfamiliar with some of the products. But keep in mind, the most important element of a trend following system is that it does not seek to predict future price action, but rather, take part in a potential trend that has shown its hand as a likely candidate. As a result, trend traders are not overly concerned with the fundamental factors that are moving these markets, as much as, the realization that a trend event is likely to materialize based on current price action.
Trend Following With Managed Futures
Building on our discussion about the importance of having as many trading instruments as possible within a trend following model, the margin requirements required in constructing such a diversified portfolio may pose a problem for those with a smaller account base. In such a scenario, a trader would need to do the best that they can to try to create an uncorrelated portfolio that suits their account size.
Another viable option for those interested in trading with a trend following mindset but who either do not have the interest or capacity to manage the portfolio themselves, is to consider a managed futures trend following program. Essentially, managed futures is a term that refers to professional Commodity Trading Advisors (CTAs), who manage funds for clients in the futures market.
Many CTAs favor trend following approaches in the market. Although there can certainly be some nuances in the trend following models among different CTA firms, for the most part there appears to be a high correlation in the returns of trend following CTA firms in any given year.
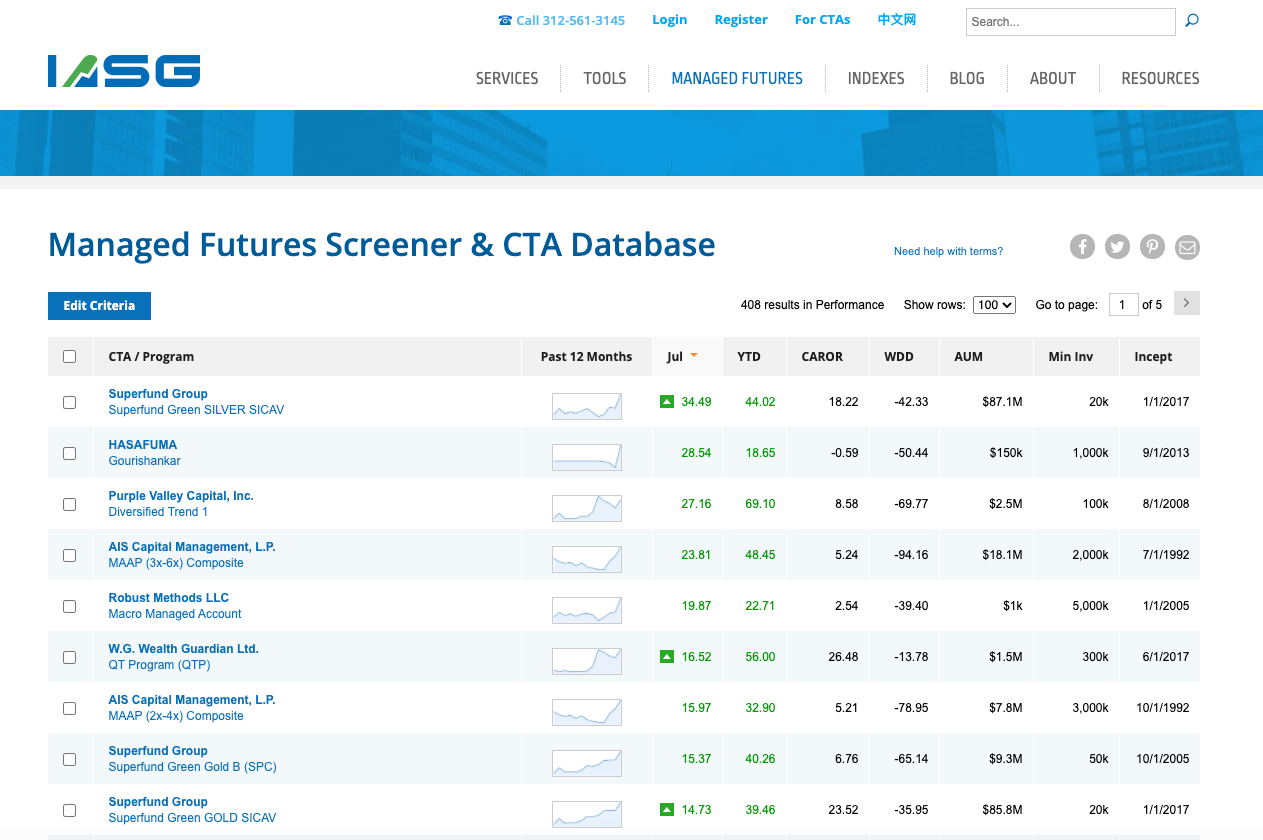
There is a wide array of managed futures programs available to individual investors. There are number of regulatory requirements that CTAs must meet in order to be able to manage investor funds. Some CTAs require only a small investment for entry into the fund, while other larger CTAs will require a substantial initial investment and may only be suitable for institutional and pension fund clients. Overall, most CTAs tend to charge their clients based on a 2/20 performance model. This is to say that clients will be charged 2% of their capital, along with a 20% performance fee on the profits.
There are a few reputable ranking services that provide data on the performance of trend following CTAs. One such firm is IASG:
Summary
There is no doubt that trend following systems can provide excellent returns in the market. These systems have a long history dating back over fifty years, with returns that are in line with, and often surpass those of major equity indexes. There are a number of ways that a trader or investor can participate in trading major market trends. One can build their own trend following system, purchase a commercial trend following system, or invest in a trend following fund.
One of the major benefits to incorporating a trend following approach is that it offers a high level of diversification when deployed correctly. In addition to that, there is a very low correlation in the performance metrics of trend following systems when compared to major stock indices. This in itself can provide for better risk-adjusted returns compared to investing simply in the equity markets only. If you are interested in learning more about trend trading, I would suggest reading a book by entitled Trend Following by Michael Covel.