 As its name implies, the contrarian approach to trading involves establishing positions that are contrary to the present market sentiment. This particular trading strategy is often initiated at times when the market has reached a level of saturation, either on the upside or on the downside.
The use of such a counter trend strategy may seem odd to the untrained observer or novice trader, since most are taught the trading maxim that the trend is their friend. Nevertheless, as far back as the days of celebrated stock trader Jesse Livermore, contrarian trading has proven to be one of the most effective and profitable trading strategies in all types of markets when implemented correctly.
Taking a contrarian view and applying the principles of the contrarian theory requires a disciplined approach and solid analysis of the market to determine optimal entry and exit points for trades. In addition, having extra capital in reserve is advisable in the event that the trader has taken on a position in a market that has not yet reached its reversal point. Many times in this type of approach the trade may initially move against the contrarian.
The Contrarian Theory of Trading
While numerous long term traders search for trends and generally prefer to follow the consensus in their positioning, a certain segment of traders have found it even more advantageous to follow the contrarian theory of trading. This trading theory typically involves the monitoring of market sentiment and other important market indicators to determine and establish trading positions against the majority of participants in the market.
For example, the contrarian forex trader would typically take a long position in a currency pair when there is an overwhelming degree of pessimism that has pushed the price of the asset down to an extreme level that is below what it is intrinsically worth. Conversely, when valuations have reached a high level that cannot be sustained due to a diminishing level of buying pressure, the contrarian will establish a short position in that asset or currency pair.
Because markets tend to follow the prevailing trend until the point of exhaustion, the most important factor necessary to make a successful contrarian trade involves the trader calling the timing of the reversal correctly when establishing their initial counter trend position.
A stop loss set beyond a significant support or resistance level can help to reduce the trader’s risk if they are eventually shown to be mistaken on the timing of the trade.
The Rationale behind a Contrarian Trading Strategy and Contrarian Investing
The best way to illustrate the rationale behind the contrarian trading strategy is to ask yourself a question like, “When is the market most bullish, and when is the market most bearish?” The answer to these questions is that investors are most bullish at the top of the market and most bearish at the bottom of the market. Hence, by determining when market participants are most bullish and most bearish using market sentiment analysis techniques, the contrarian can theoretically predict market tops and bottoms.
As described above, it is no wonder that the majority of smaller traders lose money in the market since they tend to start buying at the top of the market and to start selling near the low. Therefore, it stands to reason that a contrarian investor will look to take a long position at the bottom of a market move and a short position near the top of the market.
As many traders are aware, one of the best ways to trade successfully is to have a specific trading plan, and to stick to the plan when trading. This basic trading tenet helps traders keep from being swayed by the opinions of others and their own emotional states while deciding when to execute a trade. The mass consensus usually tends to be positioned incorrectly when the market become overextended from euphoric buying and similarly becomes oversold from “doom and gloom” pressured selling.
Why Monitoring Crowd Behavior and Psychology Matters
Crowd behavior and the psychology behind that behavior is what ultimately moves the market, no matter whether the asset traded is a stock, commodity or forex currency pair. A trader taking a contrarian approach may closely monitor the fundamental and technical aspects of the market to determine when the market has reached a level that cannot be sustained with either more buying or more selling.
Monitoring the crowd’s behavior and trading patterns gives the contrarian the insight needed to determine an optimum entry point for initiating a trading position. The psychology behind the crowd’s position is also extremely important, since bullish exuberance in a climbing market or excessive pessimism in a declining market are the well-recognized hallmarks of impeding market reversals that a contrarian trader looks for.
Psychology plays a significant role in all markets since supply and demand factors reflect the different opinions of participants in the market. In practice, applying the contrarian theory means looking for situations characterized by very one-sided or “crowded” market psychology. This allows smart money to call market reversals ahead of the actual counter trend market movement occurring, and contrarians typically set up their trading plans to reflect this understanding.
The Typical Tools of the Contrarian Trader
A contrarian trader can use either fundamental or technical analysis, or both, to determine when to enter and exit the market. When taking a contrarian approach, the technical trader will typically use a technical indicator to signal when to initiate or liquidate a trade. Contrarian technical analysis employs the same tools as traditional technical analysis, such as price action analysis, forex oscillators, moving averages, sentiment analysis, and/or any other combination of technical studies suitable for predicting market reversals.
On the other hand, a contrarian trader that uses fundamental information in their trade analysis might use the release of a major economic indicator, such as GDP, or a central bank interest rate decision as a contrarian indicator. For example, instead of initiating a long position in a currency pair after a benchmark interest rate increase, the contrarian might wait for the release of the data and then short the currency pair once it has reached a certain overbought level in response to the favorable news. They would do this in anticipation of the market relaxing back as upside momentum wanes and profit-taking activity sets in.
Some contrarian investors look to profit mainly from overvaluation situations that they research and foresee months or years in advance of most others in the market. This can be extremely lucrative, as most markets generally tend to fall must faster than they rise. Nevertheless, many active traders have a considerably shorter time frame in which to assess, make and hold trades that they expect to be profitable. The use of technical analysis can help substantially with optimizing their entry into and exit from shorter term positions.
A technical contrarian trader looking for market tops, generally uses specific price action clues or indicators that signal a market extreme and may combine them with an analysis that shows the deterioration of upside momentum or waning demand.
 What Having a Contrarian Trading Style Looks Like?
Contrarians will sometimes use deep fundamental approaches to researching value in order to identify vulnerable situations where retail players are becoming whipped up either into a buying frenzy by favorable media reports or into a selling frenzy by negative ones. As an example of this type of analysis, contrarian stock traders might pore over financial statements to get the real picture on the prospects for a company’s stock. They might also look for other markets showing signs of fundamental weakness or overvaluation and bet against them.
Furthermore, several contrarian valuation traders, such as Scion Capital’s Michael Burry, used Credit Default Swaps to take short positions on vulnerable mortgage backed securities just before the Subprime Mortgage Crisis hit in 2007. Burry’s astute valuation analysis and sufficiently good timing paid off handsomely for him and his fund’s investors once the tide of market sentiment turned after a wave of mortgage defaults began in earnest as adjustable mortgage rates rose and historically high real estate prices started to collapse.
Contrarians may also use established market evolution analysis methods like Dow Theory or Elliott Wave Theory to determine what psychological phase markets are currently moving through. Contrarians tend to look for markets that have already gone through the strongest part of their trending behavior and are therefore ready to engage in prolonged counter-trend corrections.
Contrarian speculators also tend to look carefully for markets in their final blow out phase where market sentiment is largely one-directional and smaller retail traders are getting in on the trend bandwagon in droves. Usually during this period, the trend’s fires are further fanned by a very favorable outlook by the financial media. These conditions help define the point at which the smart money starts to exit the market and look for attractive levels at which to establish contrarian positions in anticipation of the inevitable market reversal.
Using Market Sentiment Indicators as a Contrarian
Another very helpful type of tool for contrarians consists of the various market sentiment indicators. Although some forex traders now use several popular social trading platforms to gauge currency market sentiment, a traditional example of this type of contrarian indicator would be the Commitment of Traders or COT report that is generally released on a weekly basis each Friday by the Commodity Futures Trading Commission or CFTC.
This detailed position holding report gives contrarian traders a breakdown of the open interest for each Chicago traded futures market as of the immediately preceding Tuesday for those markets where twenty or more traders are holding significant positions that are equivalent to or greater than the CFTC’s established reporting levels.
The COT reports are released in both long and short formats, with the short report displaying open interest broken down by reportable and non-reportable position holders separately. Extra data is provided for reportable positions held by commercial and non-commercial interests. The long COT report contains all of the information in the short report, in addition to sorting the data by crop year if relevant, as well as showing how positions are concentrated by reporting those held by the biggest four and the biggest eight active traders.
These COT reports also show the total futures and option positions of traders broken down into non-commercial and commercial categories, which include actively traded contracts on agricultural, energy and precious metal commodities, interest rates, stock indexes and currency pairs. In addition, the report lists things like spreading, variations from former reports, the percent of open interest listed by category, and the number of traders involved in each category.
Contrarian Technical Analysis
Technical contrarians typically specialize in betting against trends, not in following them. Hence, when used by a contrarian, technical analysis tends to be employed to look for situations that are primed for a significant market reversal.
In practice, this means that contrarians might use oscillators that can identify overbought or oversold market situations that are ripe for reversal. The Relative Strength Index or the Stochastic Oscillator can both be used for this purpose. Moving averages and their crossovers — or a related technical indicator like the MACD — can also be used in this manner.
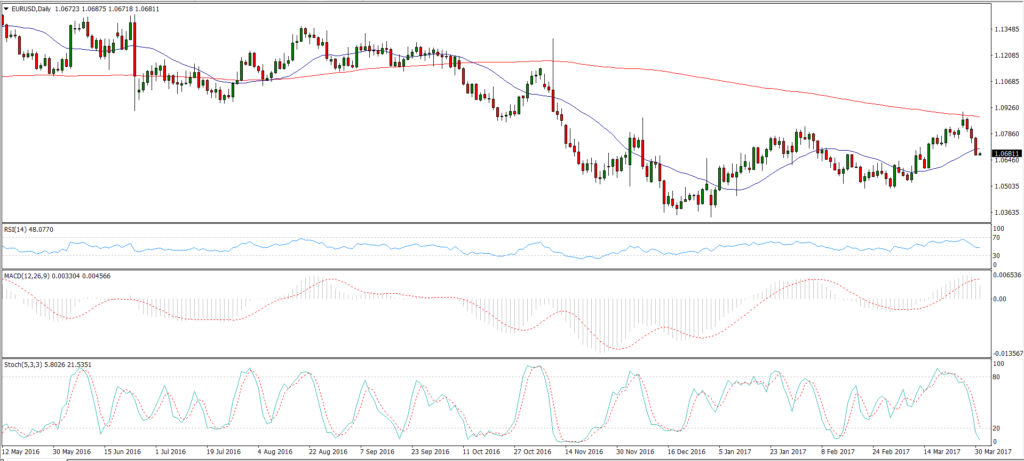
Figure 1 – A set of technical indicators that can be used by contrarians to call market reversals. A contrarian may include a pair of moving averages, the RSI, the Stochastic Oscillator and the MACD.
Contrarians might also employ advanced technical analysis techniques that help them determine the overall phase of the market, like Elliott Wave Theory for example. Elliott Wave Theory postulates that markets tend to evolve in three trending movements, which are separated by two intervening counter-trend corrections, before they then commence to enter a more substantial correction phase.
For instance, when a contrarian determines that a trend is fading and looking like it is approaching the end of its trending phase, which is commonly known by Elliott Wave theorists as the Fifth Wave of a trend, they may start looking for market extreme opportunities to begin trading against the trend. They will usually continue to trade against the preceding trend even more strongly after a notable reversal emerges.
 Choosing a Contrarian Indicator
Rationally determining a suitable market development phase for a contrarian to take a position in opposition to the preceding trend basically comes down to watching for trend reversal signs, overdone market price moves and/or market sentiment extremes.
The choice of a suitable analysis technique for a contrarian to use will also depend to some extent on the time frame upon which they intend to focus. Shorter time frame contrarian strategies will often gravitate toward the use of technical indicators to identify oversold and overbought markets. Indicators like the Relative Strength Index are popular among contrarians who will adjust its parameters suitably to focus on the near term.
Longer term contrarian strategies may focus on fundamental valuation research techniques and seek to identify overdone market sentiment indicators like the aforementioned COT report that is released on a weekly basis.
No matter what type of contrarian analysis is used, a trader seeking to identify a future trend reversal will ideally look for confirmation across several types of signals before pulling the trigger on a major counter-trend trade. They might also test a currently trending market by tentatively trading against it at trend extremes with smaller positions, while then adding more strongly to their contrarian trading positions once a market reversal is actually seen.
Making a Contrarian Trade Plan
Having a trade plan is an invaluable tool for any type of financial market trader, and contrarians are no exception to this general rule. A typical trade plan will lay out in detail how a trader will make decisions under various market conditions and situations.
Most experienced traders believe that developing a clear trade plan that is consistently profitable overall with acceptable drawdowns and then resolving to stick to it in a disciplined manner is one of the keys to operating successfully over the long term as a financial markets trader.
Like just any organized and strategic trader, contrarians will also want to write down their intended trading triggers and indicators into a well-defined trade plan. This detailed plan should be straightforward, easy to follow in practice and should be back tested for profitability and risk over a substantial segment of historical market price data. It can also involve having different trading strategies for different market conditions, such as trending and ranging markets.
For example, a contrarian trading plan might include a signal to short the market when the Relative Strength Index or RSI shows bearish regular divergence versus the price when in overbought territory beyond 70. This particular type of divergence means that the price makes a higher high but the RSI indicator does not, and hence this situation displays a loss of upside momentum that is a fairly reliable bearish signal. Their plan could also include a signal to go long the market when the RSI is reading oversold below the 30 level and also shows bullish regular divergence by the price making a lower low without the RSI doing so.
They could also confirm each of these market reversal signals on the RSI by looking for excessive market sentiment directionality at those points. This is a simplified example, but it servers to illustrate the importance of creating a plan of action and then executing within those predetermined trade parameters.