The RSI indicator is a technical trading tool that falls within the oscillator family. The RSI indicator is considered a leading indicator, which means that its signals typically come prior to a price event on the chart. The positive side of this is that we are able to attain early signals for our trades, but the downside is that many of these signals can be false or premature.
Therefore, the RSI should always be used in a combination with another Forex trading tool or technique for confirmation. In this lesson, we will dissect the RSI indictor and give some best practices for trading with it.
Structure of the RSI Indicator
The RSI indicator was developed by an American mechanical engineer named J. Welles Wilder.
The indicator usually attaches to the bottom of your chart in a separated horizontal window.
The Relative Strength Index technical indicator consists of a single line, which fluctuates between 0-100 area. The area is separated based on three primary zones:
0-30: Oversold Area
30-70: Neutral Area
70-100: Overbought Area
The RSI line moves in and out of these three areas creating different signals on the chart.
RSI Line Calculation
The default RSI setting is typically 14 period. Now let’s dissect the RSI calculation a bit further:
First, let’s take a look at the RSI formula taking the 14-period setting:
RSI = (100 – (100 / (1 + RS)))
RS stands for Relative Strength in the formula above.
This calculation looks pretty straightforward, but we also need to calculate the value of the Relative Strength (RS). This is how you calculate the RS variable:
RS = (14 EMA on the last 14 up bars) / (14 EMA on the last 14 down bars)
After you determine the value of the RS, you can apply the result in the first formula. This will give you the current RSI value.
It works the same time if you change the periods the RSI takes into consideration. If you change the settings to a 20-period RSI, then the second formula will look like this:
RS = (20 EMA on the last 20 up bars) / (20 EMA on the last 20 down bars)
Then you add the result to the first formula for determining the RSI value.
RSI Oscillator Signals
There are three basic signals provided by the Relative Strength Index technical indicator.
Since it is a leading indicator, the signals can typically come prior to the actual price move happening on the chart, depending on what information you use to enter the trade.
RSI Overbought Condition
The first signal we will discuss is the overbought signal. The RSI Indicator gives a signal for an overbought condition when the RSI line enters the 70-100 area.
RSI Oversold Condition
The oversold RSI signal appears when the RSI line enters the 30-0 area. When the RSI is oversold, it implies that the price is likely to increase.
RSI Divergence Signal
RSI Divergence is the last signal we will discuss. As with some other indicators, such as MACD and Stochastics, the Relative Strength Index Indicator can diverge from the overall price action which can provide clues into potential reversals in the market.
Bullish RSI Divergence – Price action is decreasing while the RSI line is increasing; this is a strong bullish signal on the chart.
Bearish RSI Divergence – Price action is increasing, while the RSI line is decreasing; this is a strong bearish signal on the chart.
Metatrader RSI Indicator
The RSI Indicator is built in many trading platforms including the most widely used forex trading platform – MetaTrader 4. You can find the indicator by clicking on Insert > Indicators > Oscillators > Relative Strength Index. The RSI tool then appears automatically at the bottom of your chart in its default 14-period RSI setting.
RSI Analysis in Forex
RSI Analysis in Forex consists mainly of recognizing the signals described above. We will now illustrate each of the signals so you will get a better sense of how to analyze your chart using RSI.
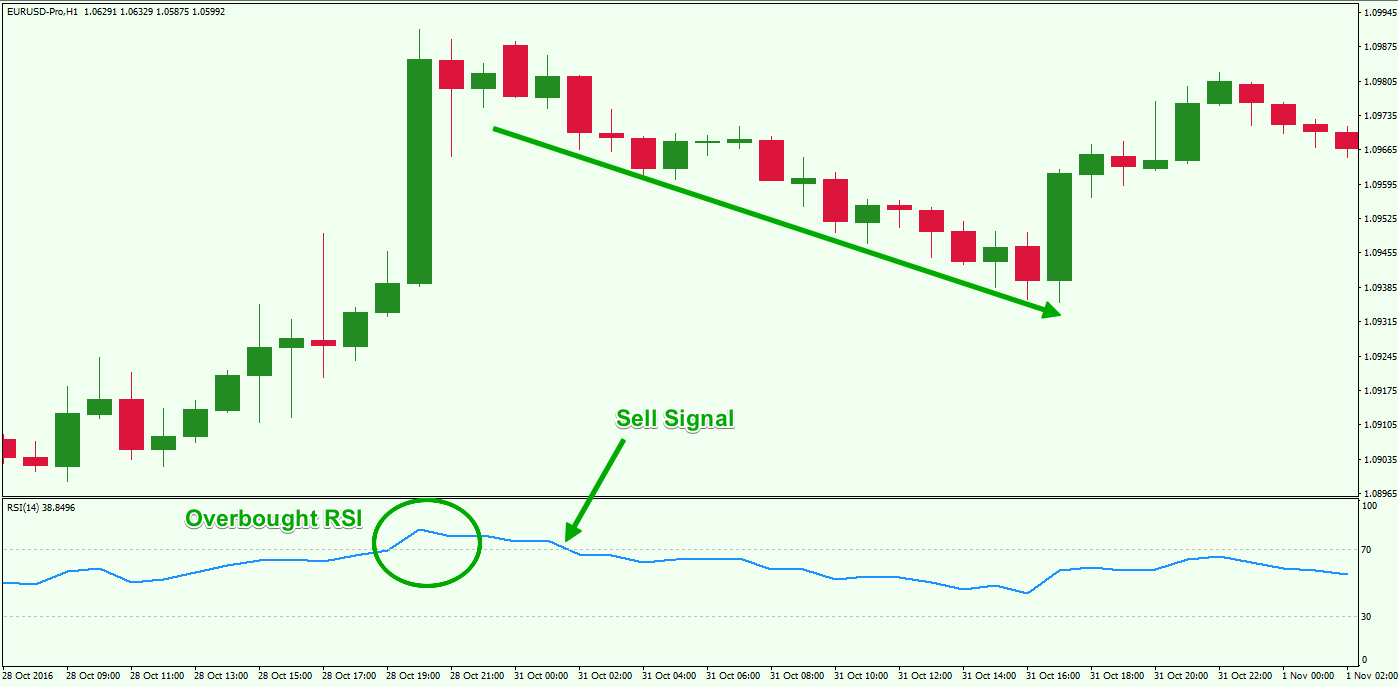
The image above shows how a RSI Overbought signal may appear. The RSI line breaks into the 70-100 area first. This creates the overbought signal. The price then moves out of the overbought zone creating the actual sell signal on the chart. As you see, the price decreases afterwards.
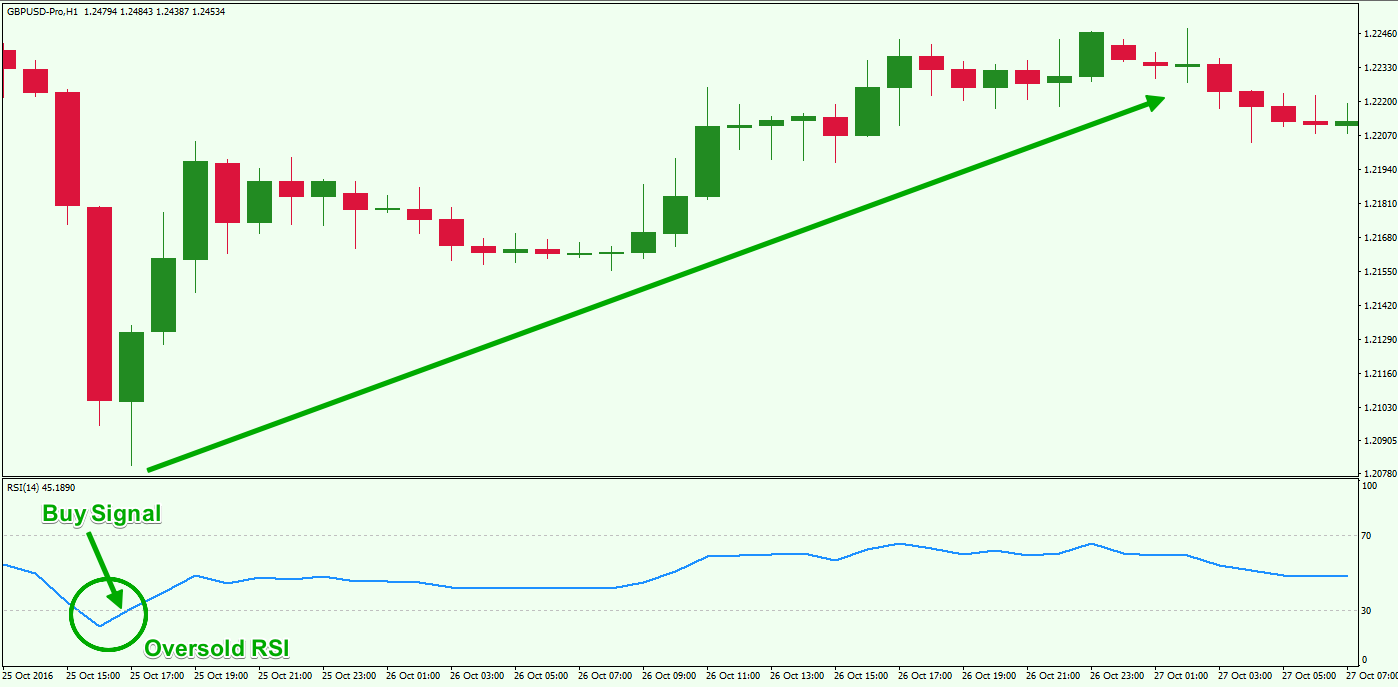
And this is the Oversold RSI signal. The RSI line decreases and enters the 30-0 area creating the signal. The buy indication appears when the RSI line breaks the oversold zone upwards and enters the neutral zone between 30 and 70. As you see, the price action increases afterwards.
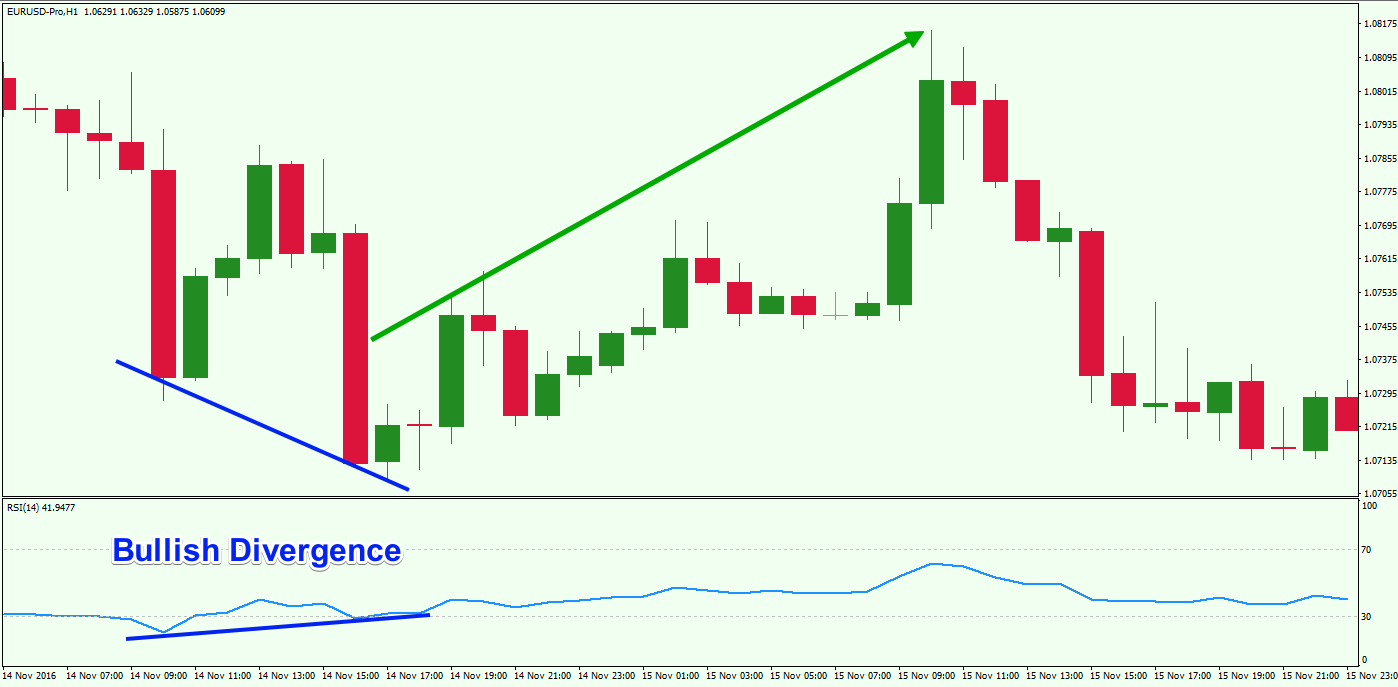
This time we will describe the bullish RSI divergence. The blue line on the price chart indicates that the price action is creating lower bottoms, while the RSI line is increasing. This shows that there is a bullish divergence between the price action and the RSI indicator, meaning that the price of this pair is likely due for an increase. As you can see, this is exactly what happens.
The bearish divergence acts the same way, but in the opposite direction – price action tops are increasing and the RSI tops are decreasing.
RSI Forex Trading Strategy
We will now switch gears and discuss some strategy building ideas with the RSI indicator. We will use the signals described above to set entry and exit points on the chart using the basic RSI rules.
RSI Trade Entry
To enter a RSI trade, you need to see a signal from the RSI indicator. This could be either overbought or oversold RSI, or a RSI divergence pattern.
If you are entering on an overbought/oversold signal, then you would buy/sell the currency pair when the price action exits the respective threshold on the RSI indicator.
If you are trading a divergence with the RSI indicator, then you would enter a trade in the direction of the RSI, after the price action closes two or three candles in a row in the direction of your intended trade.
RSI Stop Loss
As we mentioned earlier, the RSI indicator can give many false or premature signals if used as a standalone tool. Even when combining it with other confirming studies, it is necessary to use a stop loss to protect losses on our trade.
The optimal place for your stop loss order is beyond a recent swing top or bottom, created at the time of the reversal you are trading.
RSI Take Profit
The basic RSI rule states that you should hold your trade until getting an opposite signal from the RSI indicator. Again, this could be an overbought or oversold signal, as well as bullish or bearish RSI divergence. But in the practical sense, it makes sense to take your partial or full profits out earlier using other price action based rules or a trailing stop loss.
RSI Trading System Example
Let take a look at how a basic RSI trading strategy with the rules we discussed earlier could work.
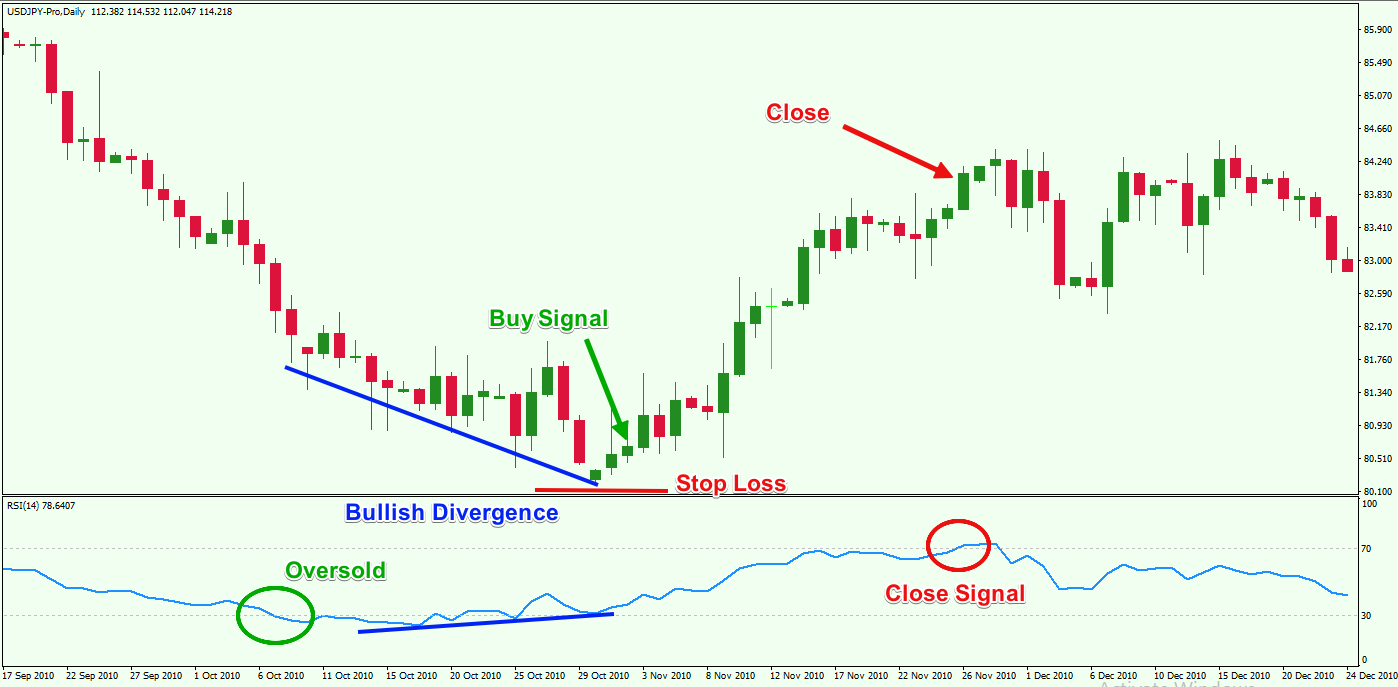
You are looking at the daily USD/JPY Forex chart. The image shows you a trade entry and exit based solely on signals coming from the Relative Strength Index indicator.
The chart starts with a price decrease which is also confirmed by the bearish direction of the RSI line. Suddenly, the RSI line enters the 30-0 area, creating an oversold signal. Shortly afterwards, the RSI line starts increasing, while the price action continues its downward movement. This creates a bullish divergence between the price action and the Relative Strength Index.
Your first thought might be that you should open a long trade at the moment when the RSI line breaks the oversold zone upwards. However, during this time, you identify the bullish divergence, meaning that it might be better to wait for two or three bullish candles in a row as the actual entry signal. This happens, creating a long signal on the chart, meaning that you could buy the USD/JPY Forex pair on the assumption that the price action is currently reversing.
You should place a stop loss order right below the bottom created at the moment of the reversal. This is shown with the red horizontal line on the chart.
The price action increases afterwards and enters a bullish trend. The RSI line increases as well. The trade could be held at least until the RSI indicator reaches the 50 mark, at which point you could close a portion of your position.
Alternatively, you could decide to use some other price action clues that provide sufficient evidence to close the trade. But absent that, it would be wise to exit the trade in full when RSI reaches the overbought threshold of 70. The red circle on the chart shows the moment when the RSI indicator enters the overbought area, creating a close signal.
Price Action Trading and RSI
Using the RSI indicator in isolation will not likely create a profitable trading strategy over the long run. As with most other leading indicators, the Relative Strength Index can be prone to giving false signals. Therefore, you should incorporate an approach that will allow you to isolate as many false signals as possible, increasing your Win-Loss ratio. In this next section, we will discuss some of the way you can use the RSI tool in combination with price action to increase your chances of a winning trade.
Entering RSI Price Action Trade
You would look to open your trade when you find a RSI signal confirming the direction. However, you will also confirm the price direction with a price action pattern. This could be a candlestick pattern or a chart pattern, as well as a trend line, channel, ascending or descending tops and bottoms, etc.
Stop Loss on RSI Price Action Trade
The stop loss order should be positioned according to the basic RSI rules we discussed above. When you identify the turning point on the chart, you should place your stop above that most recent swing.
Taking Profit on RSI Price Action Trade
When you see, an opposite signal coming from the RSI, you should close your trade on the assumption that the price action is likely to reverse. However, if you spot a price action clue that provides evidence for the end of the price move, you should also take that into consideration for closing the trade.
Let’s take a look at a chart that illustrates RSI used in combination with price action trading:
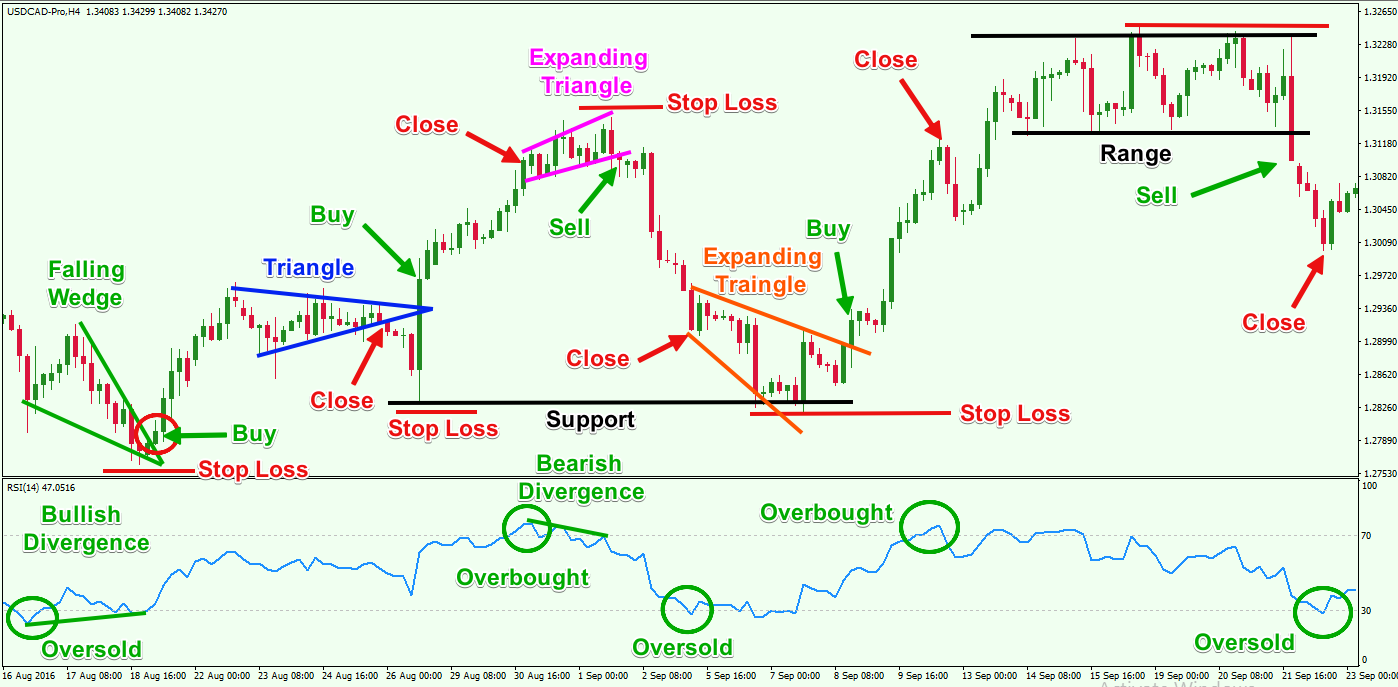
In the above image, we are looking at the H4 chart of the USD/CAD. The image illustrates 5 trade setups based on RSI signals combined with price action.
- The first trade comes after the initial price decrease. The RSI enters the oversold area and creates a bullish divergence as well. At the same time, the price action breaks a Falling Wedge in bullish direction. So, we have a bullish price action signal and two bullish RSI signals. Therefore, you could buy the USD/CAD placing a stop loss below the bottom created at the time of the wedge breakout.
The price enters a consolidation afterwards creating the blue triangle on the chart. The triangle breaks through the lower level creating an exit signal.
- However, the bearish triangle breakout appears to be a false signal. The USD/CAD reverses and breaks the triangle upwards. Therefore, you can use this event to reopen your bullish trade placing a stop loss order below the created bottom under the blue triangle.
A closing signal appears when the RSI line enters the overbought area.
- Now we see the RSI line enters the overbought area. It breaks out afterwards and the line starts decreasing. However, the price action is still increasing, which creates a bearish divergence. At the same time, an Expanding Triangle is formed on the chart. The triangle has bearish potential and the breakout through its lower level should be used as an entry signal for a short trade.
The stop loss of the trade should be positioned above the top of the Expanding Triangle. The position should be closed when the RSI line enters the oversold area.
- Now that the RSI enters the oversold area, we get a new bullish signal. However, a bullish price action signal is needed as well. Fortunately, another Expanding Triangle appears on the chart that has bullish potential. Also, take note that the end of the triangle meets a support area (black) which indicates the potential bottom below the blue triangle. This increases the chances that the price will initiate a bullish move. Therefore, you could open a long trade when the price breaks the Expanding Triangle upwards.
The stop loss on the trade should be positioned below the bottom of the Expanding Triangle. You could exit the trade when the RSI enters the overbought area.
- The RSI line keeps bouncing in and out of the overbought area. In the meantime, the price action creates a range, which could be seen in the black channel on the chart. You could open a short trade at the moment when the price action breaks the range downwards.
Then you should place a stop loss order above the top of the range. Your trade should be closed when the RSI enters the oversold area.
Conclusion
- The Relative Strength Index (RSI) was developed by J. Welles Wilder and it is considered a leading technical indicator (oscillator).
- The indicator consists of a single line, which moves between three zones:
- Overbought Zone: 70-100
- Oversold Zone: 0-30
- Neutral Zone: 30-70
- The default RSI settings is 14-period. There are two formulas used to calculate the RSI value:
- RSI = (100 – (100 / (1 + RS)))
- RS = (14 EMA on the last 14 up bars) / (14 EMA on the last 14 down bars)
- There are three basic signals coming from the RSI Forex indicator:
- RSI Overbought Signal – The RSI line is in the 70-100 area.
- RSI Oversold Signal – The RSI lien is in the 0-30 area.
- RSI Divergence
- Bullish RSI divergence – The price is decreasing while the RSI line is increasing.
- Bearish RSI divergence – The price is increasing while the RSI line is decreasing.
- The Relative Strength Index is built in the MetaTrader4 forex platform. You can add it to your chart by going to Insert > Indicators > Oscillators > Relative Strength Index.
- The basic RSI trading strategy involves these rules:
- Enter a trade when you get an RSI signal on the chart – overbought, oversold, or divergence. Enter in the direction of the signal.
- Put a stop loss order beyond the top/bottom created at the moment of the reversal.
- Stay in the trade until the RSI gives you an opposite signal.
- The RSI indicator is not great as a standalone tool and can give many false signals. Therefore, you should add another tool or study on the chart to filter fake signals. A good way to do this is by using price action rules and chart analysis.