There are many different forms of technical analysis methods used by traders. One of the more common approaches is to trade using classical chart patterns. In this lesson, we’re going to take a deep dive into one of those classical chart patterns, the pennant pattern. You’ll learn how to identify a pennant pattern, compare and contrast it to other similar patterns, and build an effective strategy for trading it in any market.
What Is The Pennant Chart Pattern?
A pennant is a continuation chart pattern that often precedes a price move in the direction of the prior trend leg. It has the characteristics of a quiet time within the market or a short consolidation phase. In terms of the appearance of the pennant formation, it resembles a small symmetrical triangle with converging trendlines that contain the price action. Pennants can be described as bullish or bearish in nature depending on its potential future price direction following the breakout from the structure.
Along with flag formations, pennant patterns are among the most reliable chart based trading patterns. And in most cases pennants offer a solid risk reward profile when traded correctly. We will be comparing and contrasting the flag versus pennant chart pattern in a later section, but for now, it’s important to understand that one of the main differentiating factors between a flag and pennant pattern is in the appearance of the support and resistance lines within the formations. Specifically, a flag pattern has two parallel channel lines which make up the formation, whereas in the pennant pattern, the support and resistance lines converge towards an apex.
In markets where the volume figures are readily available, such as the stock market and futures markets, it is useful to analyze the breakout from a pennant technical formation alongside volume. However, in the forex market where the volume figures are not really available, we can use momentum indicators to gauge the strength of the breakout. For traders, who prefer to ride the underlying trend of the market, pennant patterns offer an excellent opportunity to trade with the trend. Although pennant formations are fairly easy to recognize on the price chart, we must take care in entering trades at the most opportune times in order to avoid fakeouts that can and do occur from time to time.
It’s important to understand that pennant patterns are fractal in nature, meaning that they can occur at all degrees of trend from the shortest to the longest. Additionally they can form in any freely traded liquid market.
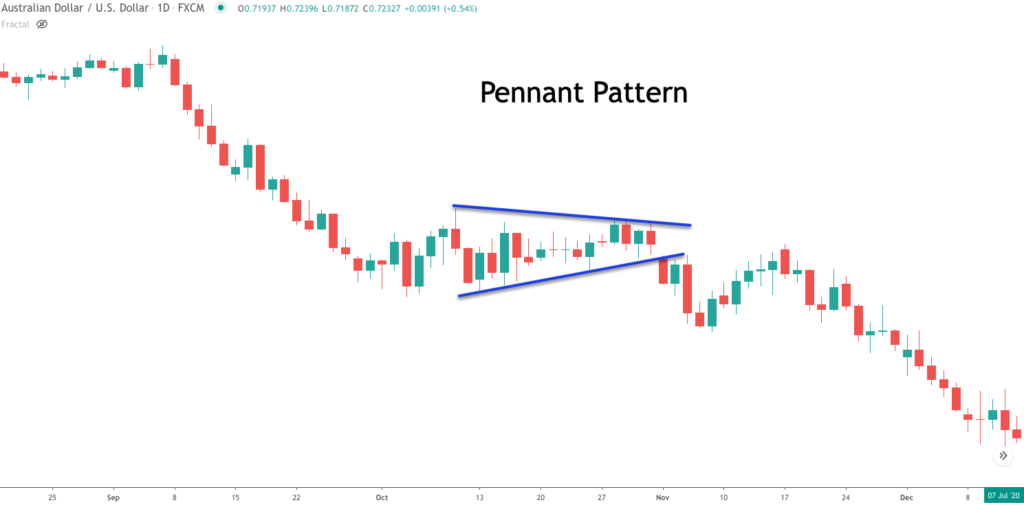
Below you will find an example of a pennant formation shown on the price chart.
Recognizing The Pennant Technical Formation
Now that you have a basic understanding of what the pennant formation looks like on the price chart, let’s continue along the same lines as we dissect this formation further. So what are some of the primary characteristics that we should look for to confirm the pennant chart pattern?
Below are listed a few key elements to look for when trying to label a chart pattern as a pennant.
Prior Impulsive Move – there should exist a sharp price move prior to the consolidation phase within the pennant formation. This impulsive move is often seen as the flagpole. The price behavior in the case of a bullish movement higher should be accompanied on high-volume and strong momentum, with a large percentage of up bars. And the price behavior in the case of a bearish movement lower should be accompanied on high-volume and increasing momentum as well, but with a large percentage of down bars.
Triangle-like Formation – The pennant pattern appears as a shortened triangle within the price action. The duration of a pennant pattern is often much less than that of a traditional triangle formation. As such it should be a relatively brief pause in the price action rather than a sustained sideways price movement. In addition, the volatility within the pennant formations often decreases as the pattern progresses. As such, we should be able to draw two converging lines as support and resistance trendlines around the price action within the pennant.
Strong Breakout – Pennant structures will eventually break out to the side from which the original trend move originated. The candle that breaks out from the pennant formation should do so on high-volume and with increasing momentum. Typically, you will find a bullish marubozu candle that breaks the resistance line of a bullish pennant pattern, and along the same lines, you will often find a bearish marubozu candle that breaks the support line of a bearish pennant pattern.
Bullish Pennant Pattern
A bullish pennant formation provides clues for a price continuation to the upside following the breakout. The confirmation of the breakout occurs upon a candle close above the resistance line of pennant pattern. When this occurs, we expect price to move higher, often with a target that is equivalent to the length of the prior impulsive move, also referred to as the flagpole.
Let’s take a closer look at an illustration of a bullish pennant formation.
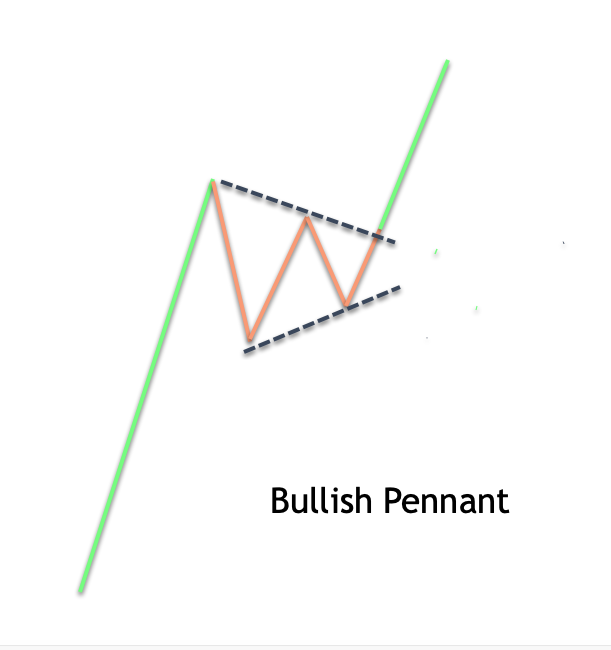
Notice on the image above, the bullish pennant pattern occurs after a sharp price move to the upside. We call this the impulsive leg or the flagpole. Also notice how the bullish pennant pattern appears as a short symmetrical triangle. Can you see how the upper resistance trendline is sloping downward, while the lower support trendline is sloping upward? This creates a convergence of the two trendlines that will lead to a breakout near the apex point.
Furthermore, you would wait until you recognize a strong bullish candle that breaks above the resistance line of the pennant formation and closes above it. Most technical chart traders prefer to enter a long position at the beginning of the following candle following this breakout candle. As for the target price following the breakout, we can use a measured move technique. This means that we would measure the length of the flagpole and project that same length forward from the breakout point as the potential target.
The psychology within the bullish pennant pattern can be explained as a period wherein the bulls who got in on the trend early are now looking to lock in some of those profits. This is what causes the brief consolidation, which will ultimately lead to another push higher.
Bearish Pennant Pattern
A bearish pennant structure indicates selling pressure on the price following the breakout. The confirmation of a bearish pennant pattern comes after a breakout and close below the support line of the formation. When this happens, we would anticipate prices to move lower, with the target price that is the same as the distance traveled in the prior flagpole.
You will find an illustration of the bearish pennant pattern below.
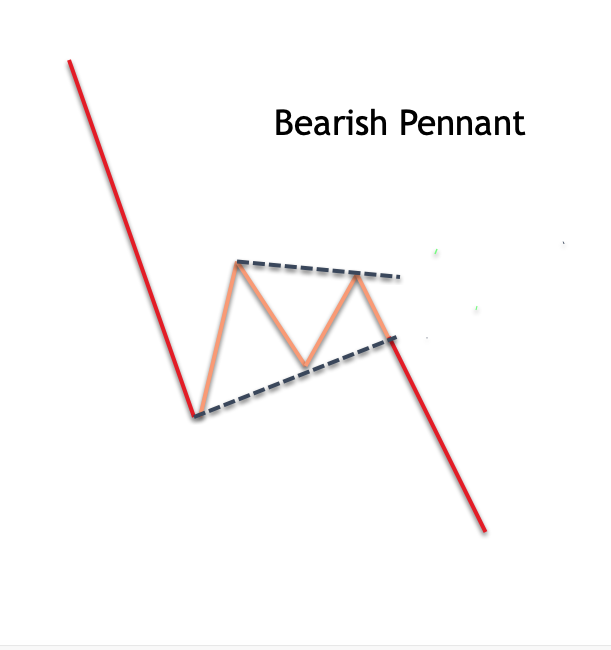
The bearish pennant pattern can be seen following a strong price movement to the downside, which is often seen as an impulsive leg. We refer to this impulsive leg as the flagpole. As with the bullish variation of this pattern, the bearish pennant appears as a short pause within the price action and resembles a shortened version of a contracting or symmetrical triangle. The price action will be contained within this contracting structure, and we can expect a breakout to the downside as the price progresses towards the apex point.
We want to see a break and close below the support line to confirm a valid bearish pennant. This is often seen with a bearish marubozu candle. The target price measurement works similar to the method we discussed earlier. That is to say that we will measure the length of the flagpole and project that lower from the breakout point to come up with a level that the price should fall to within the subsequent leg.
Essentially in a bearish pennant pattern, many sellers who have realized a healthy profit from the previous impulsive move down, are taking some of those profits off the table. Soon after this period of relative quiet ends, we can expect another push lower as the selling pressure intensifies once again.
Pennant Patterns vs. Flag Patterns
Both Pennants and Flags are considered continuation patterns and display congestive behavior. It’s as if the market is taking a breather following a sharp price move. There are however a few key differences that we should be aware of when labeling a chart pattern as a pennant versus a flag.
Even though the price following a breakout from either the flag or pennant pattern will result in a price move in the same direction from which it came, we still need to try to correctly label it so as to ensure the correct construction of the trendlines that contain the price action within the patterns.
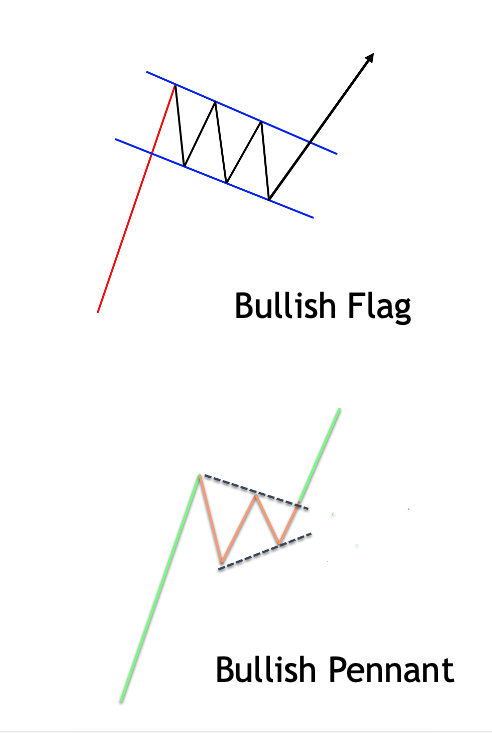
As we’ve mentioned earlier a pennant pattern is similar to a symmetrical triangle formation. However, the duration of a pennant pattern is typically much less than the duration of a traditional triangle structure. The trendlines that comprise the pennant formation are contracting in nature.
The flag formation on the other hand resembles a lightning bolt or zigzag formation. The trendlines that compose the flag pattern are parallel in nature, and appear as traditional price channels. But unlike traditional price channels, flag patterns are also relatively short in duration. Sometimes the flag pattern appears as a rectangle formation rather than as a zigzag formation. Regardless, the implications are the same.
You can see a side-by-side comparison of a pennant formation versus a flat formation on the illustration below:
Technical Analysis Using Pennant Chart Pattern
By now you should have a good understanding of pennant formations, and some best practices for correctly labeling such a pattern. We will now expand on that knowledge and begin to create a trading strategy around the pennant chart pattern. As with any viable trading strategy, we need to create rules for each component within the strategy, so that there is little if any ambivalence when the right pennant trade setup appears in front of us.
Our trading strategy should start with trend identification. When we are trading a pennant pattern, trend identification becomes a bit easier since one of the characteristics of a valid pennant pattern requires a strong price move prior to its formation. As a result, we will need to evaluate the price move within the flagpole to ensure that it displays impulsive characteristics.
As a continuation pattern, we would expect that the pennant formation should not retrace more than 50% of the previous price leg. In the event that it does, the chances of a significant rebound in the direction of the prior trend begins to diminish. As a result we will use the 50% retracement level as our maximum limit for trading the pattern.
These are the two primary conditions that must be met for this pennant trading strategy.
Let’s now outline the rules for entering a long position:
- The flagpole of the pennant pattern must display strong bullish characteristics in the price action.
- The extreme swing low within the pennant pattern must not exceed the 50% retracement of the prior move, the flagpole.
- Enter a buy order, when the price breaks out and closes above the resistance trend line of the pennant pattern. This will serve as the pennant pattern signal.
- Stop loss to be placed at a recent swing low below the breakout point.
- Targets will be calculated using the measured move technique. Target 1 will be set at 50% of the length of the flagpole and Target 2 will be set at 100% of the length of the flagpole, measured from the breakout point.
The rules for the short position will be the same but in reverse:
- The flagpole of the pennant pattern must display strong bearish characteristics in the price action.
- The extreme swing high within the pennant pattern must not exceed the 50% retracement of the prior move, the flagpole.
- Enter a sell order, when the price breaks out and closes below the support trend line of the pennant pattern
- Stop loss to be placed at a recent swing high above the breakout point.
- Target 1 will be set at 50% of the length of the flagpole and Target 2 will be set at 100% of the length of the flagpole, measured from the breakout point.
Pennant Trading Strategy Example 1
Let’s now apply the rules for the pennant trading strategy that we created earlier to an actual price chart. Below you will find the price chart for the Australian Dollar to US Dollar currency pair.
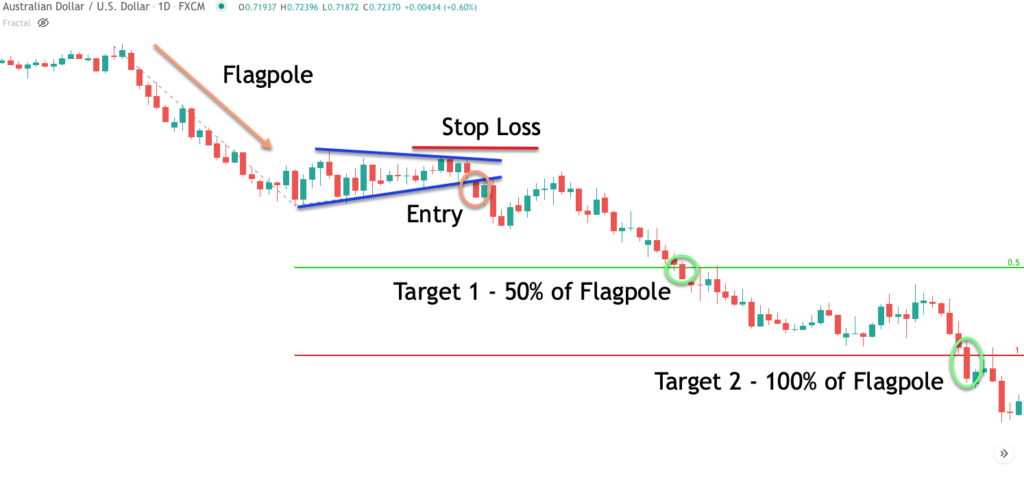
Once we recognize a consolidation pattern that could be a potential forex pennant pattern, you want to take the necessary steps to ensure that our criteria for such a pattern has been met. The very first thing that we want to do is to look back in the price action and see if we can recognize a strong impulsive price move leading up to the pennant pattern. This is what’s referred to as the flagpole component. Now with that said, we can see the strong bearish price move that occurred just before the consolidation phase of our potential pennant continuation pattern. Notice how there are a large percentage of red candles that make up the sharp move lower.
So now that we have confirmed that characteristic, we can move along to analyze the second component of our trade strategy. So what is that second component that we will need to analyze?
Well, if you recall we want to ensure that the extreme swing high within the pattern does not exceed the 50% retracement of the prior move the flagpole. Now, although it’s not marked, it’s fairly obvious from the chart that the retracement against the flagpole did not exceed the 50% mark. And so the second condition for the Bearish pennant has been satisfied.
Now that our two primary trading filters have passed the test, we want to prepare ourselves for a downside break to enter a short position. The sell order to go short occurs when the price breaks below and closes below the support line of the pennant pattern. We can see that event triggered on the price chart as shown within the orange circled area and noted as entry.
Immediately following our short entry, we need to place a stoploss order to protect ourselves in case our analysis turns out to be incorrect. The stop loss placement per our rules would be entered just beyond the recent swing high prior to the entry signal. The red line above our entry signal shows where that stoploss placement should be.
What about our take profit exit? Where will we get out on this trade? Our strategy calls for a tiered exit plan. The first target will be at the 50% projection of the flagpole as measured from the breakout point. This is noted on the chart as target 1 and circled in green.
Our second and final target will be at the 100% projection of the flagpole as measured from the breakout point. You can see that level marked as the lower red line on the chart. You will also see the bar that triggered our second target circled in green as well.
Pennant Trading Strategy Example 2
Let’s look at another example of trading pennants in the context of the strategy that we’ve described. This example will also be of a bearish variety of the pennant pattern in forex. The chart below shows the price action of the Euro Yen currency pair based on the 480 minute timeframe.
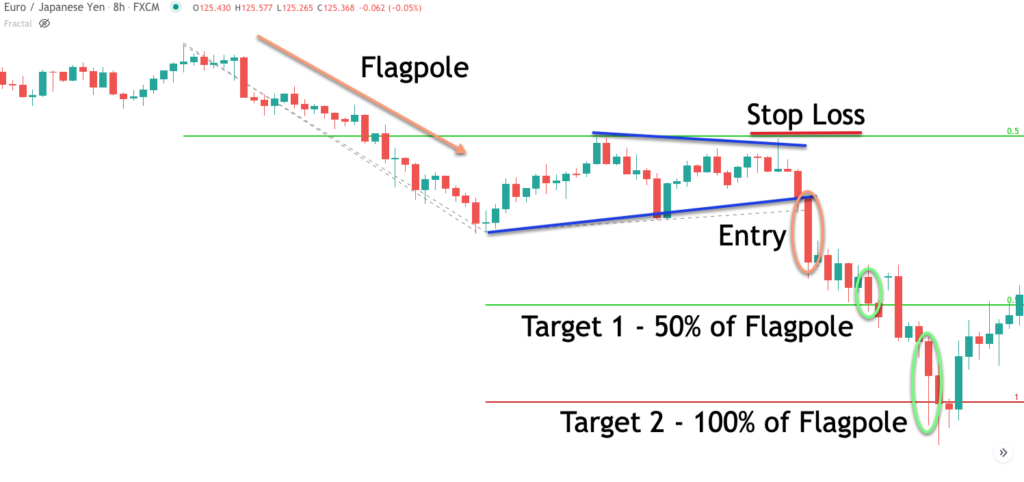
Starting from the left side of the chart, we can see a sharp move lower that forms the flagpole. Notice how there is a large percentage of red bearish candles compared to green bullish candles. This is an indication of a strong bearish impulsive price move. You can see that the pennant formation has been outlined with the two converging trendlines.
Furthermore, I have plotted the 50% Fibonacci retracement of the flagpole. Recall that for the purposes of our pennant trading method, we do not want prices to retrace more than 50% of the flagpole. If you look closely, you will see that as the pennant was forming, that it’s extreme swing high moved just below the 50% retracement level before resuming back to the downside. A second test of the 50% retracement level occurred sometime afterwards, but again was rejected from that level. As such our Fibonacci based filter has been satisfied for this set up.
Our entry trigger will be a breakout and close below the support line of the pennant pattern. Notice here that entry occurred quite a bit below the support level just one bar prior. In any case, this would have served as the entry trigger for the trade.
Sometimes when the entry trigger is quite a distance away from the breakout point, it might make sense to wait for a possible pullback to get a more favorable execution price. However, the risk in doing so is that there is no guarantee that the price will actually retrace to give us that opportunity. In this case, based on our simplified rules, we would have gone short on the bar following the breakout close as shown by the orange circled area.
Our two-tier target is also shown on the price chart. The first target was reached a short time after the entry, and represents the price that measures 50% the length of the flagpole measured from the breakout point. And the second target would be set at the price which equates to the 100% length of the flagpole measured from the breakout point. Notice how the price reaches our second target, and soon afterwards begins to find demand in the market from buyers that act to push the price higher once again.
Summary
The pennant pattern is a popular chart pattern used by many technical analysts. It can be applied to any number of financial markets, and can be found at all degrees of trend from the very minor to the very long term. It’s a simple pattern to recognize on the price chart, however, there are some nuances in correctly labeling it.
We outlined some of the best practices in identifying the pennant pattern, some of the differences between it and other classical patterns, and shown a method for trading the pennant within a trend. It’s a simple chart pattern that you should consider adding to your trading arsenal because it provides for a high probability of success when applied correctly.