The rectangle chart formation is considered a part of the family of classical chart patterns within technical analysis. It is one of the more easily recognizable chart formations, and is a fairly simple pattern to trade. We will review some of the basics of identifying this structure, and provide some best practices for incorporating it within your own trading arsenal.
Rectangle Pattern In Technical Analysis
The rectangle technical pattern is a classical chart pattern that appears as a well-defined trading range. It is typically considered a continuation type pattern and serves as a temporary pause within the market. After which, another price leg forms in the direction of the preceding trend. Rectangle patterns are fairly easy to recognize on the price chart.
Essentially, to identify a rectangle pattern, you will need two swing highs that occur along the same line, and two swing lows that can be seen along the same line. When you plot a horizontal line connecting the two swing lows and the two swing highs, it will appear as a horizontal parallel channel that contains the price action. Below you can find an example of a rectangle pattern:
Let’s analyze a few of the primary characteristics of a continuation rectangle pattern, in this case a bullish version.
First and foremost, we need to ensure that we are correctly labeling a structure as a rectangle formation. As we’ve noted, the rectangle formation should appear as a trading range or consolidation phase with two swing highs, and two swing lows that occur along the same plane respectively. As the chart shows this is clearly the case in this example.
Next, we want to make sure that there is a clear trend leading up to the rectangle chart formation. This will provide us the best expectation for the future breakout from the rectangle formation. In the case of an uptrend, we would expect a bullish breakout from the rectangle formation. Conversely, in the case of a downtrend, we would expect a bearish breakout from the rectangle formation. In this example, we can see that the trend is up prior to the rectangle formation. As such we would anticipate a breakout of the resistance level, and a subsequent price increase.
In addition to this, we want to analyze the overall structure of the rectangle pattern. More specifically, we want to ensure that there are at least 40 bars that make up the rectangle formation. Now, this is a general guideline to keep in mind and not necessarily a hard and fast rule. The reason for this, is that the best rectangle formations tend to be a prolonged consolidation phase. As such, we want to ensure that the structure is relatively significant and one that provides a viable trading opportunity.
Although we have been discussing rectangle patterns as continuation patterns, they can also display countertrend characteristics from time to time. This is particularly true when we are looking at rectangle top and rectangle bottom formations. Unfortunately, it is quite difficult to gauge beforehand whether a rectangle pattern will materialize into a continuation pattern, or reversal pattern. Having said that, the most dominant type of rectangle pattern seen in the market is the continuation pattern. And so, rectangle tops and bottoms as reversal structures should be in the back of our mind, but the highest probability play is to the trade the structure as a continuation pattern.
Rectangle Trading Pattern Dynamics
We should always attempt to understand the underlying dynamics within various price structures, and the rectangle pattern is no exception. So what is the psychology within a rectangle pattern? What is going on behind the scenes?
Well, we know that the rectangle pattern is a consolidation pattern with trading occurring within two well defined price levels, and upper resistance level, and a lower support level. If you look at this phenomenon at a deeper level, you will come to realize that what is actually occurring during this time, is that the market is in equilibrium, with the bulls and bears having an equal amount of conviction. This is why the price trades up and down within a clearly defined range.
As the price moves higher, supply from sellers comes in to push prices lower, and similarly, as price moves lower, demand enters the market via the buyers pushing the prices higher. Ultimately, the price will give way and either the bulls or bears will take control. A potential breakout to the upside signals that the bulls are in control, while a breakout to the downside signals that the bears are in control.
Another way to view the underlying market psychology within this congestion phase is as a period of complacency or profit-taking. During a rectangle formation, some traders who have realized profits from the prior leg are now taking profits on their positions. This often creates that prolonged sideways price movement that is indicative of rectangle formations.
Rectangle Breakout and Continuation
Now let’s dive a little bit deeper and talk about how we might go about trading a rectangle pattern breakout. Obviously, we will first need to identify the rectangle structure. Once we have done so, we will draw our support levels connecting the two swing lows that lie along the same plane, and the two swing highs that lie along the same plane.
Once we have the price action contained within the newly formed sideways parallel channel, we will want to wait for a breakout and close above the resistance line in the case of an upside breakout, and below the support line in case of a downside breakout.
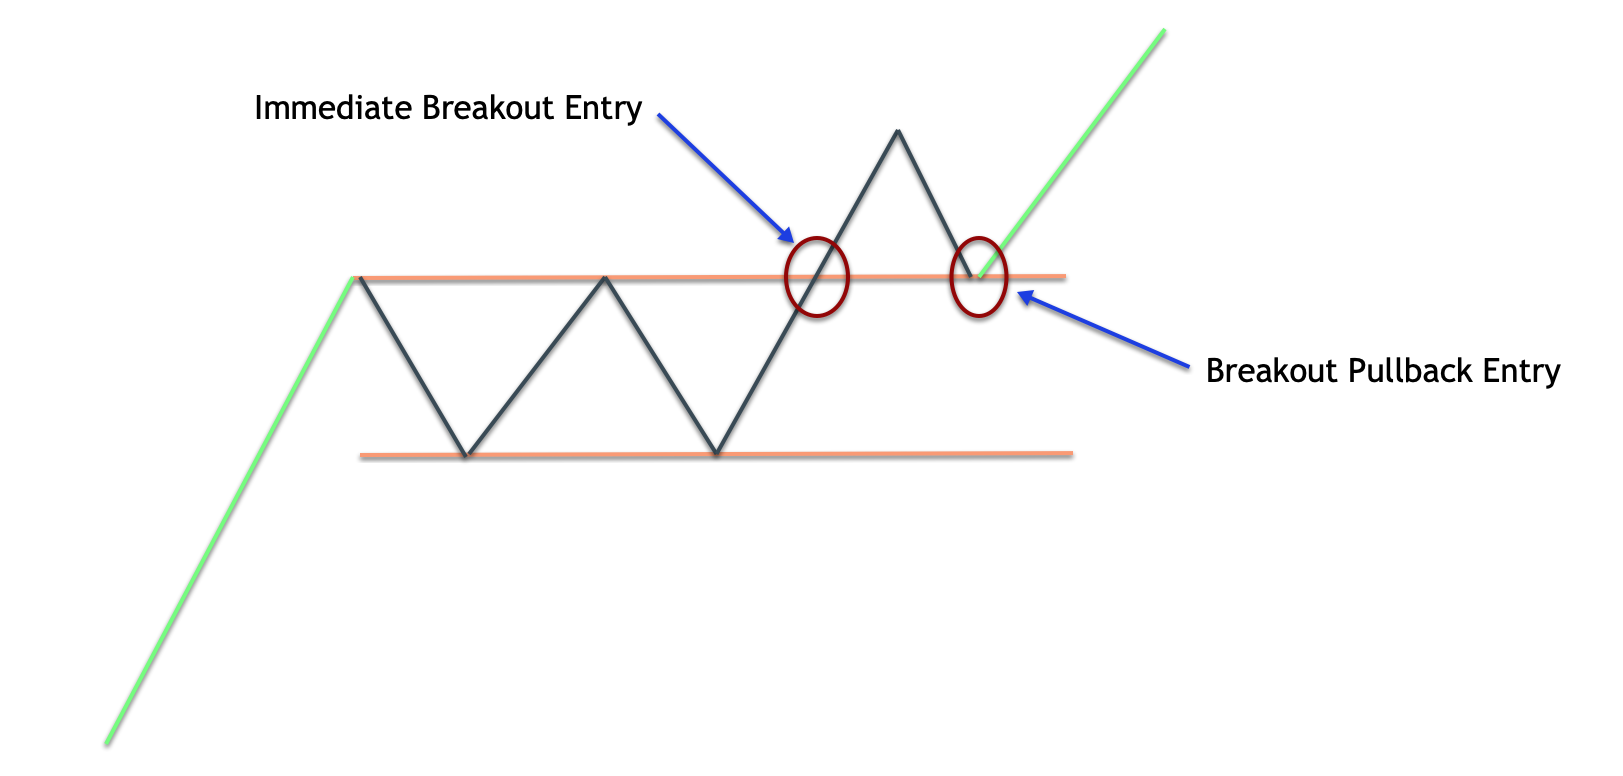
Once this important breakout event occurs, we can either enter into the trade immediately following the close of the breakout candle, or we can wait for a potential pullback to the broken horizontal level, and execute a trade near that area. The choice of which rectangle breakout method you should utilize depends on your own trading style and preference. Keep in mind that each type of breakout trade described will have its advantages and disadvantages.
For example, entering a trade immediately after the breakout close has been confirmed, will allow you to participate in every market move following the breakout confirmation signal. The downside to this method comes in the form of an entry price that may be less than ideal. For example, the breakout candle could be a wide range bar that penetrates quite a bit beyond the horizontal price level. This can have the effect of entering a position that has stretched too far and is now more prone to a retracement, which could put you at a higher risk of getting stopped out.
So what about waiting for a pullback following the confirmed rectangle breakout? In that case, you will usually wait for prices to retrace back to the horizontal price level, and execute a limit order entry near that level, as prices are moving towards it. Alternatively, you could use some price action signal near the horizontal line as a confirmation signal.
Either way, the major advantage to this entry execution strategy is that it will likely provide a much better price for your trade, allowing you to realize a much healthier reward to risk ratio on your position. Now, the drawback of the breakout pullback method for trading the rectangle formation, is that, such an event may never be realized. That is to say that prices could continue to move in the direction of the breakout in an accelerated manner, leaving no opportunity for prices to return back to the breakout level. In such an event, we would incur the opportunity cost of not having participated in that specific trade. Below you can see an illustration of the immediate breakout close entry, and the breakout pullback entry within the rectangle structure.
Rectangle Trading Strategy
Let’s now start to build a rectangle strategy that seeks to trade breakouts. As we’ve noted, a majority of rectangle formations tend to be continuation patterns. As such, we will focus on trading in the direction of a breakout that is in alignment with the larger trend. In other words, we will seek to trade an upside breakout from a rectangle formation when we have a discernible bullish trend leading up to the rectangle formation.
And along the same lines, we will look to trade a downside breakout from a rectangle structure when we can recognize a bearish price trend preceding the rectangle pattern. Along with these conditions, we will also incorporate the momentum technical indicator, which will help us to validate the strength of the breakout. As you should be aware, breakouts from rectangle pattern trading ranges tend to be much more significant when there is strong underlying momentum behind the move. This helps to validate the breakout signal, and helps reduce the number of fake outs that can occur near horizontal price levels.
So here are the rules entering into a long position:
- There exists a clearly defined rectangle formation, wherein, the price move leading to the rectangle is of a bullish nature.
- The rectangle structure should be comprised of at least 40 price bars.
- The breakout from the rectangle must occur through the resistance level.
- The breakout candle must penetrate the upper resistance line, and close above it.
- The momentum indicator, with a look back of 10 periods based on the close, should be above the zero line.
- Enter a market order to buy at the start of next candle.
- The stop loss will be placed at the middle point of the rectangle’s trading range.
- The target will be measured using the width of the range. More specifically, the target will be set at the level at which the price would be equal to the width of the range, measured from the breakout point.
And here are the rules entering into a short position:
- There exists a clearly defined rectangle formation, wherein, the price move leading to the rectangle is of a bearish nature.
- The rectangle structure should be comprised of at least 40 price bars.
- The breakout from the rectangle must occur through the support level.
- The breakout candle must penetrate the lower support line, and close below it.
- The momentum indicator, with a look back of 10 periods based on the close, should be below the zero line.
- Enter a market order to sell at the start of next candle.
- The stop loss will be placed at the middle point of the rectangle’s trading range.
- The target will be measured using the width of the range. More specifically, the target will be set at the level at which the price would be equal to the width of the range, measured from the breakout point.
Bullish Rectangle Trade Setup
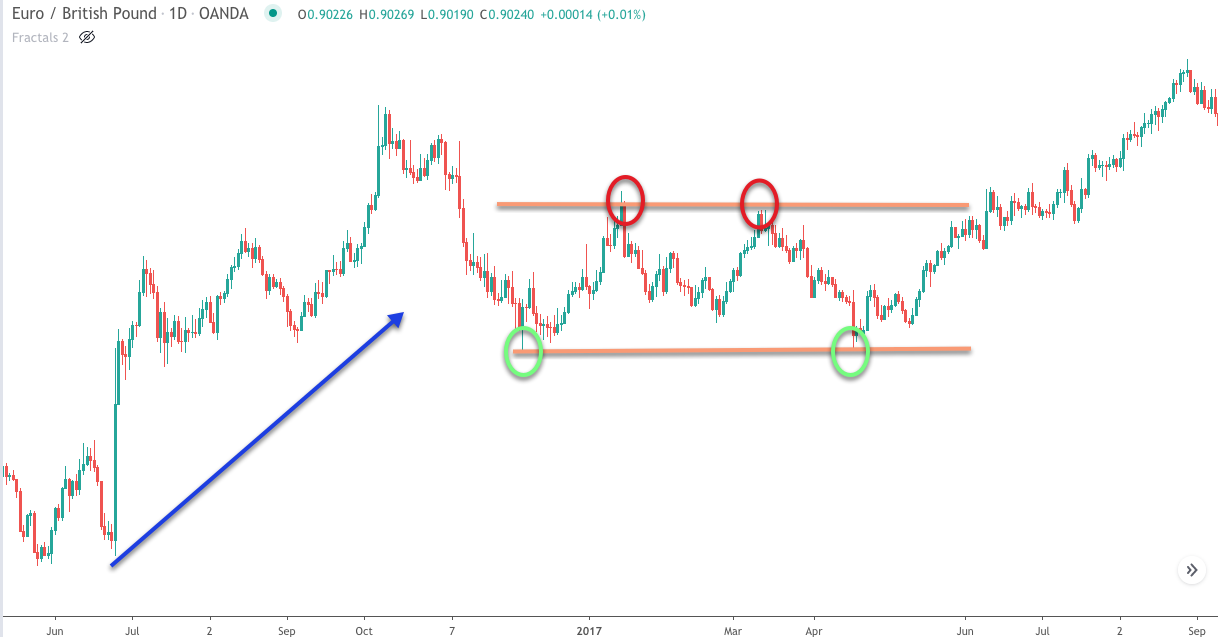
Let’s now take a look at an example of the rectangle breakout strategy that we just described. In this example, we’re going to show the rectangle breakout strategy in the context of an uptrend. Below you will find the price chart for the Euro to British pound forex pair shown on the daily timeframe.
We can see that there was a clear uptrend in the market preceding the range bound price movement which forms the rectangle formation. Notice the series of higher highs and higher lows that make up the up trending market move.
Let’s now take a closer look at the actual rectangle structure. We know that we would need to connect two significant swing highs to form the resistance level of the rectangle, and two significant swing lows that form the support level within the rectangle. We’ve plotted this on the price chart, and we can see that it resembles a sideways parallel channel.
Remember, we want to make sure that the rectangle structure is not just a minor sideways correction, but rather a prolonged sideways price movement. The way that we do this is by counting the bars within the rectangle structure. We want to see a minimum of 40 price bars comprising the rectangle formation. We can clearly see that the structure shown here has many more bars making it up than this minimum requirement.
Now that we have recognized the rectangle structure, and confirmed that it has occurred within the context of a bullish market, we should know that the breakout from the upper resistance line is the level that we will need to watch closely for our entry trigger. As the price progressed within the rectangle formation we can see that the third major test of the resistance level led to a confirmed breakout.
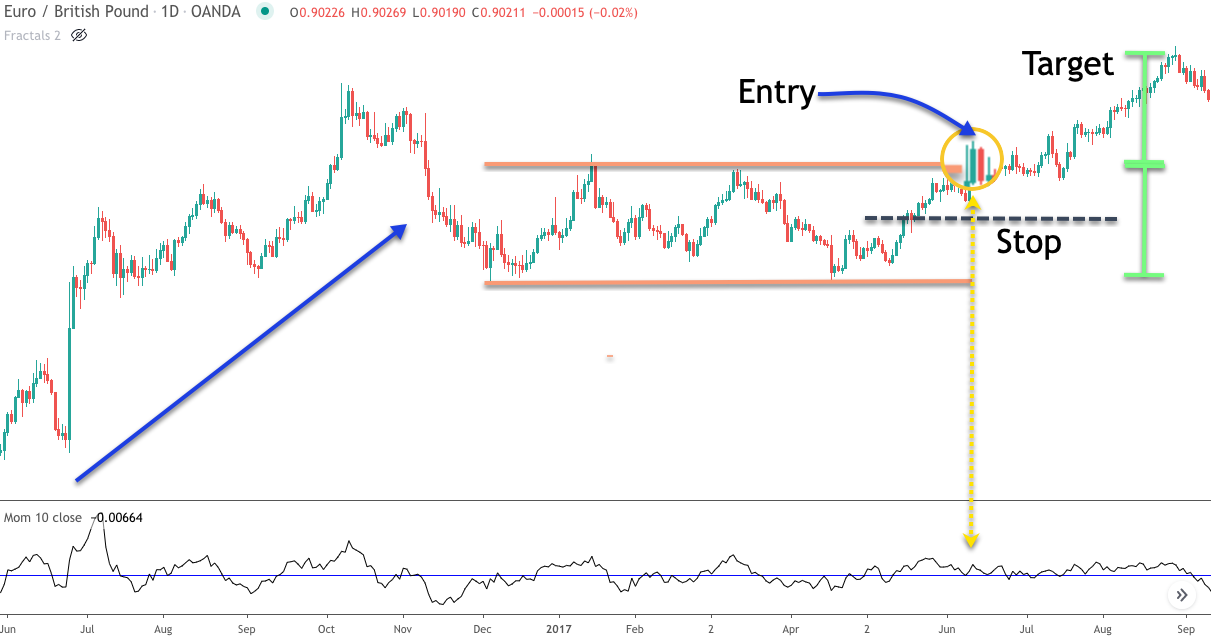
Remember, a confirmed breakout is one wherein the breakout candle penetrates beyond the horizontal line, and closes above it. If you refer to the magnified area on the price chart, you will recognize the bullish candle that ultimately broke above and closed above the upper line of the rectangle structure.
At the same time that this breakout candle occurs, we can see that the momentum indicator, as shown on the lower pane of this chart, was registering a reading above zero. The blue line shown on the momentum indicator represents the zero line. Now that all of our conditions have been met for this bullish rectangle trade set up, we want to prepare for entering our long position. We would enter a market order to buy at the beginning of the very next candle following the breakout candle.
The stop loss for this trade would be placed at the midpoint of the rectangle’s trading range as is illustrated by the black dashed line below the entry signal. Finally, our take profit target would need to be set so that we can exit our trade at the most opportune time.
Based on our rules, the target would be set at a price level at which it would be equivalent to the width of the rectangle itself. And this would be measured from the breakout point. You can see where that exact target would have been triggered by referring to the green vertical brackets which represents a one to one relationship of the rectangle’s range.
Bearish Rectangle Trade Setup
Let’s now move on to our second example. In this example, we will see what the bearish variety of the rectangle pattern in forex appears like. On the chart image below, you will find the price action for the Australian Dollar to Japanese Yen currency pair based on the 240 minute timeframe.
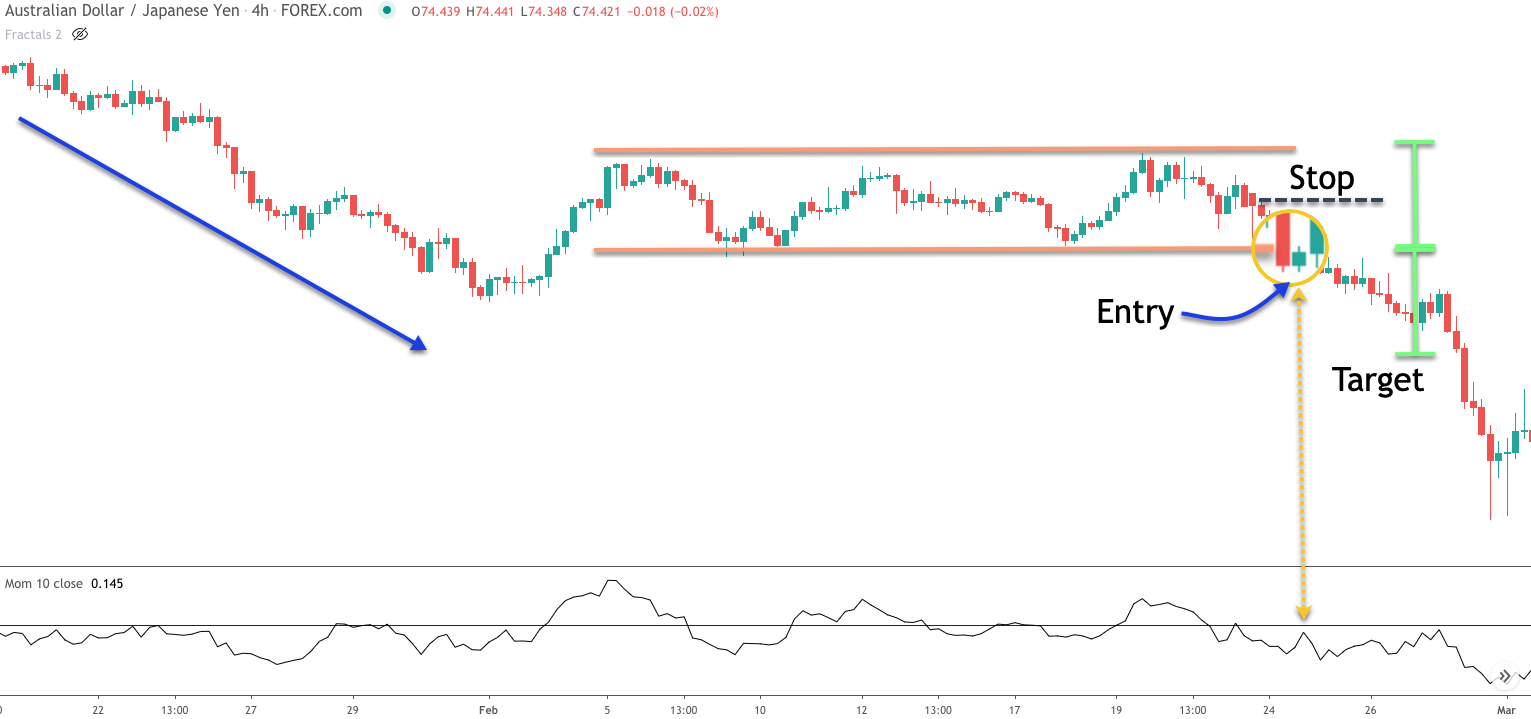
We can see here that there was a clear down trending price movement leading to the rectangle formation. We’ve outlined the upper and lower lines within the rectangle formation, which serves as the resistance and support levels respectively. Additionally, we can confirm that this rectangle structure is a relatively large pattern which exceeds a minimum of 40 price bars. This validates the rectangle pattern based on the trading rules outlined.
As price was trading within this clearly defined range, we can see towards the right end of this chart, that the supply in the market forced a bearish breakout from this rectangle formation. Keep in mind that since the preceding trend was bearish, it is the support line within this rectangle pattern that is of most interest to us. The breakout candle appears as a strong bearish price move. The candle has been magnified for easier viewing, and we can see that it breached below the support line and was able to close below it as well. As such, this can be considered a valid breakout below the rectangle formation.
If we refer to the lower portion of the chart, we can see the momentum indicator plotted. Again, the black line represents the actual momentum indicator reading, while the blue horizontal line represents the zero line. At the time of the breakout, we can see that the momentum indicator was registering a reading that was below the zero threshold. As such, this confirms the bearish rectangle set up based on our trading rules.
Immediately following this event, we would place a sell order at the market. The stop loss would be placed at the center of the rectangle’s trading range. The target point for this trade set up would be calculated using the width of the rectangle’s trading range. More specifically, we will want to exit the trade for profit when the price reaches a level that is equivalent to the width of the rectangle. Essentially, this creates a two to one risk reward ratio for us. We can see from the green vertical brackets on the price chart, which represents this measurement, that our target was easily reached.
Summary
Trading with classical chart patterns is one of the more popular trading methods used by technical analysts. It is a timeless trading technique that offers many advantages. Our focus here has been on one such type of classical pattern, the rectangle formation. We have learned that the rectangle pattern is most often a continuation pattern, offering a solid opportunity to trade in alignment with the larger trend.
We have outlined one specific strategy for trading rectangle patterns, but the pattern can be traded in many different ways. As you gain experience in recognizing these structures on your price chart, you will begin to gain more confidence in executing your own variation of the set up on your preferred instruments.