The MACD is one of the most popular and broadly used indicators for Forex trading. The letters M.A.C.D. is abbreviation for Moving Average Convergence Divergence. The MACD indicator, which requires Moving Averages as its input, falls into the group of the lagging indicators.
The basic function of the MACD Forex indicator is to discover new trends and to help identify the end of current trends. There are various ways to gauge the signals generated by MACD, and many traders use their own unique settings and methods around this trading indicator.
Understanding the MACD Indicator
The MACD indicator is typically placed at the bottom of the trading chart, in a separate window, beneath the price chart.
The Moving Average Convergence Divergence is a relatively easy-to-use tool, however, it is crucial to understand it fully before attempting to trade using its signals.
Let’s take a close look at the structure of the MACD indicator and its default settings.
MACD Structure
The MACD indicator consists of three components. There are two lines and a histogram. Let’s now discuss each of these separately:
- MACD Line – The MACD line is the faster line on the indicator. Since it reacts faster it and is more sensitive, it generally moves above and below the second line of the indicator.
- MACD Signal Line – The MACD signal line is the second line of the MACD indicator. It is called a signal line, because it generates the basic MACD signals. Since the line is slower, it gets frequently breached by the faster MACD line.
- MACD Histogram – The MACD histogram simply represents the difference between the MACD line and the signal line. The bigger the gap between the lines, the higher the bars that the MACD histogram will display.
Below you will see an example of the MACD indicator:
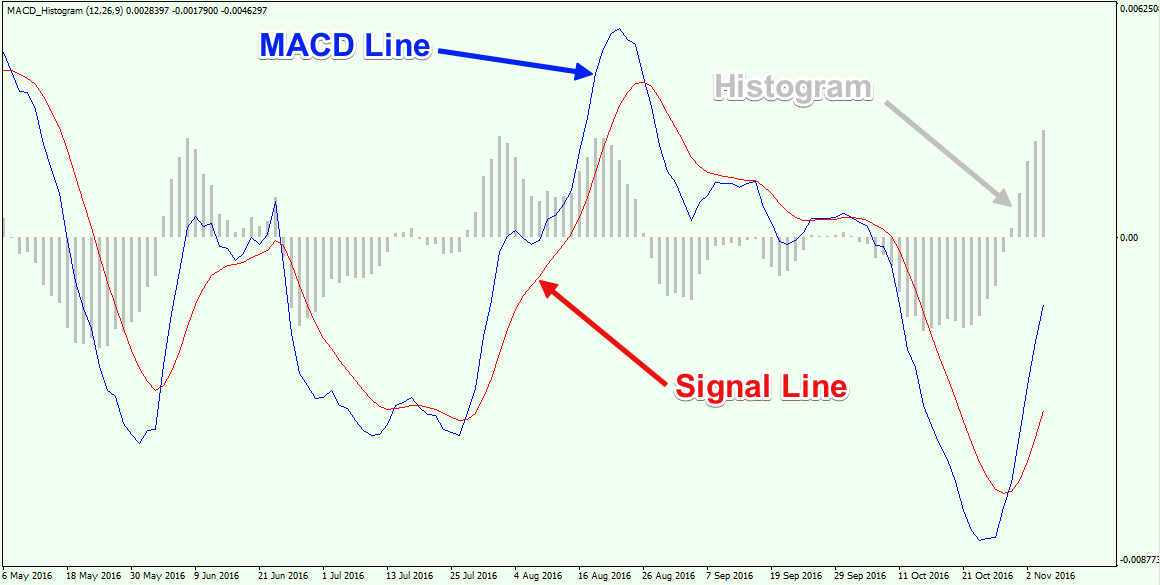
This is a zoomed image of the MACD indicator. The blue line is the MACD line. The red line is the signal line. As you see, the MACD line is faster and it often breaks the signal line. The gray bars are the histogram, which move in harmony with the distance between the two lines of the indicator.
MACD Settings
On most trading platforms, the MACD indicator typically comes with the default parameters 26, 12, and 9. We will interpret the meaning of these three numbers and how they apply to the structure of the indicator.
The “12” and “26” are mutually related. These two numbers concern the calculation of the faster MACD line. The structure of the MACD line comes with calculating a 12-period Exponential Moving Average on the price action and then subtracting a 26-period Exponential Moving Average from the result. The difference between the two EMAs gives you the value of the faster line.
The “9” comes from the calculation of the slower line a.k.a. the signal line. This line is a product of a 9-period Exponential Moving Average plotted on the faster MACD line. This is why the signal line is slower than the MACD line – because it is the smoother version of the MACD line.
MACD Signals
Although the MACD indicator consists only of three components (the two lines and the histogram) it can provide a myriad of signals. We recognize six basic signals of the MACD and now we will discuss each of these separately.
MACD Crossovers
The MACD crossovers involve the interaction between the two MACD lines. The MACD line is faster than the signal line, and it will typically cross above and below the slower signal line.
- Bullish MACD Crossover – We have a bullish MACD crossover when the MACD line crosses the slower signal line in the bullish direction. This action generates a bullish signal on the chart, which implies that the price might start an increase.
- Bearish MACD Crossover – The bearish MACD crossover is opposite to the bullish MACD crossover. When the MACD line crosses the signal line in the bearish direction, we have a bearish crossover. This hints that the price action might be entering a bearish move.
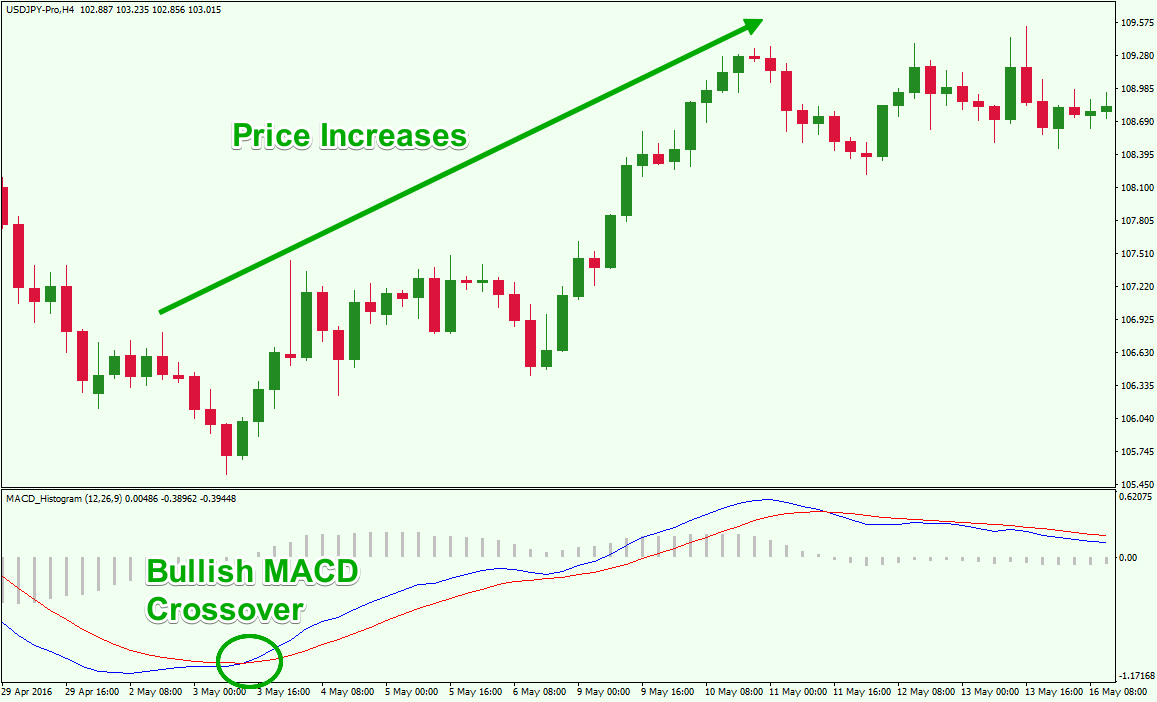
Above you see a bullish MACD crossover. The green circle shows the moment when the faster MACD line crosses the signal line in the bullish direction. The price action increases afterwards.
MACD Divergence
One of the best uses of the MACD study in Forex trading is in identifying divergence signals. When the general price action on the chart and the MACD direction are in contradiction, this clues us in that the price is likely to change directions.
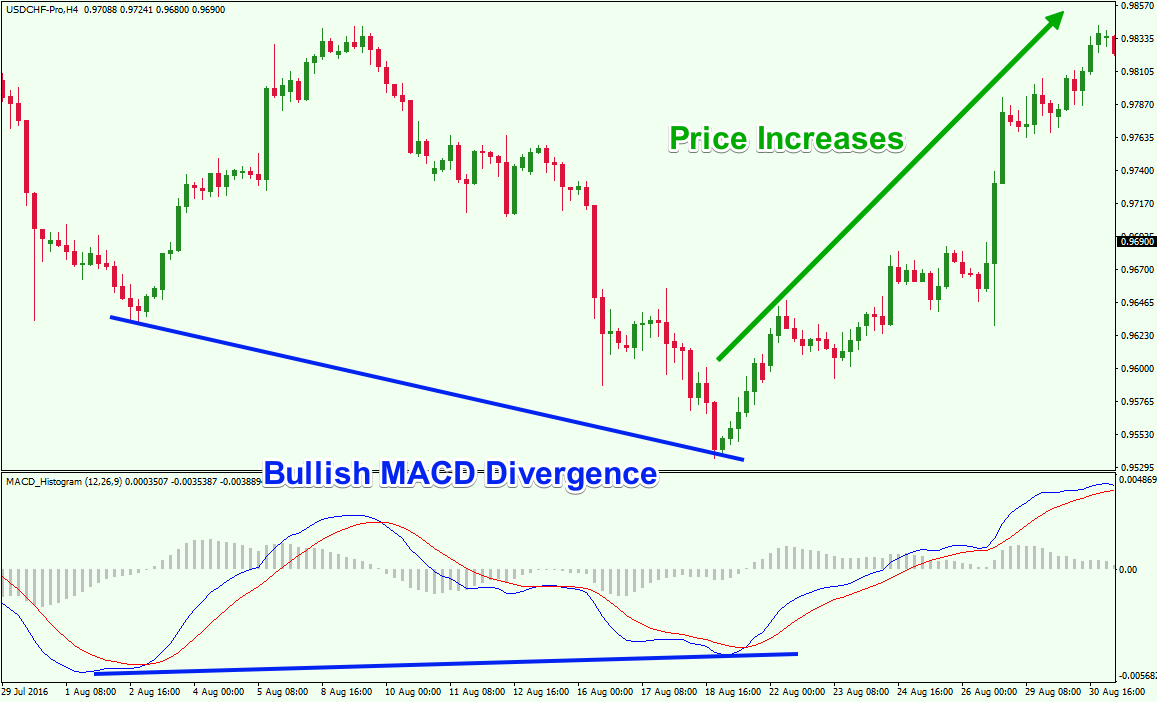
- Bullish MACD Divergence – A bullish MACD divergence occurs when the price action is moving downwards and the MACD is showing higher bottoms. In this case, the MACD indicator is giving us a strong bullish signal. Very often we will see price begin a strong upwards move after a bullish divergence with the MACD. Below you see an example of a Bullish MACD Divergence. After the occurrence of the divergence we see that the price starts an uptrend.
- Bearish MACD Divergence – The bearish MACD divergence happens when the price action is increasing and the MACD lines are creating lower tops. The bearish divergence by the MACD hints that the price might start a bearish move. In many cases, we will see a rapid bearish move after a bearish MACD divergence.
MACD Overbought/Oversold
Many people don’t know this about the MACD indicator, but the MACD indicator can also provide overbought/oversold signals as well.
- Overbought MACD – The MACD is overbought when the MACD line gains a relatively big distance from the signal line. In such cases, we expect the bullish move to exhaust after the strong increase and a bearish move to appear.
- Oversold MACD – The oversold MACD signal is opposite to the overbought signal. When the MACD line gains a relatively significant bearish distance from the signal line, then you are getting an oversold MACD signal. In this case we expect the price to exhaust in its decrease and to initiate a new bullish move.
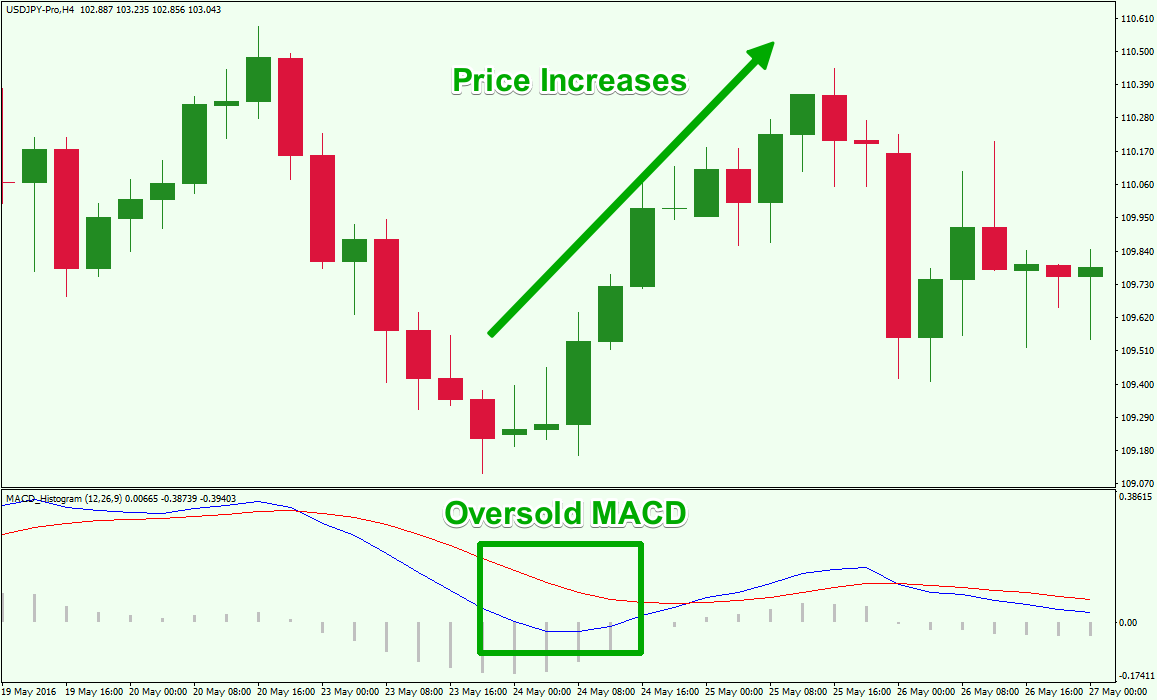
In the green rectangle on the image above you see a case where the fast MACD line gains a relatively big distance from the red signal line. This indicates an oversold MACD signal. The price of the Forex pair increases afterwards.
Technical Analysis Using MACD
As you see, the MACD indicator is pretty rich on technical signals, and is a very versatile trading tool. You can also trade effectively by using MACD in combination with price action analysis. Let’s have a look some trading examples using the MACD below:
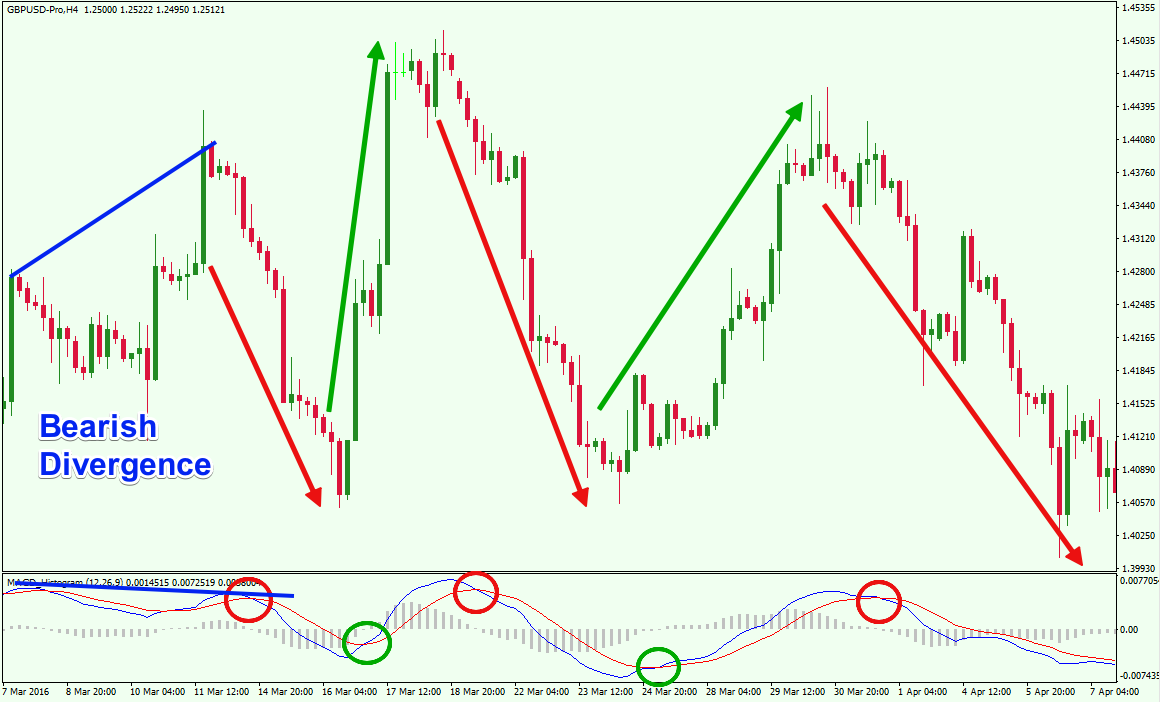
Above you see the MACD indicator applied to an MT4 chart. The indicator is attached at the bottom of the price graph. The image starts with a bearish divergence between the price action and the MACD indicator. As you see, the price creates higher highs, while the tops of the MACD indicator are decreasing (blue). The two MACD lines cross afterwards and the price drops. Then we see four more price swings related with bullish and bearish MACD crossovers. Every time the two lines cross we see a price swing in the direction of the crossover. Now let’s shift to another example using MACD analysis:
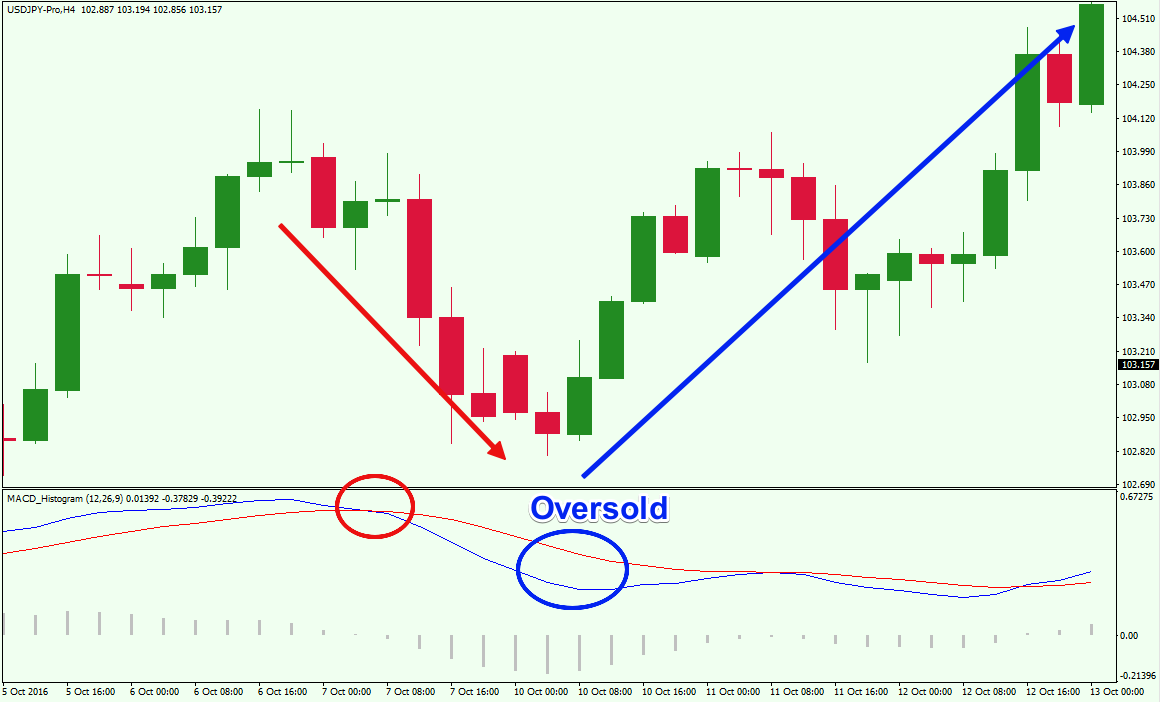
In this case, the price decreases after a bearish MACD crossover. However, 7 periods later we see a potential oversold MACD signal. The MACD line gains a significant bearish distance from the signal line. This implies that the Forex pair may be oversold and ready for a bounce. As you see, the price increases afterwards.
Forex MACD Trading System
Keeping in mind the six technical signals we discussed above we can divide the trade entry rules of the MACD indicator with the two types: bullish and bearish.
Bullish MACD Signals – Consider opening long trades after each of these three signals.
- Bullish MACD Crossover
- Bullish MACD Divergence
- Oversold MACD
Bearish MACD Signals – Consider opening short trades after each of these three signals.
- Bearish MACD Crossover
- Bearish MACD Divergence
- Overbought MACD
Stop Loss on MACD Trades
When you open a trade using a MACD analysis, you will want to protect your position with a stop loss order. To place your stop loss order effectively, you should refer to the chart for previous price action swing points.
If you are opening a long trade, you could place your stop loss below a previous bottom on the chart. If you trade short, then you could place your stop loss order above a previous top. If the price action creates a lower low on a long trade, or higher high on a short trade, your position will be closed automatically.
Taking Profit on MACD Trades
One way to exit a MACD trade is to hold until you receive an opposite signal. So a contrary MACD signal would be your signal to close out your trade. However, there are many other ways to manage your trade based on your personal preferences.
MACD Trading Strategy Example
Now let’s look at an example of a MACD trading method with price action analysis:
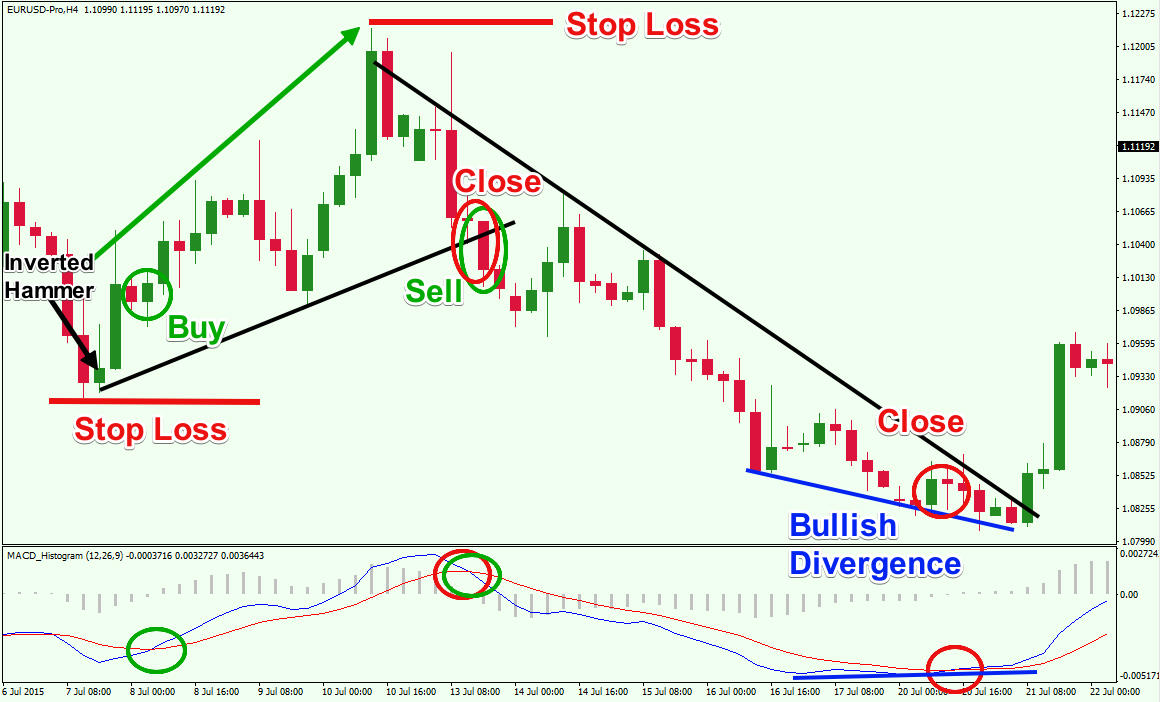
Above you see the H4 chart of the EUR/USD Forex pair for July, 2015. The image shows a couple of trades on the chart that incorporates the MACD lines and histogram.
The first trading signal comes when the price action creates an Inverted Hammer candle pattern after a decrease. A few periods later we see that the MACD lines create a bullish crossover. These are two matching bullish signals, which can be a sufficient premise for a long trade. You could buy the EUR/USD currency pair as shown by the first green circle on the price chart. A stop loss order should be placed below the bottom created at the moment of the reversal, as shown on the image.
The price increases afterwards and creates an AB=CD type pattern. This would have been an optimal exit point. After the creation of the last high, we see a reversing move, followed by a trend line breakout. At the same time, the MACD lines cross in bearish direction. These are two separate exit signals, which unfortunately come a bit late. If you closed the trade here, the trade would still have been slightly profitable.
One thing to note is that the trend line breakout and the bearish MACD crossover generate matching short signals on the chart, meaning that this could provide for a short trade opportunity.
The price starts decreasing afterwards with the creation of a new bearish trend. The MACD lines decrease as well. After a 6-day decrease, the two MACD lines create a higher bottom, while the price action is still decreasing. This creates a bullish MACD divergence on the chart. As such, you should exit the trade when the MACD lines cross upwards. This happens just a couple periods later, confirming the Bullish Divergence pattern. Notice that we didn’t hold the trade until the bearish trend line breakout, because there was sufficient reason from the MACD divergence formation to close earlier.
Trading MACD Divergence in Forex
Divergence trading is one of the most popular and effective Forex strategies. However, one downside with Divergence is that prices can stay in a divergent formation for quite some time without reversing, and it can sometimes be difficult to know when to enter this type of counter trend setup. Keeping a close eye on emerging price action patterns can be helpful in trading divergences.
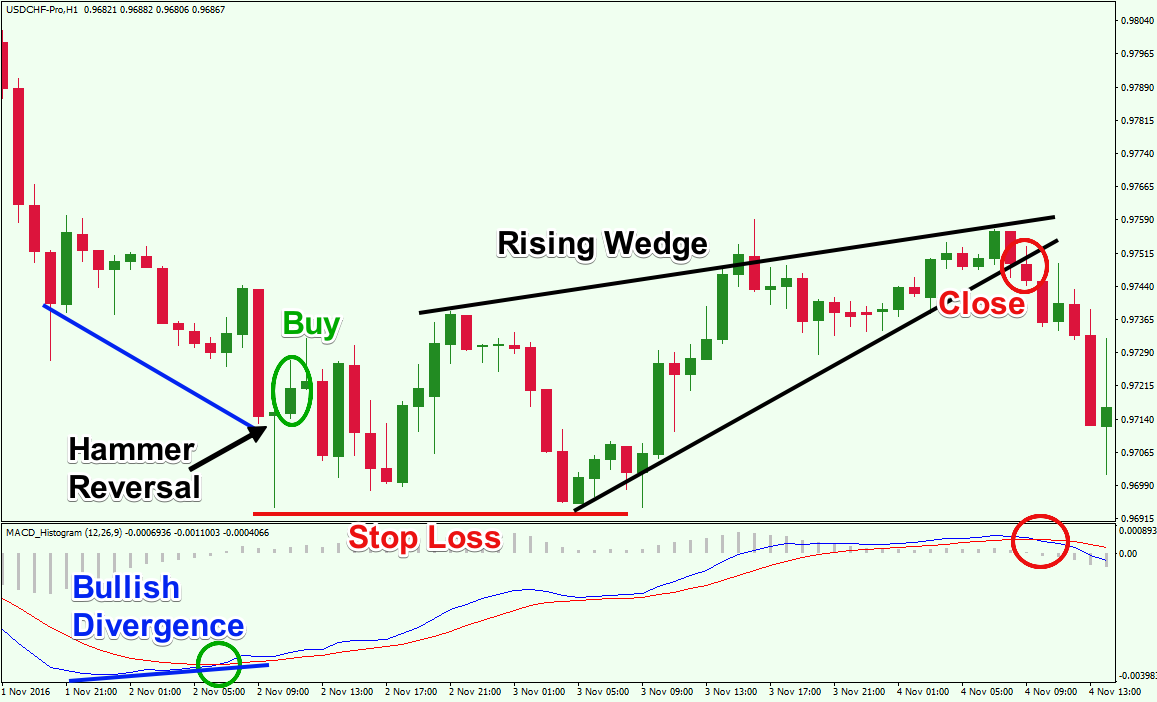
This time we have the H1 chart of the USD/CHF a.k.a. the Swissy. The image depicts how we might trade a MACD divergence pattern.
The image begins with a sharp price drop. Suddenly the decrease slows down. At the same time, the MACD not only slows down, but it starts increasing, creating a bullish divergence. A bullish MACD crossover appears afterwards. You could have opened the trade based on this signal.
If you did, you would likely have gotten stopped out on this first entry. Shortly after, we get a Hammer Reversal candle, which provides additional confirmation of the bullish scenario.
The stop loss on the trade should be located below the Hammer Reversal candle as shown on the image.
You can see that the price creates a few swings while attempting to break in the bullish direction. However, the stop order is well positioned below the Hammer formation and the trade survives the pressure of the bears.
The price starts an increase afterwards. But on the way up we notice that the price action starts creating smaller swings. Soon after, we discover the Rising Wedge chart pattern on the image. Since the Rising Wedge has a strong bearish potential, a breakdown through its lower level could be used in combination with a bearish MACD cross to close the trade.
In our case, the MACD lines cross downwards right at the moment of the bearish wedge breakout. This is a strong signal that the price might initiate a decrease. For this reason, the trade should be closed when you receive these confluent exit signals.
You should always be watchful of price action clues when trading MACD divergence. This way you can attain a better understanding of where and when to enter and exit your MACD divergence trades.
Conclusion
- The MACD indicator is one of the most widely used indicators for Forex trading.
- MACD is an abbreviation for Moving Average Convergence Divergence.
- It is calculated using Moving Averages, which makes it a lagging indicator.
- The main function of the MACD is to discover new trends and to help find the end of present trends.
- The MACD consists of three components:
- MACD line – calculated by taking the difference between 12 and 26 period Exponential Moving Averages
- Signal Line- smoothes the MACD line with 9 periods
- Histogram – represents the difference between the MACD line and the Signal Line
- There are 6 basic signals related with the MACD trade indicator:
- Bullish Crossover – bullish signal
- Bearish Crossover – bearish signal
- Bullish Divergence – bullish signal
- Bearish Divergence – bearish signal
- Oversold MACD – bullish signal
- Overbought MACD – bearish signal
- The MACD indicator provides a myriad on signals, which makes it useful as a good standalone tool, but the best results come when the indicator is combined with price action analysis.
- These are the basic rules for trading with the MACD indicator:
- Consider long trades when you see a bullish MACD signal.
- Consider short trades when you see a bearish MACD signal.
- If you trade long, you should put a stop below an earlier bottom on the chart.
- If you trade short, you should put a stop above an earlier top on the chart.
- Hold your trades until you see an opposite MACD signal or until your stop is hit. You should use price action clues for managing potential exit points.