If you are a chart pattern trader, you have inevitably come across the wedge pattern. It is an interesting pattern that has a few different variations. Depending on when and where the pattern appears within the price action, it can be classified as a reversal or continuation pattern. We’ll dive into the basics of recognizing and labeling wedge patterns, with the ultimate goal of learning how to trade it profitably in the market.
Wedge Chart Pattern
A wedge pattern is a corrective price structure that often precedes a new trend leg. Wedge patterns are considered consolidation phases wherein there is a contraction within the price movement. Volume will also contract during the formation of a wedge pattern. Most wedge patterns form as a contracting variety, and the contracting variety can be classified as a rising wedge or a falling wedge. In rare cases, a wedge pattern can form as a broadening or expanding variation. When this occurs the wedge structure can be further classified as either an ascending wedge, or a descending wedge.
We will detail all of these different types of wedge structures as we move through this lesson, however, for now it’s important to understand that a wedge pattern is a prolonged consolidation pattern that can form in both up trending and down trending markets. Often the wedge pattern resembles a triangle formation that has been tilted either up or down. As such, these formations are sometimes referred to as a triangle wedge.
Wedge patterns often occur at the terminal point of a trend. That is to say that a rising wedge pattern can form near the terminal point of a bullish trend, while a falling wedge pattern can form near the terminal point of a bearish trend. Elliott wave traders will recognize the technical wedge formation as an ending diagonal.
When the wedge pattern occurs in the direction of the trend and within the late stages of the trend is considered a reversal pattern. The price action following the break of the lower line within a rising wedge will often lead to a sharp price reversal to the downside. And similarly the price action following the break of the upper line within a falling wedge will often lead to a sharp reversal to the upside.
Rising Wedge Pattern
Let’s now take a closer look at the rising wedge pattern. Below you will see an illustration of the rising wedge pattern.
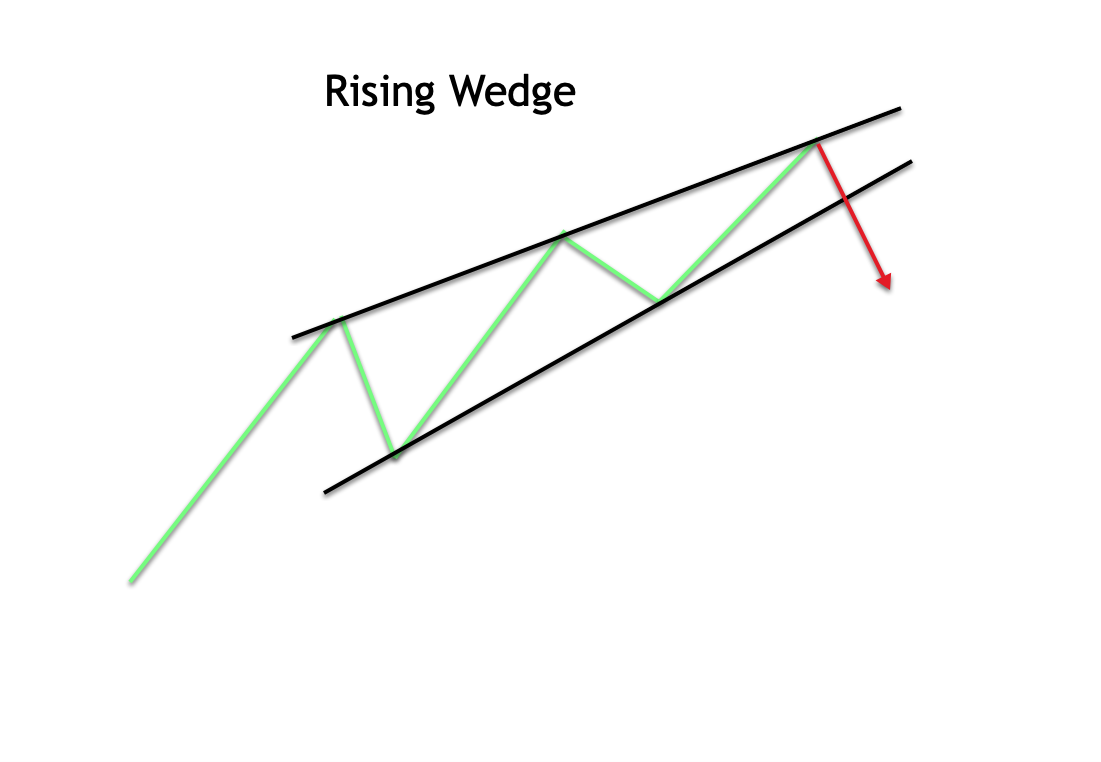 The rising wedge pattern can be seen as two contracting trendlines sloping upward and wherein the majority of the price action is contained within these trendlines. Notice the upper line of the rising wedge pattern which represents the diagonal resistance level for the price action, and how the lower line of the rising wedge pattern represents the diagonal support level for the price action. Both lines are clearly pointing upward and are converging towards each other.
The most important level to watch for within the rising wedge pattern is the lower support line. We expect that the price will break this lower trendline, which will lead to a bearish price move. As such a rising wedge structure is considered a bearish wedge pattern in terms of its price potential.
The rising wedge is often seen at the end of a bullish price move. When the rising wedge appears in the direction of the uptrend and after a prolonged price move higher, the most likely implication is for a reversal of the current trend.
The rising wedge can also occur within the context of a down trending market. When the rising wedge formation occurs within this market context, it is considered as a continuation pattern, meaning that, the breakout should occur at the lower trendline and lead to continued bearish price movement. In either case, the implications for the rising wedge pattern are the same. And that is to say prices should move lower following the downside break out.
Falling Wedge Pattern
Let’s now take a look at the opposite scenario with the falling wedge pattern. The illustration below shows what the falling wedge pattern appears like.
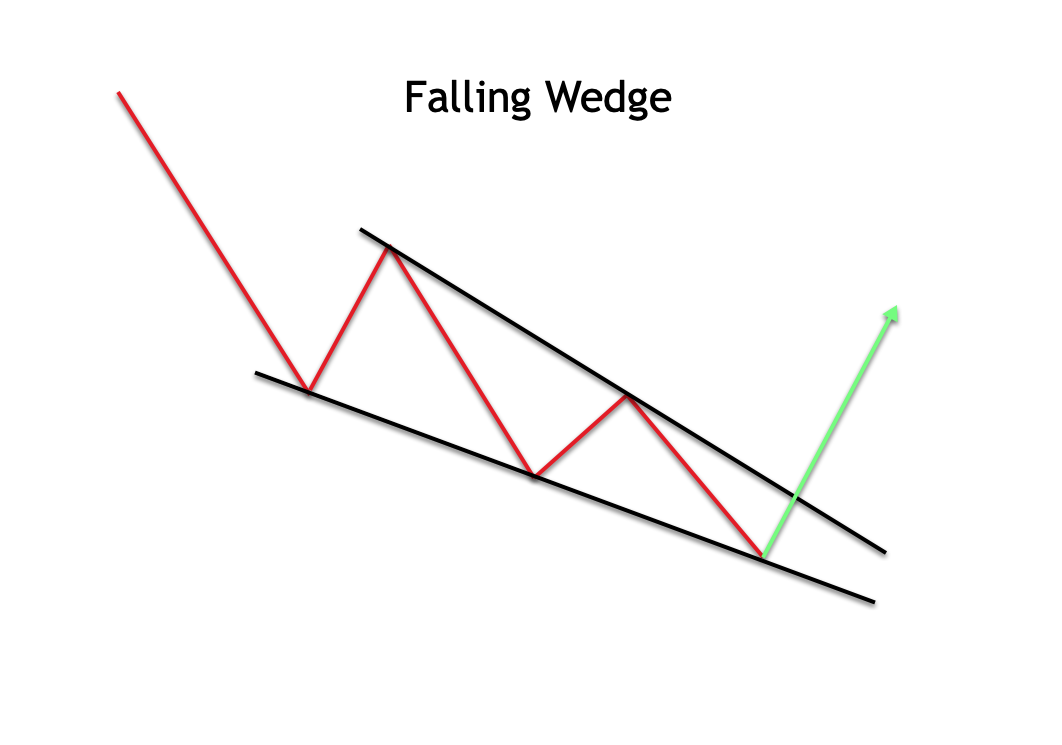 The falling wedge pattern will also be outlined using two contracting trendlines. But in this case the two converging trendlines that contain the price action will be pointing downward. The upper trendline represents diagonal resistance, while the lower trendline represents diagonal support.
In the case of a falling wedge pattern the most important line to watch for is the upper resistance line. When the price breaks above this upper trendline, prices will often be propelled higher into a new trend leg. As such, a falling wedge structure is considered a bullish wedge pattern in terms of its price potential.
The falling wedge pattern can also be a terminal pattern or a continuation pattern. When the falling wedge pattern appears in the direction of the downtrend and near the end of a sustained price movement lower, the implication is for the current downtrend to end, as demand enters the market pushing prices to higher levels. In this scenario, the falling wedge pattern would be classified as a reversal pattern.
In the case where the falling wedge pattern occurs within an overall uptrend, and can be seen as moving against the uptrend, it would be considered a continuation pattern. In either case the breakout should occur to the upside and lead to higher prices. It should be noted, however, that the intensity of the price movement higher will often be much more pronounced when the falling wedge pattern is a reversal pattern.
The same tendency also holds true for a rising wedge pattern. That is to say that the intensity of the price drop following the wedge breakout to the downside will often be much more pronounced in the context of a trend reversal.
Broadening Wedges
Broadening wedges are a less common variation of the wedge pattern formation. There are also referred to as an expanding wedge formation. Within broadening wedges the price action expands rather than contracts. And so, on the price chart a broadening wedge formation will appear as two diverging trendlines that contain the price action.
There are two variations of the broadening wedge formation. The first is the ascending broadening wedge which occurs in the context of an uptrend, and the second is the descending broadening wedge which occurs in the context of a downward.
Let’s take a look at the ascending broadening wedge first. Below you will find an illustration of the ascending broadening wedge.
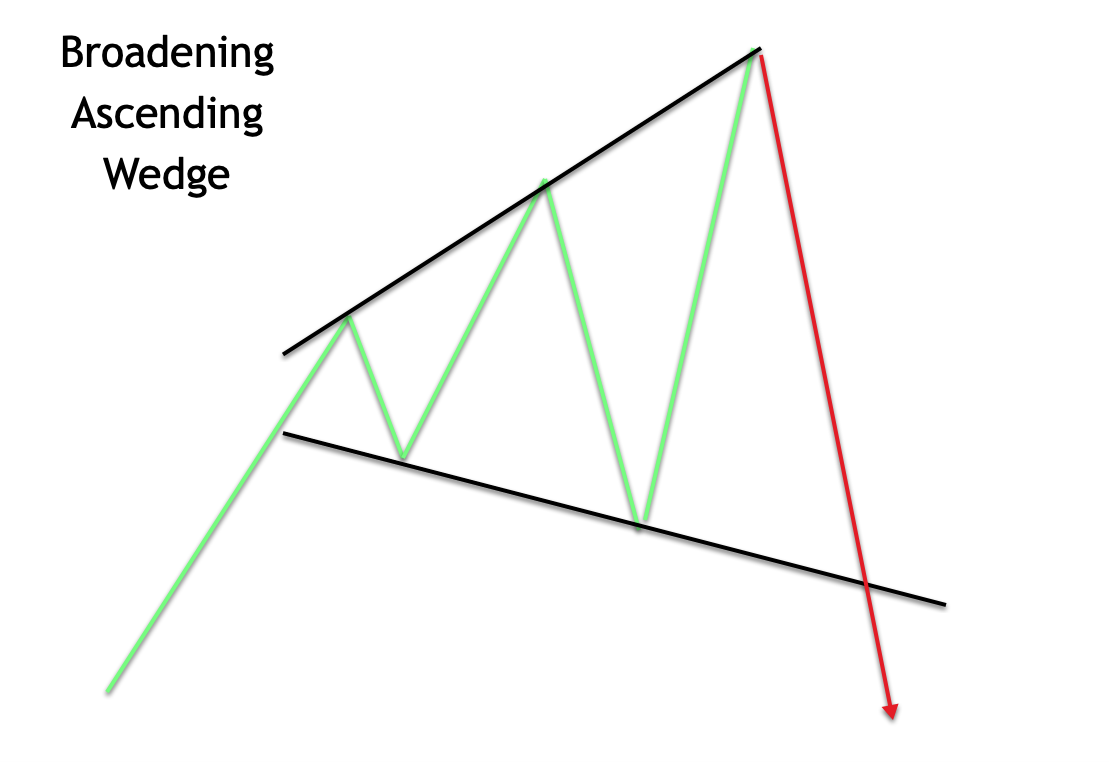
Notice how the upper trendline connects higher highs, and how the lower trendline connects lower lows. As such, this wedge is expanding or broadening as the price action progresses. The implications of the broadening wedge are similar to that of the rising wedge.
More specifically, when the price breaks below the lower line of the broadening wedge formation, we can expect continued follow-through to the downside following the breakout. We will often see the slope within upper line within the broadening wedge to be steeper than that of the lower line. However, this is just a tendency and not necessarily a requirement for defining an ascending broadening wedge.
Now let’s turn our attention to the illustration below which represents the descending broadening wedge formation.
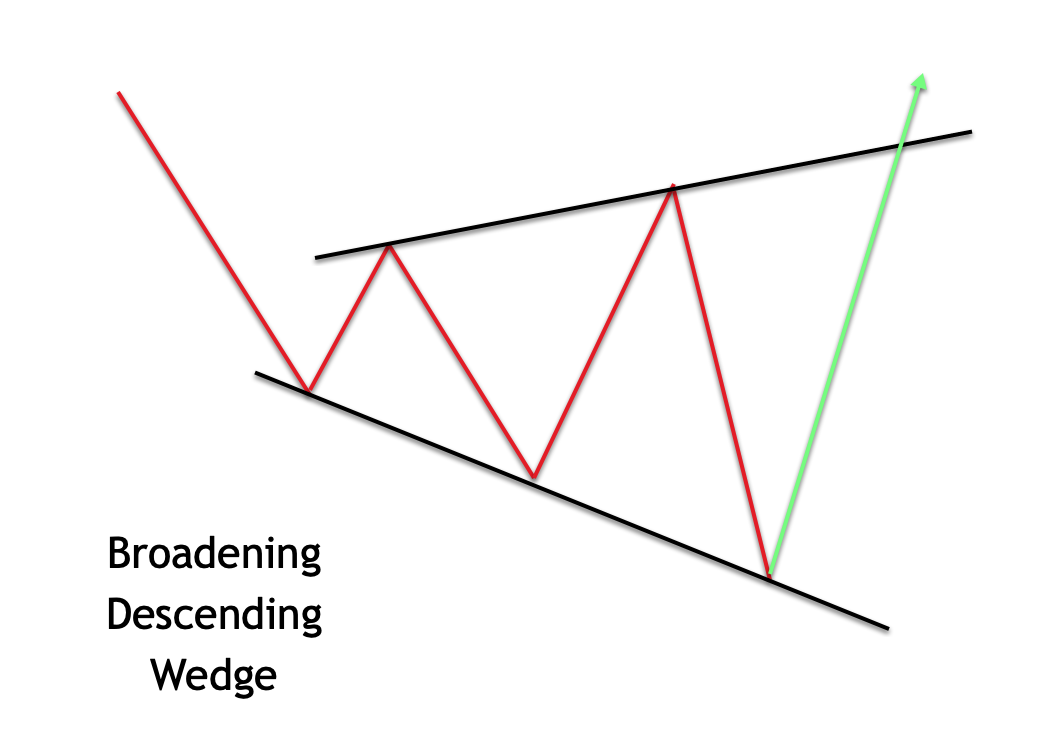
With the descending broadening wedge the upper and lower trendlines will also diverge from one another. The most important line within the descending broadening wedge formation is the upper trendline with acts a diagonal resistance level. Once the price breaks above this upper line, we would expect prices to move higher following the breakout. Additionally, we will often see the slope of lower line of the descending broadening wedge to be steeper than that of the upper line within the pattern.
Broadening wedges are trickier to trade compared to the traditional contracting wedge formation. One of the reasons for this is that the broadening variety creates a less attractive risk to reward profile compared to the contracting wedge formation.
Within the normal wedge formation, we can often place a stop loss just beyond the extreme swing point of the structure. This can provide for a fairly tight stop loss. Due to the expanding nature of the broadening wedge, the stop loss placement is often a far distance away from the breakout point. As such, we are left with either choosing between a distant stoploss level or a less than optimal stoploss placement within the broadening wedge structure.
Trading Wedge Patterns
Now that we have a good understanding of the different types of wedge formations, and their implications, let’s try to build a wedge pattern trading strategy. We will focus on the rising and falling wedge patterns that occur as terminal structures. These offer the best tradable opportunities.
So essentially, our strategy will start with scanning for rising wedges that appear in the context of an uptrend, and after a prolonged price rise. Similarly we will scan for falling wedges that appear in the context of a downtrend, and after a prolonged price decline.
Once we have located a well-defined wedge structure, will want to add a few additional elements to the trade strategy to isolate the best trade setups. For one, we want to ensure that the current market conditions are pointing to an overextended price move.
Essentially, we want to clearly define an overbought market during an uptrend, and an oversold market during a downtrend. The way that we will do that is with the Bollinger band overlay. We will utilize the standard Bollinger band settings of 20, 2 as the parameters.
Specifically, during an uptrend we want to see the price within the final leg of the wedge penetrate above the upper Bollinger band. This would indicate an overextended bullish market sentiment that should lead to a reversal in the price movement. Similarly, during a downtrend we want to see the price within the final leg of the wedge penetrate below the lower Bollinger band. This would clue us in to an overextended bearish market condition that should bounce back to the upside.
Here are the rules for a long trade set up:
- A well-defined rising wedge formation can be seen on the price chart, which is sloped upward and occurs after a prolonged price move to the upside.
- The price action within the final leg of the rising wedge pattern penetrates above the upper Bollinger band.
- Enter a short position one PIP below the low of the bar that penetrated the upper Bollinger band.
- Stop loss to be placed above the most recent swing high preceding the entry signal.
- The target will be the touch of the opposite side of the Bollinger band, which in this case would be the lower band.
Here are the rules for a short trade set up:
- A well-defined falling wedge formation can be seen on the price chart, which is sloped downward and occurs after a prolonged price move to the downside.
- The price action within the final leg of the falling wedge pattern penetrates above the lower Bollinger band.
- Enter a long position one PIP above the high of the bar that penetrated the lower Bollinger band.
- Stop loss to be placed below the most recent swing low preceding the entry signal.
- The target will be the touch of the opposite side of the Bollinger band, which in this case would be the upper band.
Rising Wedge Pattern Trade Example
Now that we have outlined the rules for our wedge trading strategy, let’s now see what that would look like on an actual price chart. Below you will find the price chart for the Australian Dollar Japanese Yen currency pair based on the four hour timeframe.
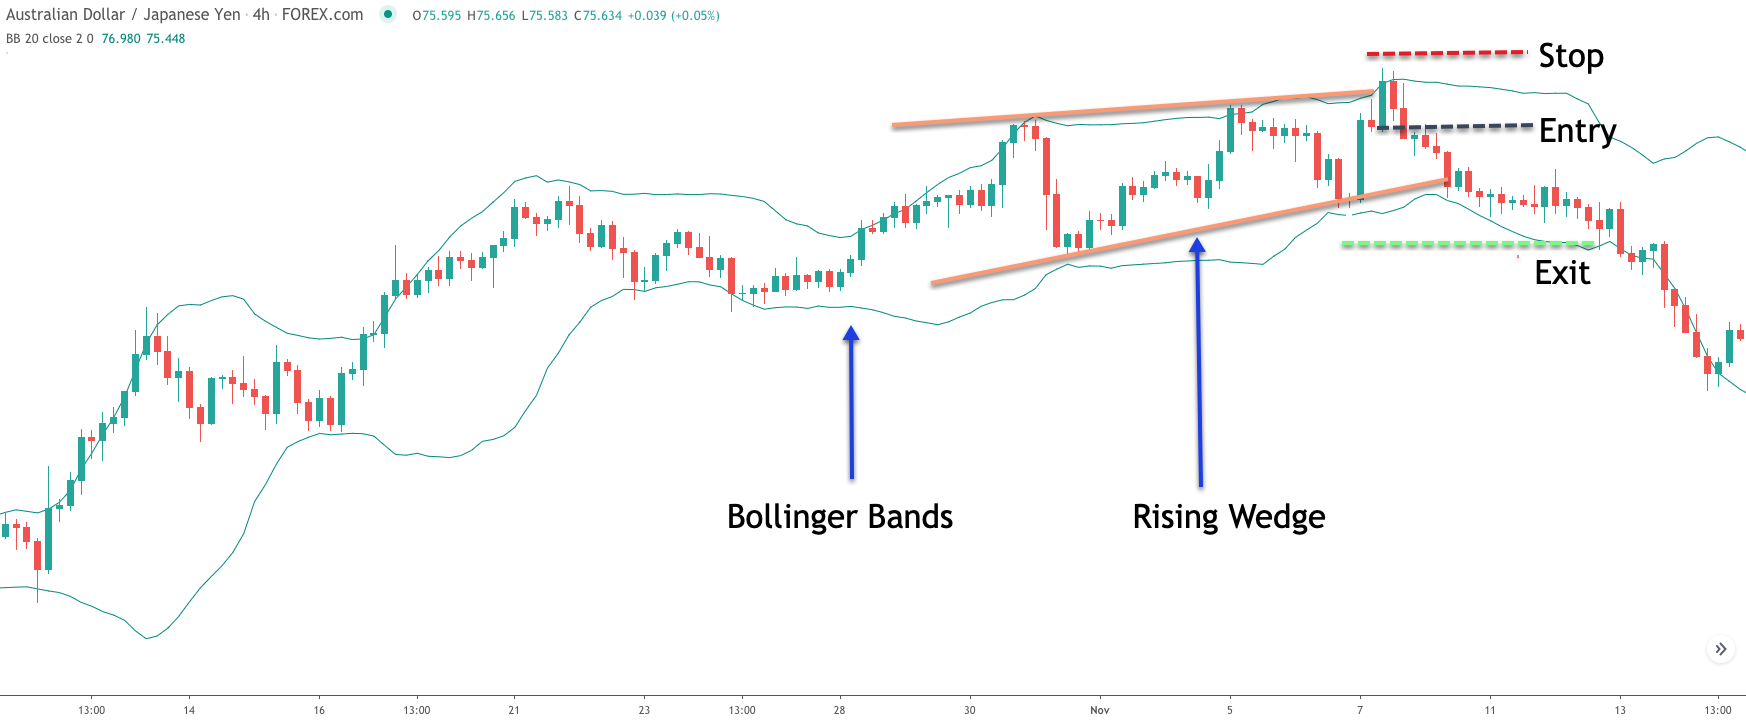
The green bands overlaid on the price chart is the Bollinger band study. You can also see the rising wedge formation outlined with the two orange trendlines. As a price was moving higher, it became evident that there was a contraction in the price movement that resembled a rising wedge formation.
Once we are able to recognize this, we would begin to go through the process of validating this potential set up. Firstly, we want to confirm that the rising wedge is a reversal type pattern. The way that we would do that is by confirming that the rising wedge occurs after a prolonged price move. As we can see from the price chart, the price action leading up to the rising wedge was clearly bullish.
Next, we want to wait for the final leg within the rising wedge to penetrate above the upper end of the Bollinger band. Notice how the bullish candle immediately to the right of the upper trendline of the wedge pattern moves above the upper Bollinger band. This is the penetration signal that confirms the rising wedge pattern.
Now, we will need to take steps to prepare for a short entry. The short entry signal would occur at the break of the low of the candle that penetrated the upper limit of the Bollinger band. You can see that entry level marked on the price chart with the black dashed horizontal line.
Shortly afterwards the price did break below this entry level, which served as our entry signal. Once the short entry order was filled, we would immediately place a stop loss to protect our position. The stop loss would be placed just above the swing high prior to the entry signal. That stoploss level can be seen on the chart and is noted accordingly.
At this point, we will need to be patient and monitor the price action closely to execute our exit, assuming that prices continue to move lower in our favor. Following the short entry signal, the price did begin to slide lower eventually reaching the lower end of the Bollinger band, which would have signaled the take profit exit point.
Falling Wedge Pattern Trade Example
Let’s now shift our attention to a trade that demonstrates the falling wedge pattern. On the chart below, you will find another example of a wedge pattern in forex. The chart shows the New Zealand Dollar to Japanese Yen currency pair based on the 240 minute timeframe.
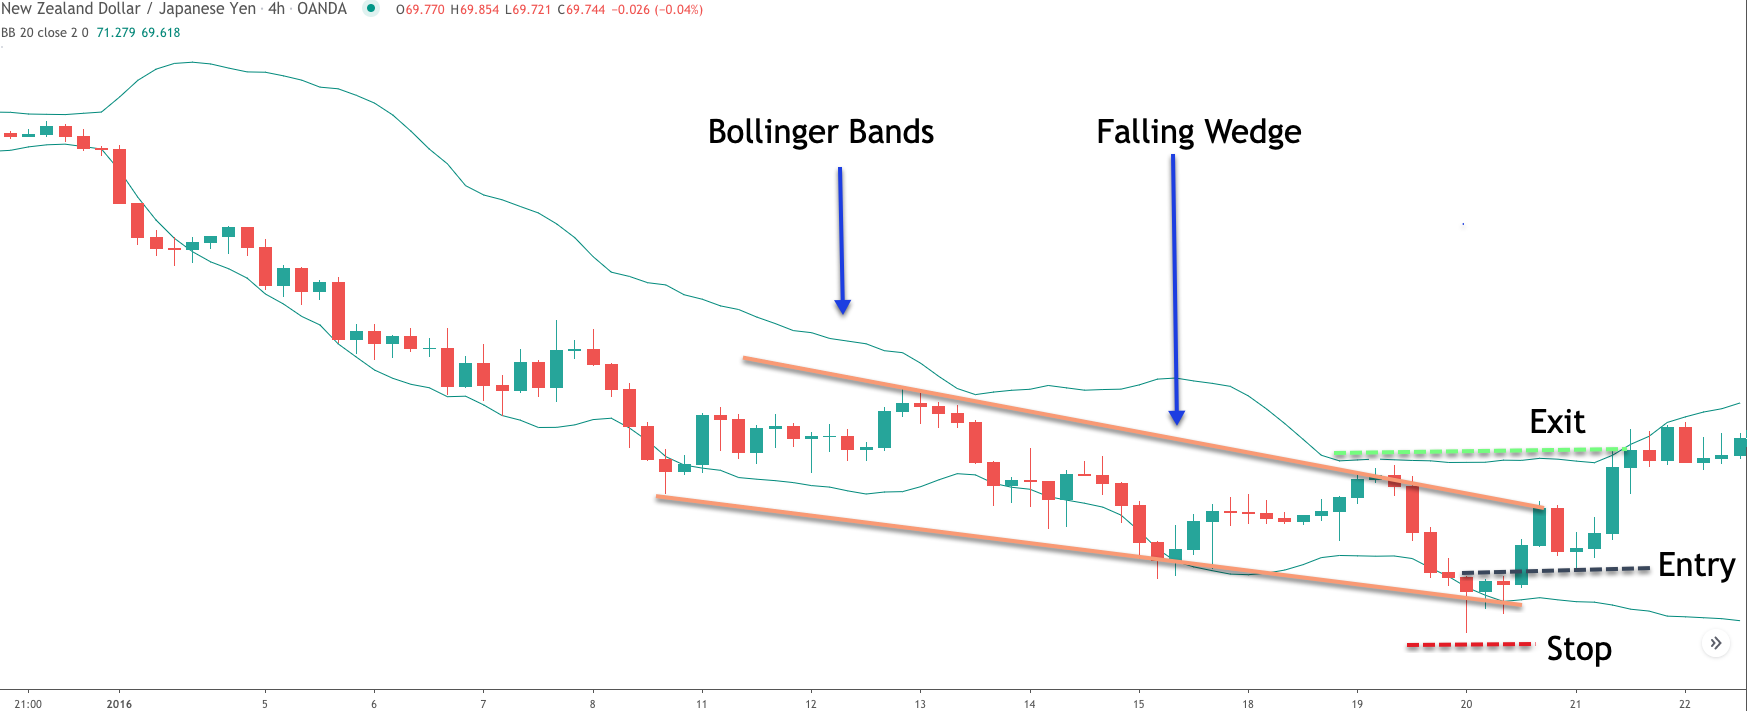
Again, notice the green bands that contain the price action. These bands are the Bollinger band study overlaid on the price chart. The downward sloping trendlines represent the falling wedge formation. You can see how the price action was contracting during the late stages of this bearish trend.
Let’s now go through the process of confirming the falling wedge set up. First and foremost, after we have identified the falling wedge formation, we want to analyze the price action leading to the falling wedge formation to confirm that a bearish price trend was underway.
As we can see, this was clearly the case. Next, we will need to wait for the price action to cross below the lower Bollinger band. This would confirm the set up for the falling wedge based on our trading rules described. If you look closely, you can see the hammer candle that clearly broke below the lower Bollinger band. The hammer candlestick formation is essentially a bullish pin bar that often occurs at or near the termination point of a downtrend.
The entry signal would be set at one tick above the high of this pin bar formation. We have noted this level with the black dashed line labeled, Entry. After a few bars of consolidation following the pin bar, the price broke above this threshold which would have executed our buy order. We would immediately place a stop loss just below the swing low preceding the entry signal. That would coincide with the low of the pin bar as noted on the price chart.
Our signal to take profit and exit the trade would occur upon the price touching the upper band within the Bollinger band. You can see the exit level marked accordingly. It’s important to keep in mind that this Bollinger band exit strategy is dynamic, meaning that, it will print a new level with each passing bar. As such, we must monitor the price action closely to confirm that event. Alternatively, you can set up a scan within your trading platform to alert you when that specific event is triggered.
Summary
The wedge pattern is a popular chart formation used by many technical traders. As we discussed, the wedge pattern can appear as a reversal pattern or as a continuation pattern. In our discussion here, we have focused on the reversal wedge pattern for the most part. This was done intentionally because the reversal variation offers the best tradable opportunities as it relates to this formation.
Chartists can trade the wedge pattern in a number of ways. We have illustrated one such methodology here. Depending on your style of trading you may integrate some of your own techniques and analysis into the mix. This is completely natural and worth the effort. Just make sure to backtest any ideas before committing your hard earned money to trading your preferred wedge strategy in the market.