Most traders are familiar with using moving averages in the context of market analysis. Although there are many different variations of moving average lines, the two predominant ones include the 50 period and 200 period moving averages. We’re going to describe each of these in the upcoming lesson, and show you some of the best practices in applying them in different market conditions.
Understanding Moving Averages
The primary function of moving averages is to help smooth the price data so that we can better gauge the overall price action of a trading instrument. However it’s important to understand that a moving average is a lagging indicator, and thus are most useful in defining what price has done in the past rather than what price is likely to do in the future. Some traders may find this characteristic unappealing but, nevertheless, the proper application of moving average lines can be quite useful.
One of the best ways to use moving averages is as a trend filter. So when the markets are trending in one direction, as evident from our moving average study, the probabilities favor that continued price action in that direction is more likely. Obviously, we should be using additional technical analysis techniques in conjunction with the moving average trend filter to time our trades.
There are two primary types of moving averages that are used in financial speculation. The first variation is the simple moving average and the second variation is the exponential moving average.
The simple moving average, also known as SMA, is calculated using the average price of an instrument over a specified number of periods. Each period is weighted equally in the calculation and the overall construction of the simple moving average line.
For example, a 20 period simple moving average line would be calculated by averaging the closing prices of the last 20 days. As a new data point is introduced, it is incorporated into the calculation while the last data point is removed from the calculation.
The exponential moving average, also referred to as EMA is a bit more complex than the simple moving average. They were designed to reduce the overall lag that are inherent within simple moving average lines. Essentially, exponential moving averages factor in recent data points more heavily than latter data points. Because of this, EMA’s tend to be more sensitive to recent changes in price action.
So the obvious question becomes which is a better moving average to use for the purposes of trading the markets? From my research, I have not found that one is statistically more reliable than the other in terms of trend identification. They tend to correlate quite highly with each other in most cases.
50 Day Moving Average Basics
Now that we have a basic understanding of how moving averages are constructed and some of the different variations, let’s now move on to discussing two of the more widely followed moving average lines. The first is the 50 day simple moving average line.
The 50 period simple moving average is quite popular in the stock indexes, currencies, and commodities markets. It is considered an intermediate-term trend filter, and one that many swing traders rely on. Since the 50 day moving average consists of a total of 50 price bars in its calculation, it tends to be quite smooth as compared to the shorter-term averages such as the popular 20 period moving average line.
Here’s an example of the 50 period SMA line applied to the spot Silver price chart:
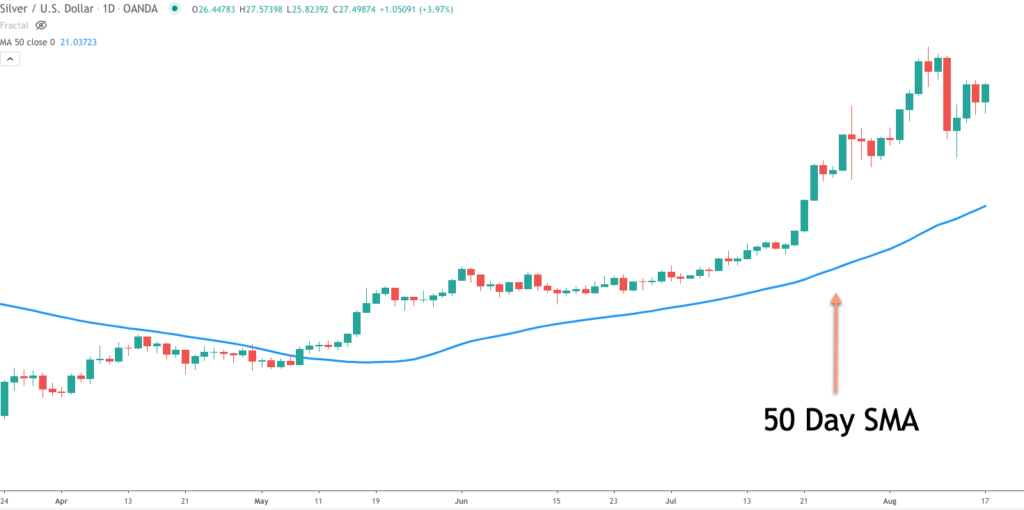
At the most basic level, when price is trading above the 50 period simple moving average, it is considered a bullish trend. On the contrary, when price is trading below the 50 period simple moving average line, it is considered a bearish trend. Furthermore, when the price moves above the 50 period moving average from below, it is considered to be a shift in sentiment from bearish to bullish. And in reverse, when the price moves below the 50 period moving average from above, it is considered to be a shift in sentiment from bullish to bearish.
Sometimes during range bound market conditions we will see the price action whipsaw above and below the 50 period SMA. When this occurs, it’s best to either stay on the sidelines, or employ mean reversion strategies rather than trend following strategies. Knowing the underlying market conditions is an integral part to successful trading. By analyzing the 50 period SMA, we can have a better idea of whether the market is displaying trending characteristics or consolidation characteristics. This will allow us to select the most suitable trading strategy for the current market condition.
200 Day Moving Average Basics
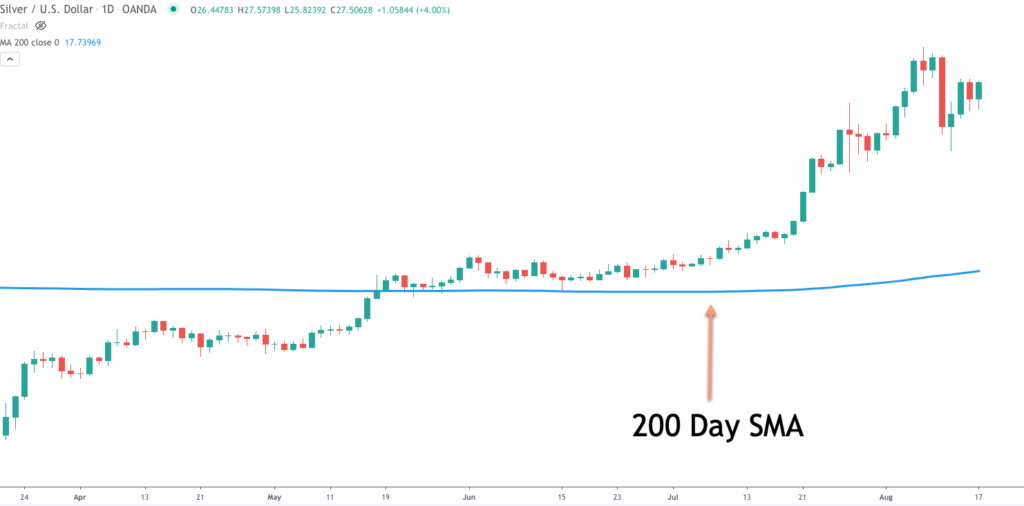
The 200 period simple moving average line is considered a longer-term trend filter, and is often watched by position traders. The 200 period simple moving average line takes into account 200 days of past data, and it’s smoothing effect can be quite pronounced on the price chart. The most recent bar can often be a far distance above or below the 200 SMA.
As with the 50 period moving average line, it works best in the identification of the overall trend. And so, as a general rule, when price is trading above the 200 period moving average, the market is considered to be in a bullish phase, whereas when the price is trading below the 200 period moving average, the market is considered to be in a bearish phase.
Below you will find an example of a 200 period SMA overlaid on the same Silver price chart:
Due to the slow reactive nature of the 200 period moving average, it’s often combined with a shorter-term moving average study. The shorter moving average line can act as a trade trigger, while the 200 moving average line serves as the trend filter. There are many different combinations that can be used with such a dual moving average strategy. One of the more popular combinations, which will be discussing more in the later section is the dual 50 and 200 period moving averages.
Additionally, in a bullish trending market environment the 200 SMA line can often correlate well with and overlap a basic upsloping trendline drawn at the swing lows. And the same can be said of the 200 SMA in a bearish trending market. That is to say that it will often overlap a down sloping trendline drawn at the swing highs.
50 Day Moving Average Strategy
Now let’s move on and take the knowledge that we learned about the 50 day moving average and see if we can create a strategy around it. As we noted earlier, one of the best ways to utilize the 50 day SMA is as a trend filter. We will need a shorter-term, more sensitive signal to initiate trades, and for that purpose we can look to the William’s Percent R indicator combined with a bar breakout.
In addition to that, this strategy will use the ADX indicator, which is a measure of the trendiness of the market. That is to say it helps us to state more empirically whether a market is in a trending phase or non-trending phase.
Now that we know the different components that will make up our 50 day moving average trading strategy, let’s go over some of the rules:
For a buy signal we will need to see the following:
- Current price bar is above the 50 day simple moving average (50 day SMA).
- William’s % R indicator has recently shown an oversold reading of -90 or below.
- ADX(14) indicator is above 20
- Entry signal initiated 1 tick above the bar that signaled the William’s % R oversold signal.
- Stop loss will be placed at the recent swing low.
- Take profit will be a 2X multiple of the stoploss.
A sell signal will be triggered when the following conditions are met:
- Current price bar is below the 50 day simple moving average (50 day SMA).
- Williams % R indicator has recently shown an overbought reading of -10 or above.
- ADX(14) indicator is above 20.
- Entry signal initiated 1 tick below the bar that signaled the William’s % R overbought signal.
- Stop loss will be placed at the recent swing high
- Take profit will be a 2X multiple of the stoploss.
The logic behind this strategy is fairly straightforward. We are looking to buy a pullback into a rising trend, when the price action is displaying characteristics of an up trending market. And vice versa we are looking to sell a rally into a declining trend, when the price action is displaying characteristics of a down trending market.
The 50 period SMA line acts as our trend filter, giving us a bullish or bearish bias. The 14 period ADX indicator serves as an additional filter, and is used for the purposes of quantifying whether the market is in a trending or consolidation phase. And finally the entry trigger used is the Williams % R indicator coupled with the bar breakout, which we alert us when a minor retracement against the larger trend is likely ending.
50 Day Moving Average Trade Example
The chart below displays the daily chart of spot Silver, XAGUSD.
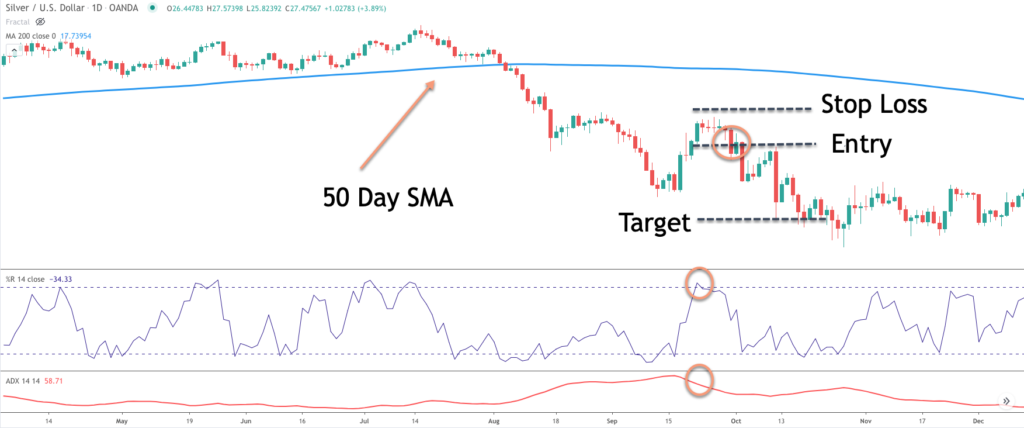
The blue line overlay on the price chart represents the 50 day SMA. The indicator study just below the price chart is the Williams % R indicator. And finally at the lower pane of the chart, you’ll find the ADX indicator, based on the 14 day lookback. These are the three indicator studies that we will rely on with this particular 50 day moving average strategy.
Towards the center of the chart we can see a transition in the market, as prices move from above the 50 period SMA, to below it. The price begins to move sharply lower immediately following the break below the 50 SMA line. We can see a minor pullback which led to another leg lower. Soon afterwards we notice that the market was again beginning to trade higher in what appeared to be a bear market rally at this point.
Eventually the retracement led to an overbought reading in the Williams % R indicator. Notice the circled area on the % R indicator which are confirms where this occurs. At the same time, the ADX indicator also registered a reading that was well above the 20 minimum threshold that will be looking for.
As such, we will be looking for a possible set up for a short opportunity. The entry signal would be triggered at the break below the bar that registered the overbought reading on the Williams % R indicator. The low of that bar is shown on the chart as the dashed middle line. This would serve as our entry trigger for a short trade.
After a bit of consolidation the price eventually broke this low, which would have executed our short trade. The stop loss would be placed above the recent swing high as can be seen by the upper dashed black line. And finally the target for this trade would be a 2:1 reward to risk ratio. This is depicted with the lower dashed black line on the chart. We can see that after the breakout to the downside that price moves lower hitting our target, taking us out with a profitable trade.
200 Day Moving Average Strategy
We discussed a trend a strategy using the 50 day moving average. Now let’s take a look at how we could construct a mean reversion trading strategy using the 200 day moving average line. If you recall from our earlier section, we noted that when price action is whipsawing around the simple moving average line, or when the SMA line is relatively flat, is often indicative of a congestion phase in the market.
We can take this information to build an anti-trend, or mean reverting type strategy when we encounter such a situation in the market. For this mean reversion strategy, we will be utilizing just two trading indicators. The first is a 200 period SMA which gives us some indication as to whether the market is currently trending or consolidating. We will use the combination of the RSI indicator with a bar breakout to confirm our trade signal.
So here is the exact rules to generate a buy signal for this mean reverting strategy:
- Current 200 day simple moving average (200 day SMA) is relatively flat.
- RSI(14) indicator has recently shown and oversold reading of 30 or below.
- Entry signal initiated 1 tick above the bar that signaled the RSI oversold signal.
- Stop loss will be placed at the recent swing low.
- Take profit will be a 2X multiple of the stop loss.
A sell signal would be issued when the following conditions are met:
- Current 200 day simple moving average (200 day SMA) is relatively flat.
- RSI(14) indicator has recently shown and overbought reading of 70 or above.
- Entry signal initiated 1 tick below the bar that signaled the RSI overbought signal
- Stop loss will be placed at the recent swing high
- Take profit will be a 2X multiple of the stop loss.
The logic behind this simple contrarian strategy is that we want to locate a market that is trading in a range bound manner. Once we’ve done this, we expect that prices should revert to the mean upon reaching a short-term overbought or oversold level.
200 Day Moving Average Trade Example
Let’s now detail how this trade strategy would look like on the price chart. The chart below shows the price action of the USDSGD pair on the daily timeframe.
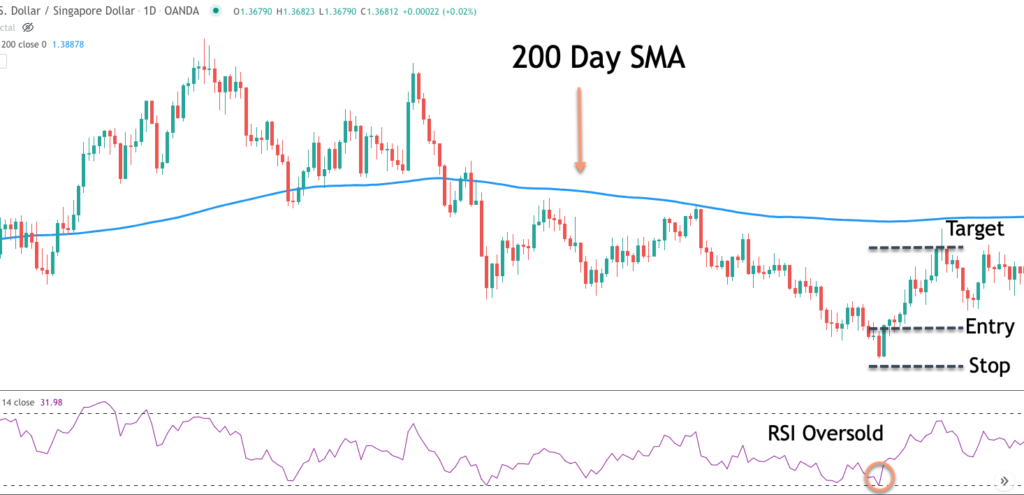
The first thing that we need to do in our evaluation process is to check if the 200 day simple moving average line appears to be relatively flat. Notice here that towards the left side of this chart the SMA line appears to be sloping upward slightly, while towards the right side of this chart the SMA line appears to be sloping down slightly. However the overall effect is that the SMA line is relatively flat and the USDSGD appears to be trading in balance.
As such, a reversion to the mean technique could be employed to take advantage of extreme levels within this range. So now that we have found a possible opportunity to employ such a strategy, what do we need to look for next? Well, we would want to see the RSI indicator reach an overbought level for a sell signal, or an oversold level for a buy signal. In this particular case, we can see that the RSI reading reached and oversold level as shown within the circled area on the lower pane of the chart.
Now that we have a viable set up, we need to hone in on the entry. The entry calls for a breakout above the high of the bar that created the RSI oversold reading. You can see that level marked with the middle dashed black line, noted as Entry. The next bar triggered the entry for a long, and interestingly enough the close of that entry bar, also formed an engulfing candlestick pattern.
Upon executing the long entry, we would want to bracket the trade with a stoploss order below the market, and a target above the market. The stoploss would be placed at the swing low created prior to the breakout. The target is measured as a 2X reward risk factor of the distance between the entry and the stoploss. Both the stoploss level and target level are noted on the above price chart. As can be seen by the price action, prices move sharply higher after the entry signal for a profitable trade here.
Golden Cross and Death Cross
We have taken a look at a few trading strategies that incorporate the 50 and 200 moving averages independently. Did you know that combining these two moving averages can also provide valuable clues about the current market conditions?
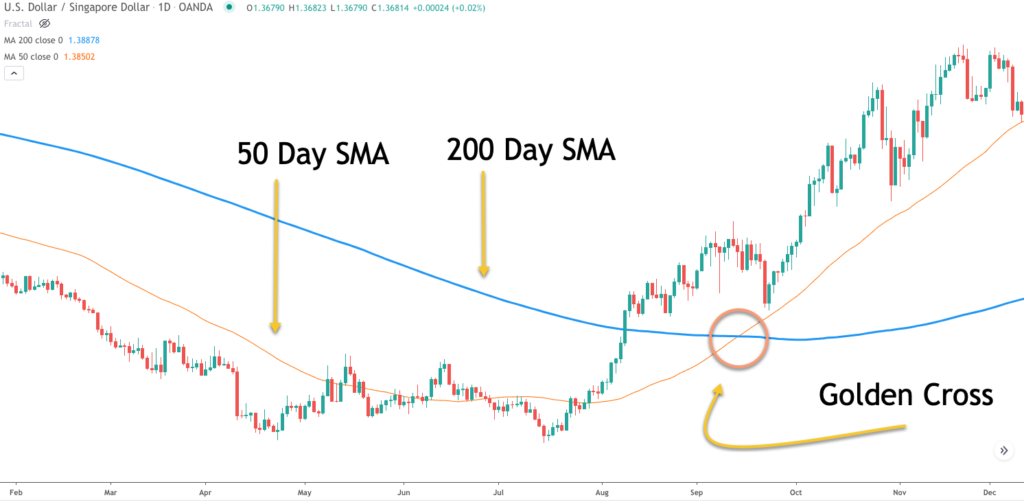
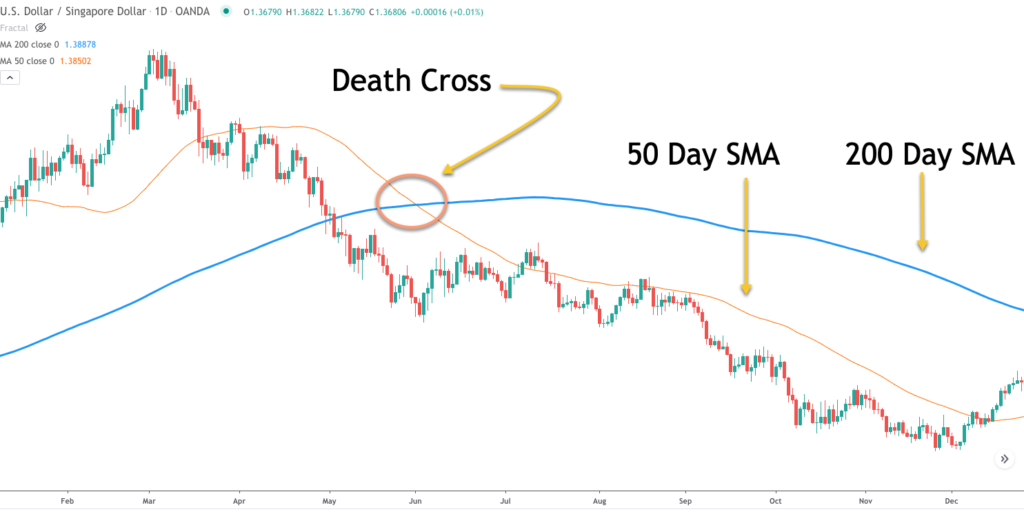
The 50 and 200 day moving averages are widely watched by traders and investors in almost all major markets, particularly the US stock indexes. A 50 and 200 period crossover event is held with high regard by market participants. When the 50 day moving average rises above the 200 day moving average, a golden cross is said to have occurred. This is a highly regarded bullish trade signal. Conversely when the 50 day moving average falls below the 200 day moving average, a death cross is said to have occurred. This is considered as a bearish sign for the market.
Below you will find an example of the Golden Cross:
And on the price chart below, you will find an example of the Death Cross:
While there is nothing particularly revealing about the golden cross or death cross trade signal, because it is so widely watched by the various players, it has a tendency to shift sentiment in the market. As a result, it is certainly an event that you want to pay attention to.
One of the most practical applications of the 50 and 200 period moving average cross can be seen in the S&P 500 Index. This is the most actively traded equity index market in the world. When the golden cross occurs, you will often see that it makes big headlines on most major financial news networks. This can have the effect of a self-fulfilling prophecy, meaning that, more and more traders will become aware of its presence, which itself can have an impact on the price of the security. Prices can often be propelled higher upon the golden cross signal, and conversely prices can often be pushed lower shortly after the death cross signal.
>
Summary
You should now have a better understanding of the application of the 50 period and 200 period SMA’s. They are among the most popular moving average variations that forex and equity index traders use. There are a host of ways in which you can incorporate these moving averages into your trading plan.
What I found works best is in implementing them as trend based filters, rather than as trade entry signals. One of the reasons for this is that moving averages are essentially lagging indicators. We are better served by focusing on real-time price action signals as our primary entry mechanism. The 50 and 200 day moving averages can then serve as the backdrop upon which we trade in tune with the larger trend.