One of the more common price analysis tools used by market traders is Fibonacci retracements. In this lesson, we will look into the origins of the Fibonacci ratios, the most practical uses of retracements, and the process of building a trading strategy around it.
What Are Fibonacci Retracement Levels?
Fibonacci retracements are considered to be hidden levels of support and resistance in the market. They are derived from the Fibonacci sequence of numbers that was discovered by Leonardo of Pisa, a 13th century Italian mathematician. Fib retracements are internal retracements since they measure a price move that exists within a prior leg. The most common Fibonacci retracement levels include 23.6%, 38.2%, 50%, 61.8%, and 78.6%. Although the 50% level is not an actual Fibonacci based ratio, it has many important characteristics, and as such, is included as a level within most Fibonacci retracement tools.
We will discuss the exact measurement technique for applying Fibonacci retracements in the upcoming sections, however for now it’s important to understand that we need to select two important swing points for plotting all Fibonacci levels. Additionally, the more confluence that you have around a certain price level, the more weight we can put on that particular area as a potential support or resistance level.
There are a myriad of technical studies that one can utilize in attempting to find the strongest fib retracement levels. For example, a trader can use Fibonacci retracements in conjunction with other technical analysis tools such as candlestick patterns, pivot points, market profile, or Elliott wave analysis to confirm a high probability reversal zone.
Whatever combination of techniques are utilized, the primary goal in using Fibonacci retracements is to anticipate a potential termination point for a correction. The Fibonacci retracement tool is equally valuable for both shorter-term, and longer-term traders.
Day traders often use the previous day’s high and low as the two primary points in constructing Fibonacci retracements. And then use those levels for trading the current days session. Position traders may use a multi-month or multi-year high low level to construct their fib levels of interest. The point being that markets are fractal, and as such, there is value in using Fibonacci retracement levels regardless of your trading timeframe.
Below you will find a price chart with the five primary Fibonacci levels plotted.
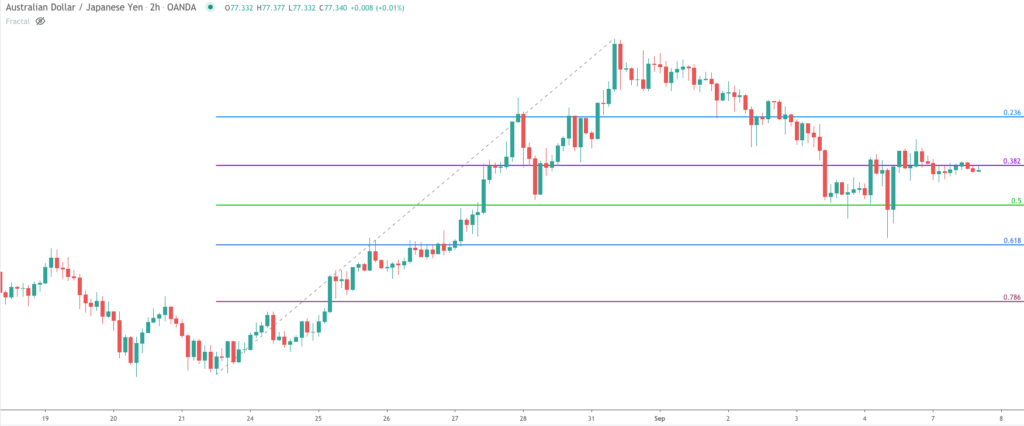
Notice the shallowest retracement is the 23.6% level, followed by the 38.2% level. The 50% retracement represents the halfway move of the prior price leg. Then there is the 61.8% retracement level, which is arguably the most important retracement to watch.
Finally we have the 78.6% fib retracement, which represents the deepest fib retracement. It’s also important to note that the 88.6% retracement level also has important mathematical characteristics. It is not, however, traditionally included as a default level within most fib retracement tools. Nevertheless, it’s one that is an important level to watch for as well.
How To Calculate Fibonacci Retracement Levels
Now that you have a basic understanding of Fibonacci retracement levels, let’s now dive in a bit deeper to study the origins of the Fibonacci sequence of numbers. The Fibonacci numbers are a set of numbers starting with zero and one wherein the sum of the next number in the series is the result of adding the two prior numbers. As a result, the Fibonacci sequence of numbers includes the following:
0, 1, 1, 2, 3, 5, 8, 13, 21, 34, 55, 89, 144, 233, 377, 610, 987… with the output continuing into infinity.
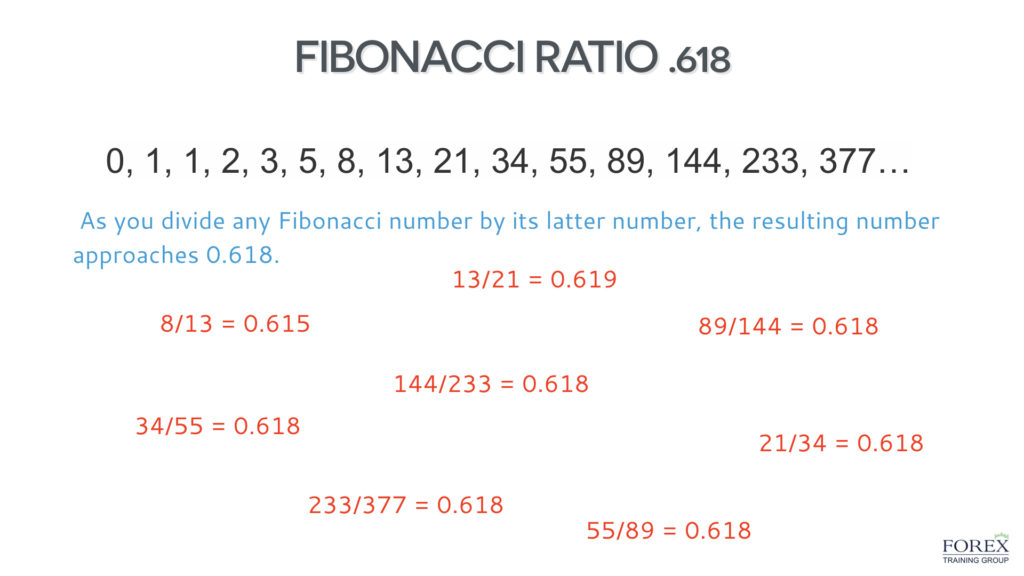
There are many unique characteristics of this set of numbers in both the financial markets and the natural universe. For example, when you divide one number within the series by the next number in the series, the result approaches .618, or 61.8%.
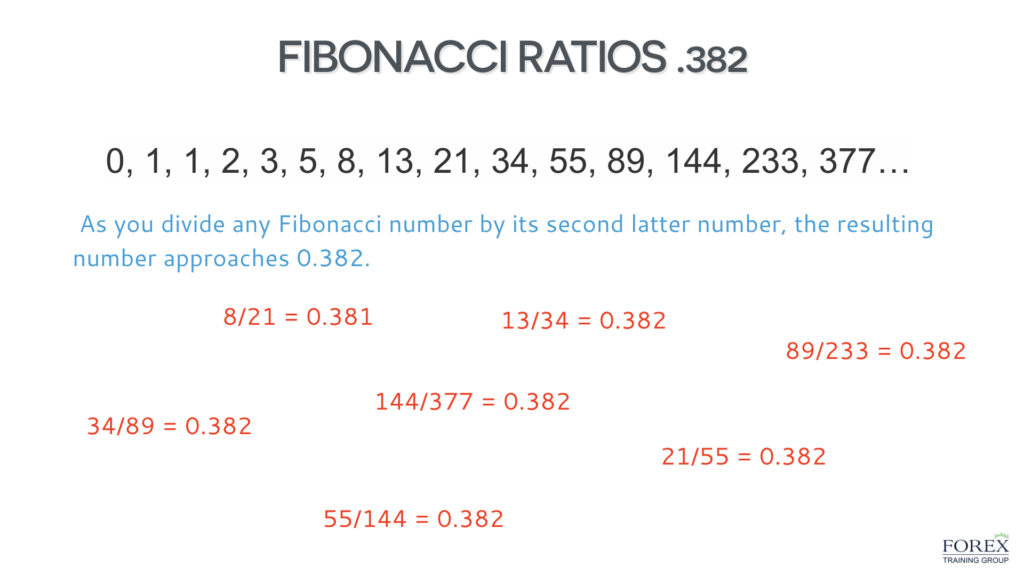
Similarly when you divide one number within the series by the second latter number in the series, the result approaches .382 or 38.2%
Let’s take a few examples of these relationships starting with the 61.8% Fibonacci relationship.
If we calculate 610 divided by 987 we get 0.618
If we calculate 233 divided by 377 we get 0.618
If we calculate 34 divided by 55 we get 0.618
Let’s now see a few examples of the 38.2% Fibonacci relationship.
If we calculate 21 divided by 55 we get 0.382
If we calculate 89 divided by 233 we get 0.382
If we calculate 144 divided by 377 we get 0.382
So as you can see the levels within the Fibonacci retracement tool is derived from important Fibonacci ratios that in turn are based on the Fibonacci sequence of numbers. It’s important to understand the background behind Fibonacci-based tools, because it will give you more confidence knowing that these ratios are based on repeating mathematical relationships that exist throughout our natural universe. These relationships can be seen within galaxies, hurricane systems, sunflower plants, seashells, and fern leafs to name a few. And since man is a part of the natural universe, his actions within the financial markets are also influenced by cyclical ebbs and flows that can be measured using Fibonacci ratios.
Drawing Fibonacci Retracements
Let’s now talk further about the practical application of the Fibonacci retracement tool. First and foremost, we need to learn how to properly apply Fibonacci retracements in up trending and down trending market conditions. Let’s start with plotting Fibonacci retracements in an uptrending market.
Firstly what you will want to do is to scan the most recent price action and find a significant swing high and swing low. Once you have located these two points on your price chart, you will select the swing low and then drag the cursor to the swing high point. These two reference points will serve as the basis for the Fibonacci levels that will then be plotted automatically on your price chart.
The process works the same way for plotting Fibonacci retracements in a down trending market condition. However, the process will be reversed. And so once we’ve selected the most recent significant swing high and low points, we will start with the swing high point, and drag the cursor down to the swing low point. Once these two points are selected, your fib retracement tool will then automatically generate the relevant fib levels.
Here’s an example of how that process works on the price chart. We have used a bullish price trend in this example.
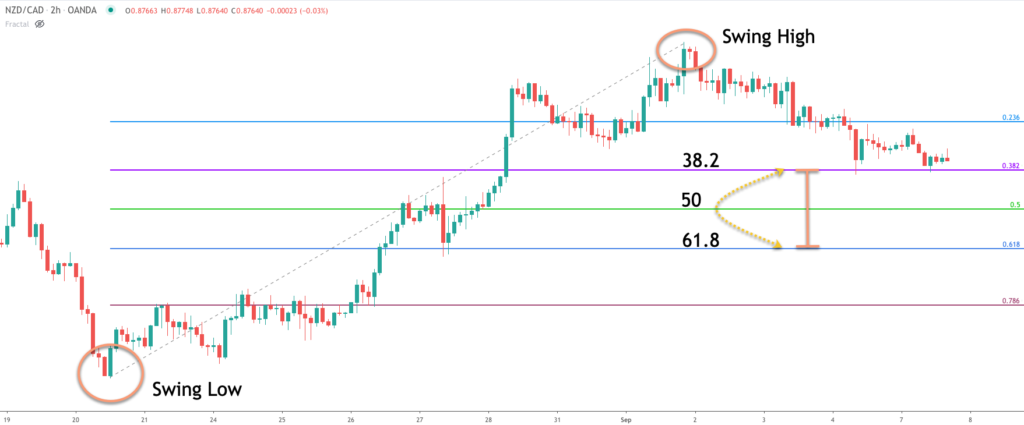
Notice on the above price chart, we have first selected the important swing low within the price action. Then we located the important swing high and dragged our cursor to that point. Once that selection process has been completed, the fib retracement tool automatically plotted the five primary fib levels between our selected swing low and high points. From here our primary objective would be to study the price action around these levels to anticipate a level wherein the corrective price move would terminate, leading to another impulsive move higher. The best Fibonacci levels to watch for would be the 38.2%, 50%, and 61.8% retracement levels. This generally holds true within both uptrending and down trending markets. They represent the most likely turning points in the market following an impulsive price move.
How To Use Fibonacci Retracement Levels
Regardless of your overall trading methodology, you should have a good understanding of support and resistance in the market. They represent areas wherein there is high likelihood of a price reversal. At the same time, when a support and resistance level is broken, that event can also provide valuable clues into the future price direction. There are various types of support and resistance analysis. For example, Trendlines are considered diagonal support and resistance levels, moving averages are considered dynamic support and resistance levels, and Fibonacci price levels are considered hidden support and resistance levels.
Fib levels are considered hidden S/R levels because they are not apparently visible on the price chart. We need to apply the Fibonacci retracement drawing tool manually to the chart in order to actually see these areas of interest. When we have a confluence of different support and resistance levels converging around the same level, this provides us a hint that the price action will likely respect that level, by either rejecting off of it temporarily, or lead to a complete price reversal.
A trader can utilize Fibonacci support and resistance levels in a number of ways. One of the more obvious benefits is to execute opening trades around these levels. Additionally a trader can opt to place a stop loss beyond these levels so as to protect their open position. Last but not least, traders can also incorporate fib retracement levels as a means for managing their positions, and unwinding positions as the prices near these important points within the trade.
It is however important to realize that certain Fibonacci retracements will tend to work better than others depending on the current market conditions. For example, after a strong price move, the market will likely make a retracement of either the 23.6% or 38.2% of the prior leg. On the other hand, after a major price reversal following a sustained price move, the price action is more prone to carving out a deeper retracement such as the 50% or 61.8%. As with any style of trading, there are certain nuances that need to be learned when applying the Fibonacci indicator. As traders become more experienced in their use of fib retracement numbers, they will begin to gain an innate sense for when certain fib ratios will work better than others.
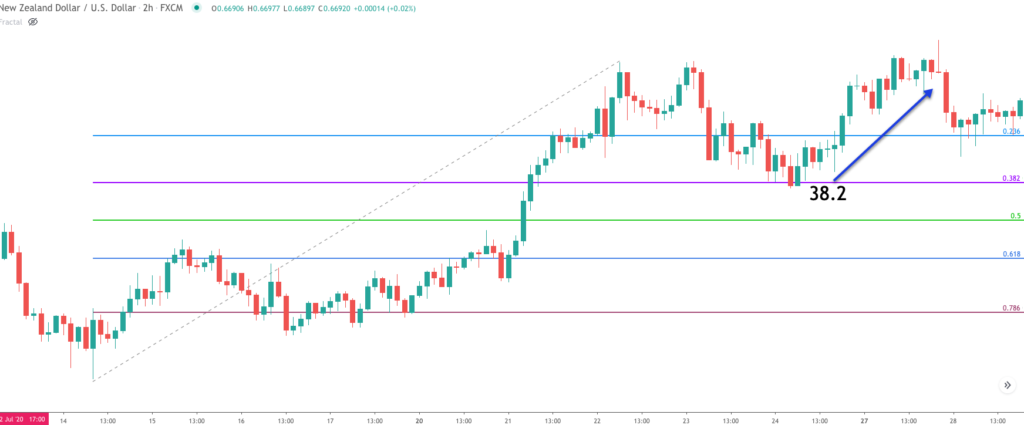
Here’s an example of the 38.2 Fibonacci retracement level acting as support for this uptrending market.
Fibonacci Retracement Trading Strategy
With a basic understanding of the origin of Fibonacci numbers, and their application in the trading environment, we can now begin on our quest to take the knowledge that we’ve gained, and begin to create a methodology for trading the market that incorporates Fibonacci retracement levels.
Now, although fib levels can be amazingly accurate at times, we will not rely on them exclusively. A more prudent exercise would be to create a trading process wherein Fibonacci retracements are just one element within our overall methodology. We want to incorporate a few uncorrelated trading techniques and look for a confluent event. This will improve our win rate and overall confidence in the trade.
So it’s now time to start building a Fibonacci retracement trading plan. Firstly, we will plot our Fibonacci levels on our desired price chart, keeping in mind, that will need to select the most significant swing low and swing high. Once we’ve done that, we will monitor the price action at these important junctures. What we want to look for are two primary conditions at or near an important fib retracement level.
The first condition is that a rejection candlestick in the form of a hammer, a shooting star or Engulfing pattern has formed at or near the fib retracement level. The second condition that needs to be met is for the Bollinger band to be penetrated by the above referenced candlestick formations at or near the Fibonacci level.
Now, let’s take a moment to clarify the logic behind this particular entry set up. Firstly, as we have noted, Fibonacci retracements represent important levels of hidden support and resistance on the price chart. We will often see a price reaction off of these levels. We have added the condition that a reversal candlestick formation be present.
The three types that are of most interest to us will be the hammer candlestick, which is often seen after a bearish price move, the shooting star candlestick, which is often seen after a bullish price move, and the Engulfing pattern, which can either be of a bullish or bearish variety. These candlestick reversal patterns are quite powerful and can foretell the end of a retracement move and even the end of a longer trend move.
Along with the requirement for a reversal candlestick pattern, we will incorporate the Bollinger band study as well. Bollinger bands are volatility based price bands. The essential element of the Bollinger band is that the vast majority of the price action should be contained within the upper and lower thresholds. The default for the Bollinger band is a setting of 20,2. The 20 represents the moving average line within the Bollinger band, and the two setting represents the standard deviation that creates the upper and lower bands of the channel.
Our strategy calls for the reversal candlestick to penetrate the upper line of the Bollinger band for a potential short signal, and alternatively to penetrate the lower line of the Bollinger band for a potential long signal.
Once these conditions have been met, we can then confirm that a valid trade set up has occurred. Let’s now outline the exact trade management rules for this fib strategy.
For long entry the following conditions must be met:
- Price is at or has recently touched an important fib retracement level
- A hammer, or bullish engulfing candlestick has formed near the retracement level
- The candlestick reversal pattern must have penetrated the lower line of the Bollinger band
- Enter a long position one pip above the high of the reversal candlestick pattern.
- Stop loss to be placed just below the low of the reversal candlestick
- Take profit point will be at an important resistance level above the market
For short entry the following conditions must be met:
- Price is at or has recently touched an important fib retracement level
- A shooting star, or bearish engulfing candlestick has formed near the retracement level
- The candlestick reversal pattern must have penetrated the upper line of the Bollinger band
- Enter a short position one pip below the low of the reversal candlestick pattern.
- Stop loss to be placed just above the high of the reversal candlestick
- Take profit point will be at an important support level below the market
Fibonacci Retracement Strategy – Trade Example
Now that we have a set of rules for our fib trading strategy, let’s now apply that in the Forex market. Below you will find the price chart of the US Dollar Singapore Dollar currency pair based on the eight hour trading timeframe.
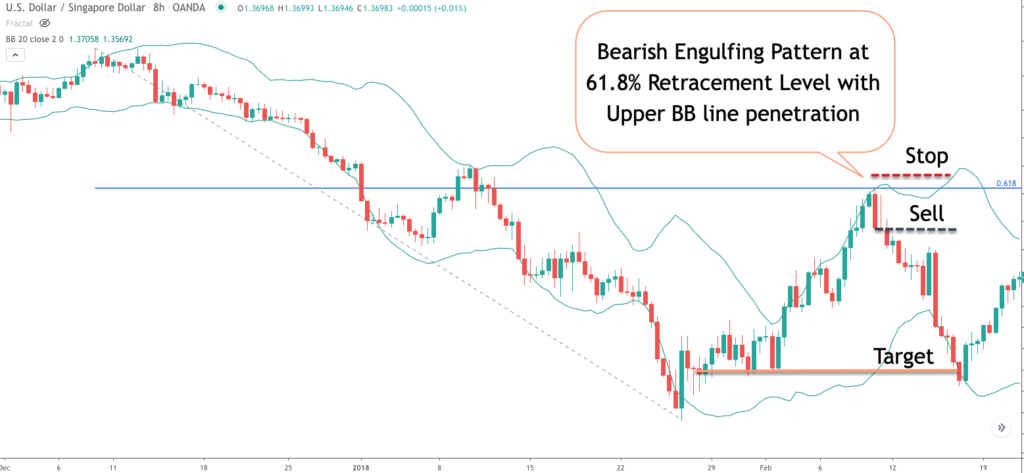
The green bands shown on the chart represent the Bollinger bands indicator. The blue horizontal line shows the 61.8% fib retracement level. You can see the two swing points that I used in the construction of the Fibonacci retracement.
The first is the swing high on the left side of the screen followed by the swing low near the bottom of the screen. If you follow the gray dotted lines pointing downward, you will clearly see where those two points lye. For the sake of clarity, I’ve only included the 61.8 retracement level on the chart. It’s the one that we will need to refer to for this particular trading scenario.
So let’s now begin to dissect the price action and go through the thought process behind this particular trait set up. Starting from the left side of the chart, we can see that a strong downtrend has been in place. Notice how the price action hugs the lower Bollinger band during a large portion of the price decline. This is the typical behavior seen during a relatively strong downtrend.
Shortly after the major swing low was put in, prices began to consolidate in a range bound manner before continuing to correct to the upside. Eventually price was able to reach the 61.8 Fibonacci retracement level. But just as price tested this level, it was rejected sharply to the downside.
The rejection took the form of a bearish engulfing pattern, which is a two bar pattern, wherein the second bar is a bearish bar, and completely engulfs the prior bar. If you look closely at the two bar formation at the 61% retracement level, you will be able to identify these characteristics.
Once we are able to recognize the candlestick reversal pattern, the next step would be to confirm that the bearish engulfing pattern here had penetrated the upper line of the Bollinger band. Again if you look closely at the price chart you can see that this event did indeed occur, meaning that the high of the bearish engulfing did breach the upper boundary of the Bollinger band. Now that the primary conditions have been met for this forex Fibonacci trading strategy, we can now prepare for a short position.
In accordance with our entry rule, the sell signal would occur one pip below the low of the bearish engulfing pattern. Notice the black dashed line which depicts where the sell signal was triggered. The stoploss would be placed just beyond the high of the bearish engulfing pattern as can be seen by the red dashed line above our sell entry.
Now the final decision that we need to make is where we want to exit this position. Referring to our take profit rules, we know that our strategy calls for exiting the position near an important support level below the current market.
I’ve drawn the orange horizontal line near the bottom of the chart which represents an area of consolidation that occurred previously. We would expect it to be a likely area of support in the future.
As such, we would want to exit our short position just prior to that level. You can see how the price action moved quickly to the downside following are sell signal, and continued just below our target level before retreating back to the upside.
As for our position, we would have been able to take our profits and exited the trade just prior to this reversal. This forex trading strategy with Fibonacci retracements is quite simple to implement. You may want to demo trade the strategy until you become comfortable executing it on your preferred trading instruments.
Summary
Fibonacci retracements in Forex work similar to other markets. Unfortunately, many new and inexperienced traders are unfamiliar with the proper use of the tool for achieving the best results. We’ve addressed some of the best practices in applying Fibonacci retracements to the charts, and presented a trading strategy that incorporates fib levels as a primary component. The most important take away should be that fib retracement levels should not be used in isolation. Instead they offer a great deal of predictive value when combined with other non-correlated technical studies.