Understanding the reason why a currency pair moves is essential to development of every forex trader. At the most basic level, price moves due to supply and demand imbalances in the market at any given time. Once you are able to grasp this concept, you can view trading from a logical lens.
Today we will discuss supply and demand trading strategies in Forex. We will learn how to identify supply and demands levels and how to apply the levels within a comprehensive trading strategy.
Supply and Demand in Trading
The supply and demand concept is a core component of economic theory. The Supply and Demand rule states that if the supply of a commodity is high and the demand is low, this generates excess which drives the price down. And conversely, if the supply of a commodity is low and the demand is high, this creates a scarcity, pushing the price higher.
The rule is pretty easy to understand and it could be applied to anything, which falls in the group of tradable resources.
Applied to the forex market, if the supply for a currency pair is high and the demand is low, it will drive prices lower. If the supply for a currency pair is low and the demand is high, this will act to drive prices higher.
The supply and demand of a currency pair is determined by the players in the Forex market. These are governments, banks, investors, funds, and speculators. Thru their actions in the market, the participants in the Forex market are constantly shifting the supply and demand of currency pairs, causing the price to fluctuate. If you open a currency trade you are taking part in the supply and demand equation within that market.
What are Supply and Demand Zones in Forex
The supply and demand imbalances in Forex can be seen visually on the price chart. Each tick on the graph represents changes in the traders’ attitude toward the respective pair. Thus, if traders have a certain bias for a currency pair at a certain level, this can be recognized on the Forex chart by the informed trader.
For example, if the currency pair is moving downwards on selling pressure, some traders will position pending buy orders at certain levels below the price. These people do not believe that the pair will go much lower beyond their buy limit order. They place buy orders at this level to purchase the pair on the assumption that the bearish move is likely to stall. If a large group of people do this, or even if a large institution does this, there will be accumulated a big volume of pending orders around this specific level. This means the demand will increase as price reaches this level, which is likely to cause a sharp price increase as price approaches this level.
The same is in force in the opposite direction as well. When big volumes are accumulated at a certain level above the price, the supply will increase, which can cause the price to drop sharply upon reaching that supply zone.
As such, traders should be aware of these two important levels within their charts, where prices are likely to rise and fall – the Demand Zone and the Supply Zone.
Demand Zone
A Demand Zone is a price area below the current price action where there is strong buying interest. Looking at the chart below, we can see that there was a lot of buying interest at the demand zone, most likely caused by a large volume of resting buy orders at this level. For this reason, when the price reaches the demand level, as shown below, the orders get executed and a certain portion of the pending order volume gets absorbed. Typically, you will notice a sharp price reaction from the Demand Zone, and the sharper the price reaction, the more pending buy orders are resting there.
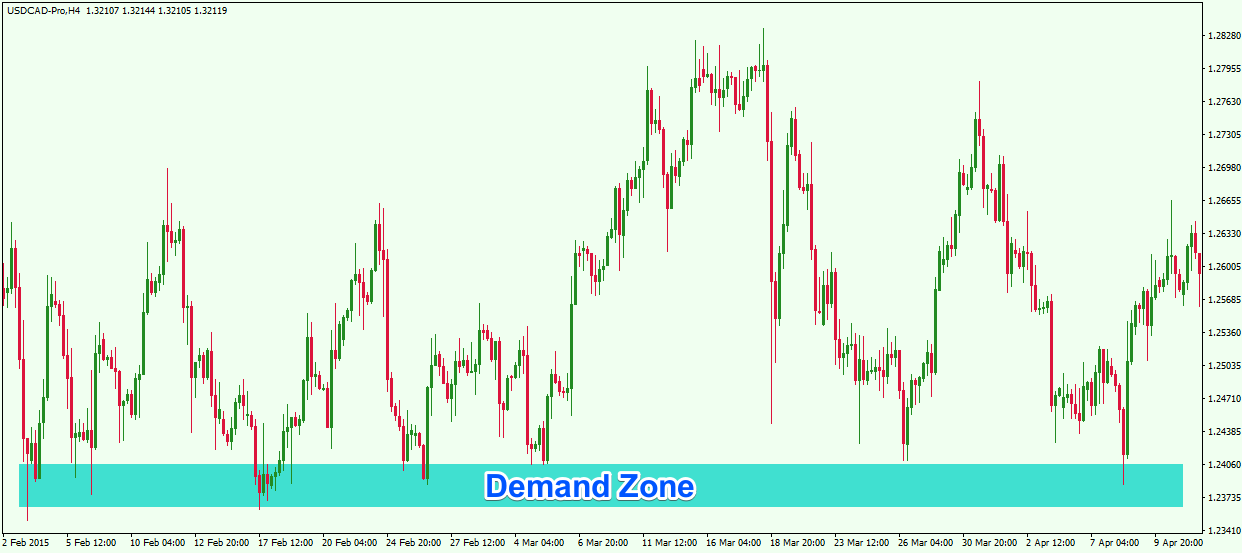
Above you see the H4 chart of the USD/CAD Forex pair showing a strong demand zone between 1.2400 and 1.2360. Notice that every interaction with this level results in a price increase. It is important to refer to the Demand levels as an area and not as a single line on the chart.
Supply Zone
The Supply Zone is the exact opposite of the Demand Zone. A Supply area is located above the price action and it typically contains a relatively big volume of sell orders. When the price action reaches this level, the orders start to get executed. Traders are selling the Forex pair and the price action reverses to the downside. As with the Demand, the Supply zone refers to an area and not a single level.
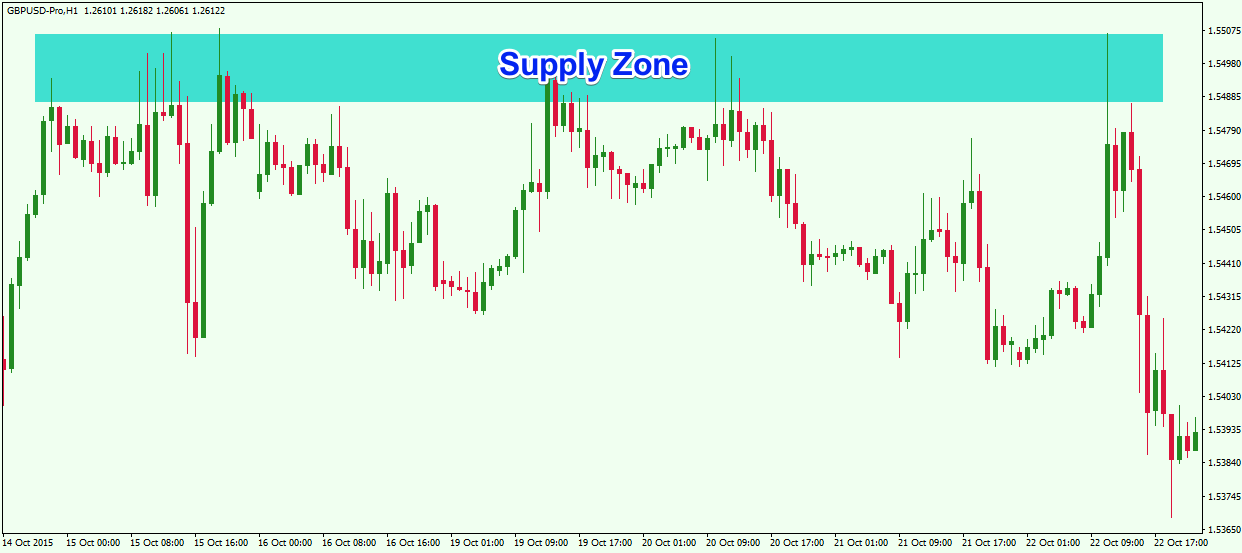
Now we have the H1 chart of the GBP/USD Forex pair. This time the image shows a supply zone on the chart. See that every time the price action interacts with this supply area we see a decrease in the price.
As noted earlier, when the price action reaches a supply or demand zone, it is likely to reverse its direction. Therefore, these zones are used by price action traders to enter the market in the respective direction.
If the price action decreases to a demand zone and bounces upwards, this creates an opportunity to trade the currency pair upwards. When the price jumps to a supply area and bounces downwards, this creates an opportunity to trade the market in a bearish direction.
Drawing Supply and Demand Zones
It is always a good idea to draw the supply and demand areas on the chart. This way you will be aware visually where the zones are, and be prepared to trade the market when the price reaches the appropriate S/D zone.
How to Find Supply and Demand Area on the Chart
So then the natural question becomes: “How do I find supply and demand areas on the chart?” Identifying supply and demand zones is fairly straightforward once you know what to look for. First, zoom out your trading time frame chart and switch to the next higher level time frame. The next level timeframe is 4x or 5x, your trading timeframe. By doing this, you will have a bird’s eye view on the overall price action.
Then find turning points in the price action where prices have reacted sharply. Typically, a turning point where the price moves quickly away from the level downwards, can be considered a supply level. And conversely, a turning point where the price moves quickly away from the level upwards, can be considered a demand level.
When you find the turning point zone simply grab a rectangular shape drawing object from your trading platform and stretch it to the right. Alternatively, there are some supply and demand trading indicators that are available in the market that you may be able to use.

Above you will see the Weekly chart of the AUD/USD which displays a supply level.
Supply and Demand Analysis in Forex
A supply and demand based trading system is a relatively simple, yet powerful way to trade Forex. It is considered one of the purest price action trading mythologies around.
The rules of supply and demand analysis in Forex are quite simple. You should buy when the price action approaches a demand level and bounces upwards. You expect the price to increase as a result of the aggregated buy orders in the demand zone. Therefore, you have the opportunity to ride an upcoming price swing.
You should sell when the price reaches a supply level and bounces downwards. You assume that the price action will begin to trigger the aggregated sell orders in the area, which is likely to lead to a price drop. Thus, this creates an opportunity to ride a bearish move on the chart.
You would put a stop loss order right below the demand area when you are long in the market. Conversely, put your stop loss order right above the supply area.
The most common approach is to hold your trades until the price action reaches the opposite level on the chart. So, if you are trading long a demand level, you should hold your trade until the price action reaches the next supply zone on the chart. Opposite to this, if you are trading short a supply level, then you should hold your trade until the price reaches the next demand level on the graph.
Many times, however, there is no clear level to target or it may be too far away. Often the price may not likely be able to reach an opposite level during its move. Therefore, I suggest you also use simple price action derived analysis when you determine your exit point on the chart. To do this, you can use different price action clues such as trends, channels, or by analyzing swing tops and bottoms.
Trading Supply and Demand with Price Action Trade Management
Now let’s apply the guidelines above into a Supply and Demand trading example.
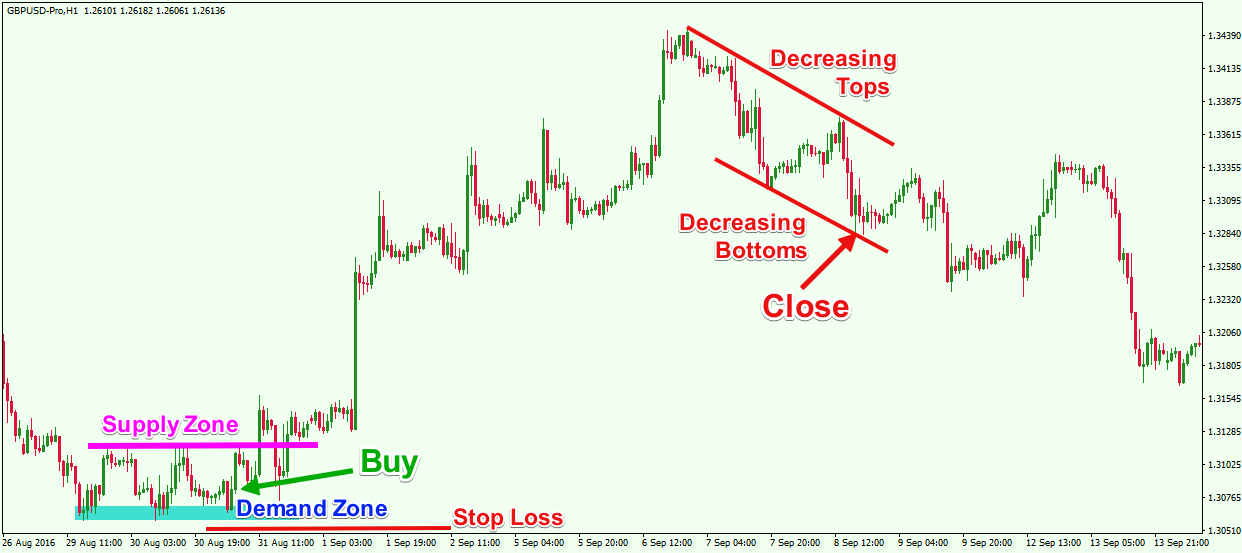
We have a zoomed out picture of the H1 GBP/USD chart. At the bottom left corner we see a supply and demand zone. The demand zone is marked with blue and the supply zone is indicated with magenta. See that the price action creates the demand zone after a previous decrease. The price bounces several times from the demand zone, and we would have had several opportunities to enter the trade.
We assume that the demand zone will trigger new long orders, which will push the price upwards. The stop loss order should be placed below the demand zone as shown on the image.
Notice as the price increases from the demand zone, that it eventually reaches the nearest supply zone above. However, the price action breaks the level with high momentum cluing us in that the level is not strong, and that the GBP/USD might extend its bullish run. For this reason the trade could be held on the assumption that the increase will continue.
This is exactly what happens. The price initiates a new rally. On the way up we see increasing tops and increasing bottoms, which confirms that the GBP/USD is in a strong bullish trend. The increase continues for 1 week. A bearish attitude is demonstrated afterwards. The red bearish channel on the chart shows decreasing tops and decreasing bottoms. This is a strong indication that the bullish trend is most likely finished and that a bearish trend might ensue. Therefore, it would be a good option to exit the trade on the second descending bottom on the chart after the creation of the two descending tops. Now let’s demonstrate the opposite scenario, a supply side trading example:
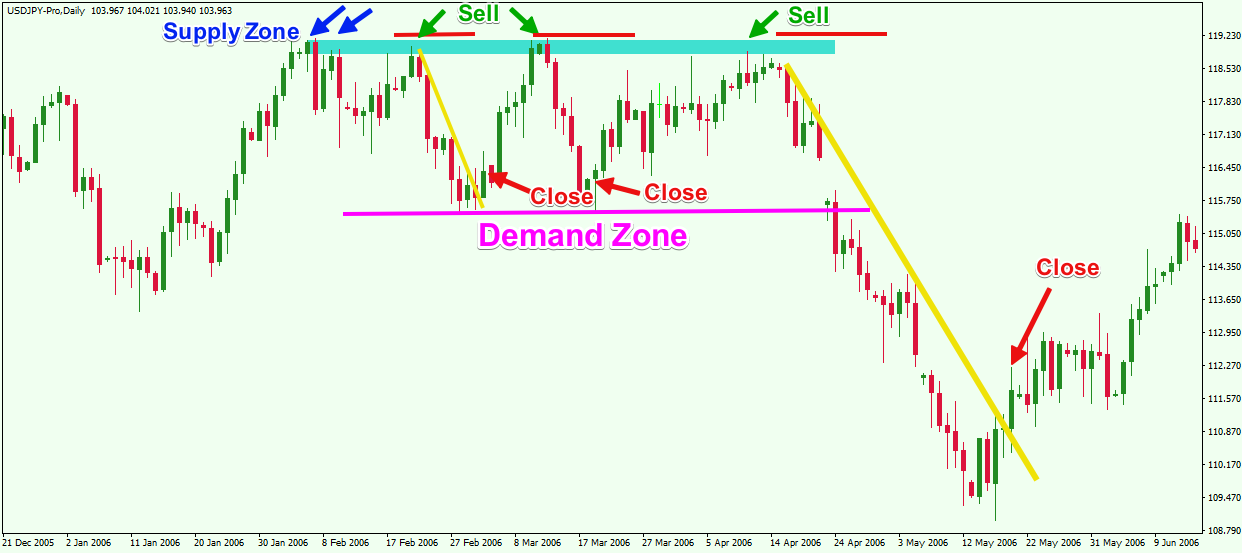
This daily chart of the USD/JPY above shows a trade example with a supply zone.
The two small blue arrows on the chart show the creation of the first two tops in the supply zone. We will look for Short trades that interact with that level.
The USD/JPY could be sold after the bounce as shown with the first green arrow on the chart. The price starts decreasing afterwards. Soon after, a swing low is created and we see a sharp price move to the upside. This area subsequently forms a solid demand zone on the chart.
The price returns to the supply zone for a re-test afterwards. See that the USD/JPY bounces sharply in the bearish direction. This creates another short opportunity on the chart. The pair could be sold again after the bounce from the level. After the price decreases, it reaches the magenta demand level on the chart, creating another bounce. The second short trade could be closed when you recognize the bounce from the magenta demand line.
The price returns to the supply zone and bounces again downwards. This leads to a new price decrease. However, this time the price action creates a strong market gap down and almost goes through the already established demand zone, meaning that the bearish force is stronger than usual. In this case you would have had a sufficient reason to hold the trade on the assumption that the selling pressure has taken over, and the pair is entering a bearish trend.
We use the big bearish yellow trend line to measure the intensity of the downwards move. Then we hold the trade until the price action breaks the yellow bearish trend line. The last red arrow shows the moment when price breaks thru the trend line to the upside, which would be a valid signal that the trade needs to be closed.
The stop loss orders for the three short trades are indicated with the red horizontal lines above the supply zone.
Conclusion
- The rule of supply and demand states that:
- Price increases when demand is higher and supply is lower.
- Price decreases when supply is higher and demand is lower.
- The supply and demand rule applied in Forex trading means:
- Price increases when there is a high buying pressure (demand).
- Price decreases when there is a high selling pressure (supply).
- Supply and demand zones in Forex are turning points where the price action is likely to reverse.
- These levels can be visually expressed on the Forex charts:
- A demand level is located below the price action and it is expected to create buying pressure due to pending / unfilled orders in that area.
- A supply level is located above the price action and it is expected to create selling pressure due to pending / unfilled orders in that area.
- To draw a supply or demand zone on the Forex chart you should:
- Identify an area where the price action has created a swing level with a sharp price move.
- Stretch a rectangle drawing tool from left to right to mark the area
- To trade supply and demand methodology in Forex you should:
- Buy when the price bounces upwards from a demand area. Place a stop loss below the zone.
- Sell when the price bounces downwards from a supply area. Place a stop above the zone.
- Hold your trade at least until the price action reaches an opposite level on the chart or use price action rules to manage the trade.