There are dozens of different candlestick patterns that are available to market traders. Some of these patterns come in the form of a single candle, while others are seen as double and triple candle formations. In our discussion here, we will focus on a specific single candle pattern referred to as the shooting star. It is a reversal pattern that is most often seen after a price rise. It’s a powerful pattern that will often call market tops, and the end of rallies within an overall downtrend.
Shooting Star Pattern In Technical Analysis
The shooting star formation is a single candlestick that is often seen after a prolonged price move to the upside. Additionally, it also forms after a corrective phase within the context of a larger downtrend. We will be taking a closer look at both of these scenarios in this lesson, but for now, it’s important to understand a few primary characteristics of the shooting star pattern. And that is, that it is a single candle formation with bearish implications and that it occurs after a price rise. Some technical analysts refer to it as a bearish pin bar as well.
Let’s now take a moment to dissect the anatomy of a shooting star formation.
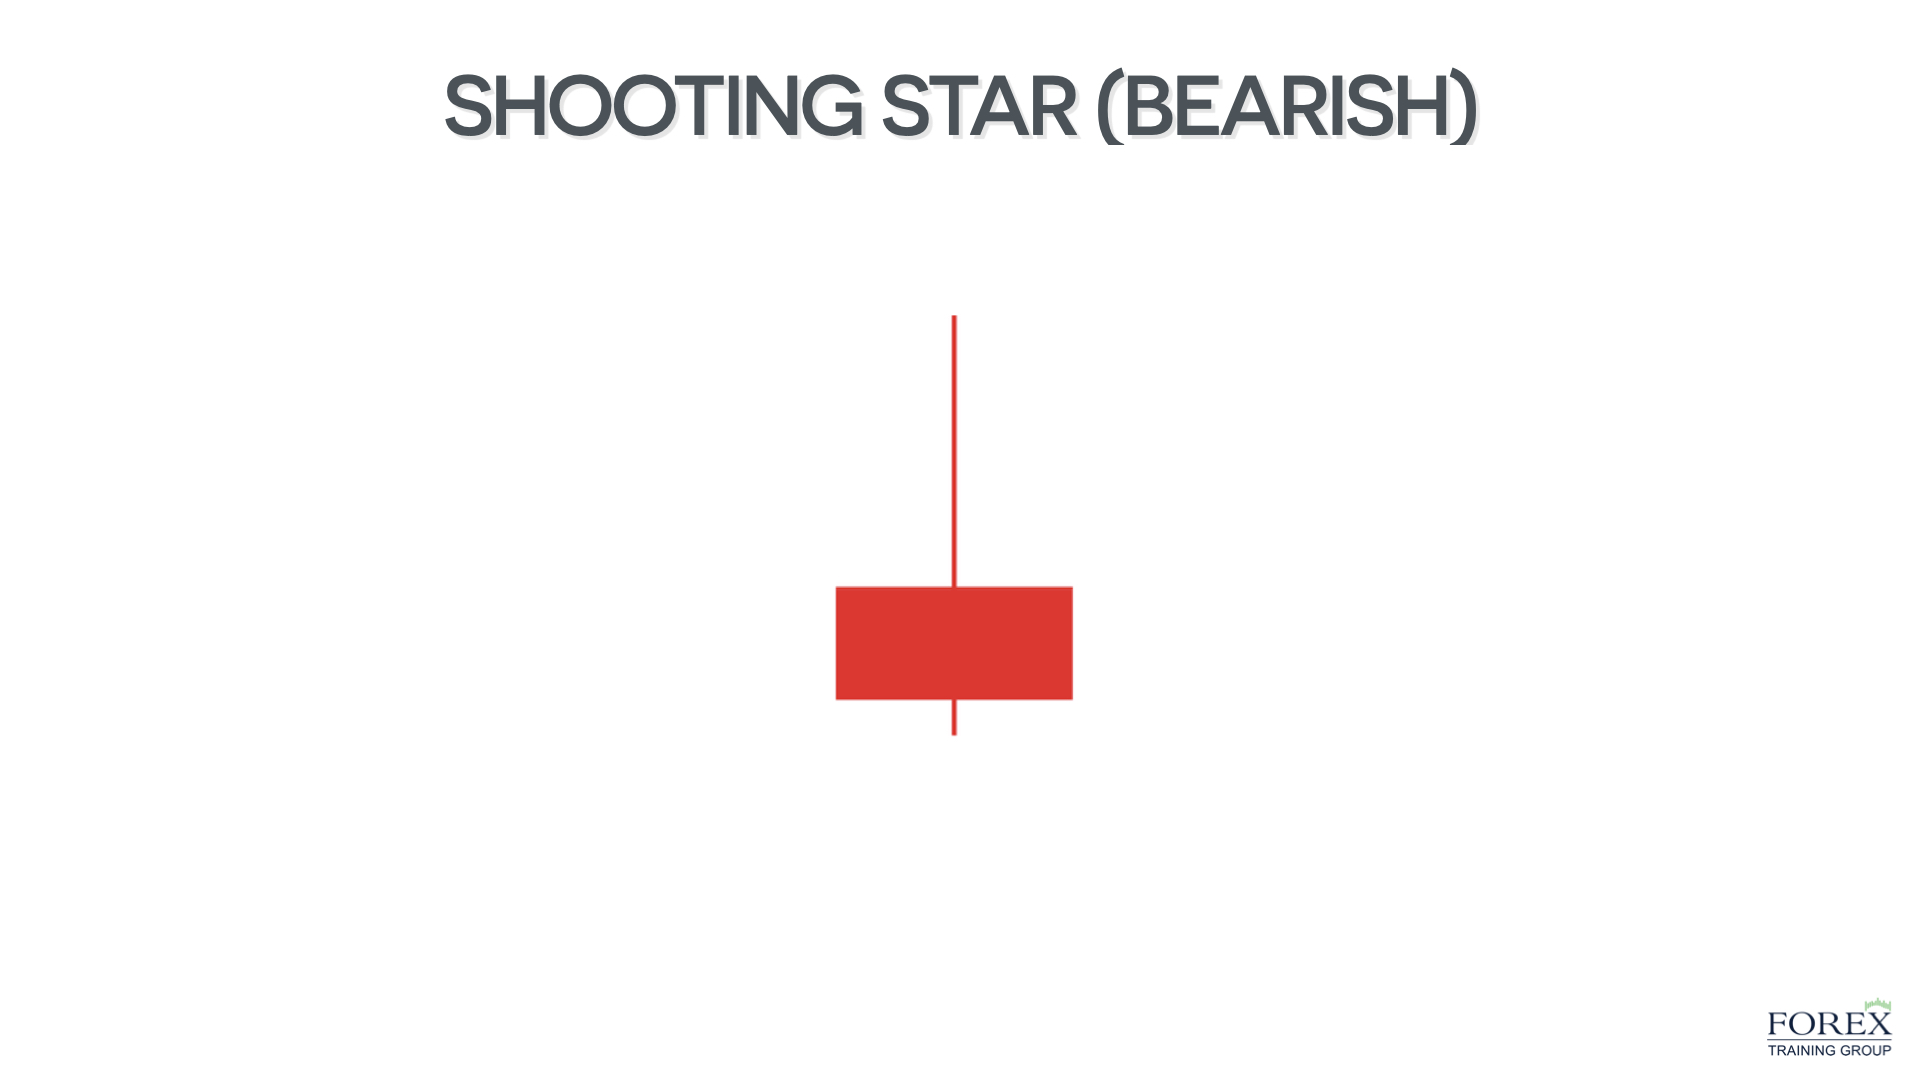
In the illustration above you can see what the shooting star candlestick appears like. Notice the long upper wick within the shooting star formation.
This is often referred to as a shadow or a price rejection to the upside. Additionally, note how the open, and the close occur near the bottom third of the price range.
There are no exact rules as it relates to the labeling of a shooting star pattern, however, as a general guideline, we want to see a long upper wick, a relatively small body, and a short lower wick.
If we take a moment to understand the dynamics behind the shooting star candle, it will strengthen our resolve when it comes to trading the pattern. So what is going on behind the scenes in a shooting star candle?
Let’s refer back to our illustration above for further clarification. Notice how the price opens near the lower one third of the range, and then the bulls push the prices higher, which is represented by the upper shadow of the shooting star pattern.
The bulls, however, could not maintain the price move higher, as sellers came in and overwhelm the buyers with their supply-side orders. This leads to a sharp move lower as the sellers are the ones that are truly in control of the market during this time.
This is evident from the closing price within the shooting star, which occurs within the lower one third of the price range. So essentially, we consider a shooting star pattern to be an upside rejection pattern. The implication of which is that the supply in the market is higher than the demand, thus, a continued price decline should ensue.
It’s important to note that the most reliable shooting star patterns are the ones that occur on the higher timeframe price charts. We want to focus on timeframe such as the four hour, eight hour, daily, weekly and monthly when scanning for shooting star formations. The daily timeframe chart offers the best combination of reliability and frequency as it relates to the shooting star candlestick formation.
Bearish Shooting Star Candlestick
Anytime that you find this formation on the daily chart and wherein it occurs in context of an uptrend, you will want to pay close attention to the price action of the next few bars following it. If price breaks out below the low of the shooting Star formation, it will often lead to further downside momentum.
Another way to play the shooting star pattern, is to wait for a 50% retracement of the candle’s range before initiating a short position. There are a few risks associated with this type of entry technique. The first being that the market could move lower immediately, and without a significant retracement that triggers at our required level.
This would mean that we would miss out on the opportunity to trade the shooting star set up in this case. Alternatively, the other risk is that by entering at a retracement of the shooting star’s range rather than the break below the low of the shooting star candle, we run a bigger risk of prices moving higher and potentially hitting our stop loss.
Depending on your comfort level and style of trading, you may choose one entry method over the other or choose some other variation altogether. In any case these are just a few of the ways in which we could structure a short trade following the bearish shooting star candlestick.
Let’s now take a closer look at two typical scenarios wherein the shooting star formation is often seen. The first scenario is when the market is exhibiting a clear uptrend, and the second scenario is when the market is correcting to the upside within a larger downtrend.
We’ll start off by taking a look at a price chart that prints a shooting star candlestick in an uptrend.
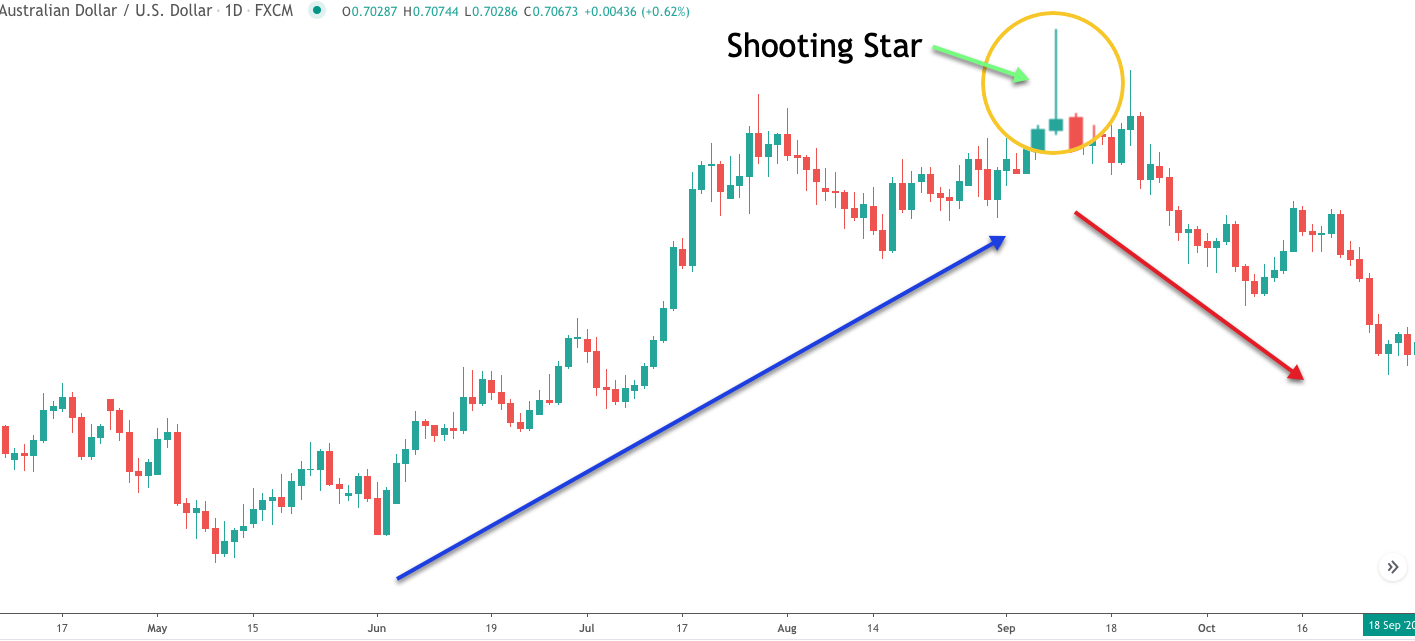
On the price chart above you can see that the price action was moving higher. Notice how the market is making higher and higher swing lows, and making higher and higher swing highs as well. This is a clear indication of a bullish trend in progress. At some point during the uptrend, the momentum behind price action began to wane. This can be seen by the overlapping price action leading up to the shooting star candle.
The overlapping price action is indicative of a slowing trend. After this sluggish price action higher, we can clearly see that a shooting formation prints on the price chart. The actual shooting star candle has been magnified for easier viewing. Notice that it meets all of the criteria for correctly labeling it as a shooting star formation. Firstly, it occurs as the price action is moving higher. Secondly, the upper wick is very prominent, and the open and close are both at the lower end of the range.
A corrective phase is essentially a price move that occurs against the primary trend. So, if the primary trend is up, then the corrective phase would occur as prices are moving lower. Similarly, if the primary trend is down, then the corrective phase would occur as prices are moving higher.
As it relates to the shooting star pattern, will often find that it occurs within the context of the latter. That is to say that it can occur as prices are moving higher in a corrective phase against the larger downtrend. Let’s take a look at an example of such a scenario.
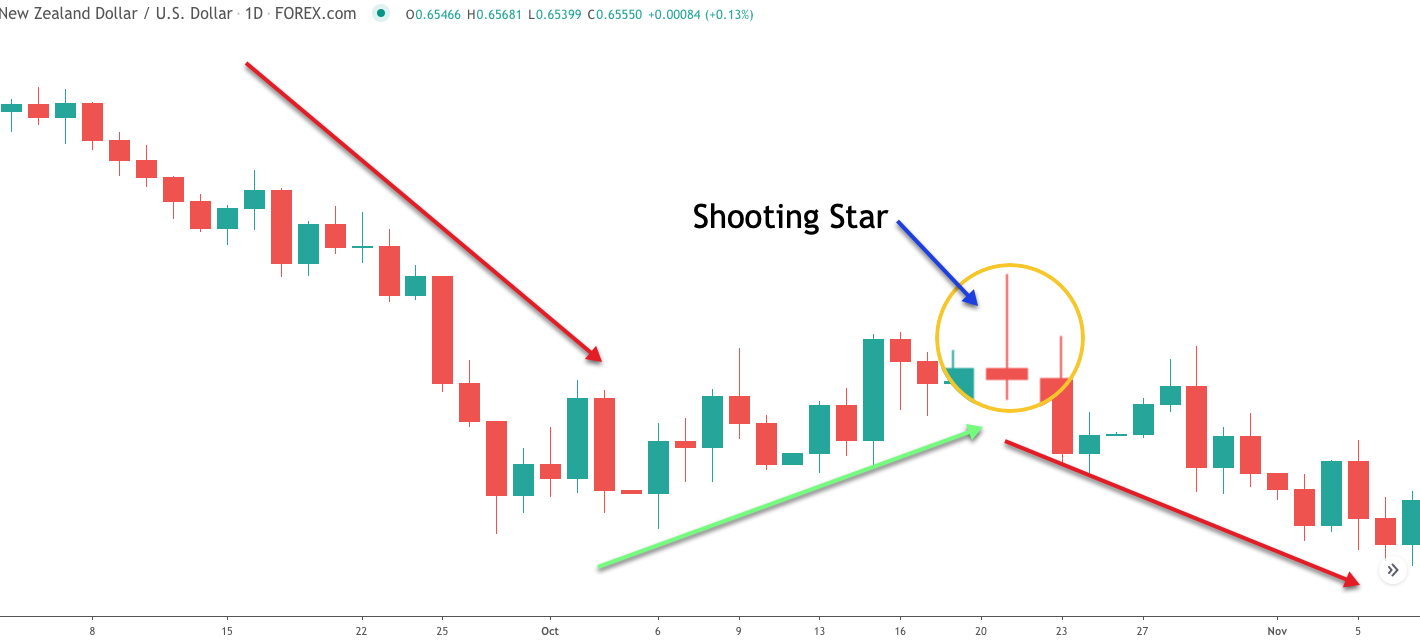
If you look closely at the price chart above, we can see that the major trend of this market leading up to the shooting star formation is bearish. At some point, the sharp bearish price move began to subside, as the price action started to move higher. This upward price move is considered as a correction or pullback trading opportunity. The shooting star chart pattern that emerges at the termination of the upside correction has been magnified for easier viewing.
Notice that immediately following the bearish shooting star formation, that the price continues to move lower, in concert with the larger bearish trend. This is an example of a shooting star forming within the context of a larger bearish price move. The implications are the same as our previous example. And that is to say that we should expect downward price pressure following a confirmed shooting star pattern.
Shooting Star Trading Strategy – Counter Trend Setup
Now that we have a good understanding of the shooting star pattern and when it is most likely to occur, let’s build upon that knowledge, and see if they can create a trading strategy around it. We’ll start with the of countertrend variation of the shooting star set up.
We want to build a simple yet effective strategy for trading the shooting star that will be easy to implement in the market. Firstly, we want to confirm that an uptrend exists prior to the shooting star formation. This is an important requirement because we know that a valid shooting star pattern should occur in a rising market.
As long as we can see that the price action is moving higher, with successively higher highs and higher lows, then we can be confident that an uptrend is in place. Once this condition has been confirmed, along with all the requirements for a valid shooting star pattern, then we will prepare for a potential short trade.
In order to do this, we will need to draw an uptrend line that connects the lower swing points within the rising trend. The shooting star pattern must occur above this uptrend line, and the price must break below this trendline within five bars of the shooting star formation. The actual sell signal will be triggered upon a candle close below this upsloping trendline, assuming that the other conditions have been met.
The stop loss on the trade will be set at the high of the price bar that breaks below the trendline. Essentially, that is the bar that acts as our entry confirmation signal. Finally, we will need a way to monitor the price action if it moves in our favor to the downside, and exit the trade when the weight of evidence is pointing to an upside reversal. In this case, we will employ the nine period simple moving average as the mechanism for trailing the price action and issuing our buy exit signal. More specifically, when the price crosses above and closes above this nine period simple moving average line, we will exit the position completely.
It’s important to note that there is nothing magical about the nine period simple moving average line. You could just as well use a slightly shorter or longer variation as well. The point is that whichever exit mechanism that you use, you should be consistent in your application of it. So there you have it. A simple yet robust method for trading the shooting star formation as a countertrend setup.
Shooting Star Trading Example – Counter Trend Setup
Let’s now illustrate the shooting star trading strategy that we just outlined. If you refer to the price chart below you will find the price action for the GBPJPY currency pair as shown on the daily timeframe.
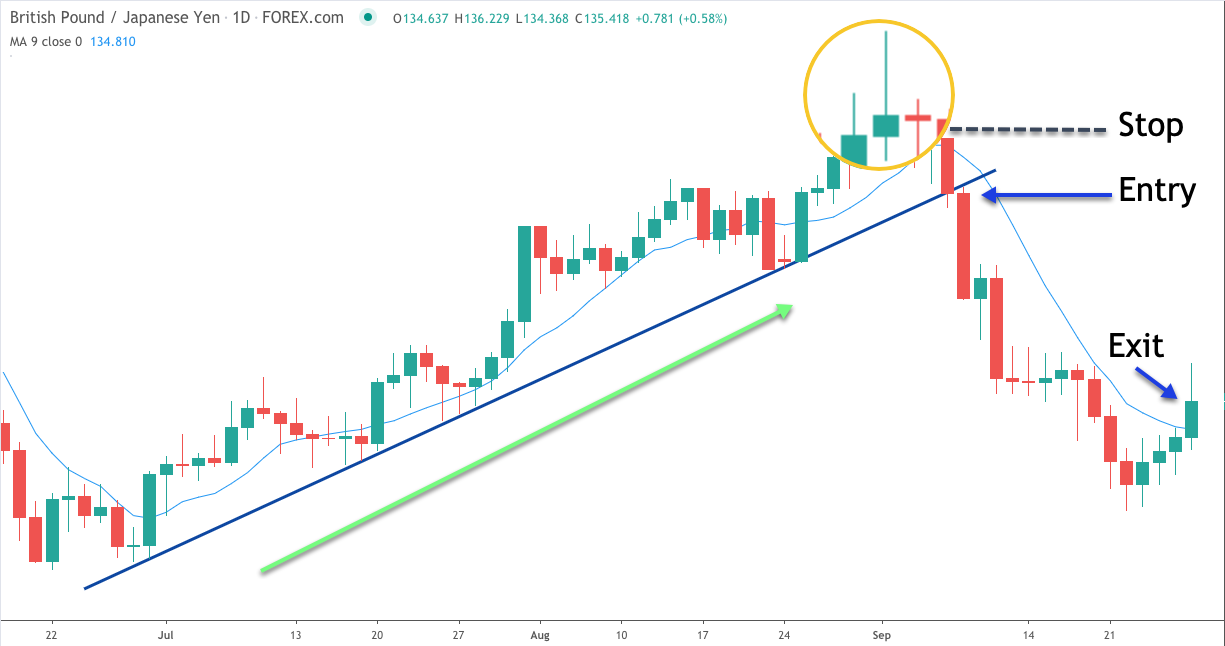
Let’s see what we can gather from this price chart. Firstly, we can see within the magnified area near the top right of this image, a clearly defined forex shooting star candlestick. Remember, a valid shooting star candle pattern should meet a few important guidelines. Firstly, the upper wick within the shooting star should be quite noticeable and prominent in relation to the lower wick or shadow of the candle.
Secondly, the open and close of the candle should occur near the bottom one third of the price range. And also, the body of the shooting star formation should be relatively small. If we analyze our shooting star formation here, we can see that all of these important guidelines have been met. As such, we can confidently label this candlestick as a shooting star pattern.
Now that we have recognized a shooting star formation on the price chart, we need to confirm whether or not it occurs in the context of a rising market. Obviously, we can see that the price action preceding the shooting star was clearly bullish.
Notice how the price moves higher in a nice stairstep fashion with successively higher highs and higher lows during its progression. With the uptrend confirmed, we can now draw a trendline connecting the swing lows within the upward moving price action. You can see the upward sloping blue line that we have drawn as our trendline.
Now all there is left to do is to wait for the price action to show its hand. That is to say that if the price breaks below this uptrend line within five bars following the shooting star pattern, then we will have a signal for a short trade.
Looking closely at the number of candles following the shooting star pattern, we can see that the third candle broke below and closed below the upsloping trendline. As such, that event served as the confirmation for a short entry based on this trade set up. You can see that confirmation bar noted as Entry on the price chart above. We will place a market order to sell immediately following the close of that candle.
The stop loss should be placed beyond the high of the breakout candle. You can see the stop loss noted accordingly. So now we have protected the position in case the trade begins to move against us. Fortunately for us, the price action started to move lower precipitously following the breakout signal. Our exit plan calls for monitoring the price action closely and waiting for a candle close above the nine period simple moving average line.
The light blue line shown on the price chart is our nine period moving average line that serves as the exit signal. After a sharp drop from the shooting star candle, the price started to print a few consecutive green bars. This upper price momentum continued until one of those bars finally closed above the nine period SMA line. That event served as the exit signal, which would have closed out this trade with a profit.
Shooting Star Trading Strategy – Pullback Setup
Let’s now explore another example of the shooting star trading set up. This time we will look at trading the shooting star candlestick when it appears within the corrective phase of a larger down trending market. As such, we consider this as a shooting star pullback set up.
Here, we will be looking for a valid shooting star pattern that occurs in the context of a downtrend. The shooting star pattern must still occur after a price move higher, however in this case, that price rise should be a correction to the larger downtrend. Once we have identified these conditions, then we will prepare for a short trade.
One of the best ways to trade a rejection pattern such as the shooting star formation within a corrective phase is to first locate a market that is trading within a clearly defined bearish channel. Once we have found such a market, then we would wait for a shooting star formation to form during one of the pullback legs. We want the shooting star to either touch or penetrate the upper line of the bearish channel. This event would serve as our confirmation for the shooting star pullback set up.
The entry signal from this pattern set up would occur immediately following the close of the shooting star candle. That is to say immediately following the shooting star formation, we will place a market order to sell. The stop loss placement would be just above the high of the shooting star candle itself. Since the high of the shooting star candle serves as a potential level of resistance, this would serve as a logical level at which we would want to exit our trade with a small loss.
If however the price begins to move in our favor following a short entry, then we will watch the price action closely as it trades within the bearish channel. The exit signal would be triggered upon the price touching the lower line of the bearish channel. Once this occurs, we would immediately exit the trade.
Shooting Star Trading Example – Pullback Setup
Now that we have outlined the rules for the pullback variation of shooting star set up, let’s now go to the charts and illustrate it in more detail. Below you will find a price chart of the Canadian Dollar to Swiss Franc currency pair. The price action shown is based on the daily timeframe.
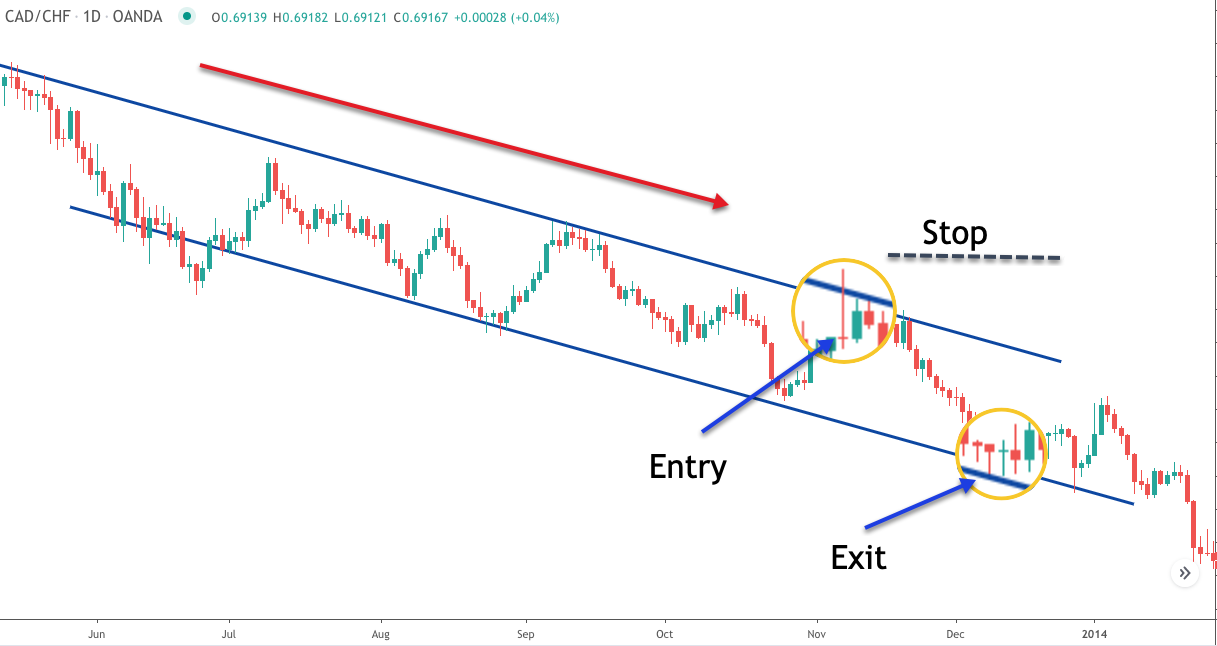
First and foremost, we will need to spot a potential shooting star formation on the price chart. Referring to the upper magnified area on this price chart, we can clearly see the forex shooting star candle formation. It has all of the characteristics that we like to see within the structure.
That is to say that the upper wick of this candle is very prominent in comparison to the lower wick. Additionally, the open and close of this formation occurs near the bottom of the range. And finally, the size of the body within the candle should be relatively small. If you examine the shooting star formation here, it’s quite evident that all of these characteristics have been met.
Now that we have a valid shooting star formation identified on our price chart, we need to check whether or not the price action is in an overall downtrend, and trading within a relatively well defined channel. We will plot a bearish channel by connecting the most prominent swing highs within the downtrend, and then run a parallel of that line off of the lower swing points. You can see the created bearish channel that is plotted with the two downward pointing trendlines.
With these conditions met, we should go back to the shooting star formation for further analysis. We want the shooting star pattern to have either touched or penetrated the upper line of the bearish channel. If you look closely at the shooting star formation once again, you will notice that the upper wick did in fact penetrate the upper line of the bearish channel plotted. And with that, we have confirmation of shooting star pullback set up.
Our entry calls for entering a short position immediately following the close of the confirmed shooting star pattern. You can see the entry signal noted on the price chart. From here, we would immediately place a stop loss order just above the high of the shooting star formation. Once we have done that, we will need to monitor the trade carefully and watch for a touch of the lower line of the bearish channel. This event would serve as the exit signal. You can see when the exit signal was triggered on this trade by referring to the magnified area at the lower right of the price chart.
Summary
As we have seen, the shooting star pattern is an important candlestick formation that can help us pinpoint the end of a major uptrend or a minor pullback within a downtrend. It’s important to not only study the anatomy of the shooting star pattern, but also to realize the conditions under which it is most effective.
Unfortunately, some traders do not take that extra step in gauging the market context around a shooting star formation. This can lead to a higher rate of false signals, and lower overall profitability when using the pattern. Those that do take the time to understand the market environment in which the shooting star pattern should be traded, will be better rewarded for their efforts.