The GBPUSD currency pair is one of the most popular and widely traded forex trading instruments. Due to its deep liquidity and high volatility characteristics, it offers opportunities for both daytrading and swing trading. In this lesson, we will provide an overview of the GBPUSD pair, and pass on some valuable tidbits for trading it successfully.
GBPUSD Currency Overview
GBP USD is a major currency pair that represents the British pound to US Dollar exchange rate. It is among the most widely traded and liquid forex pairs in the world because it represents the currencies of two of the largest economies in the world, namely Great Britain and the United States. The US dollar is the quoted currency while the British pound is the base currency. In short what the GBPUSD exchange rate tells us is how many US dollars are required to purchase one British pound.
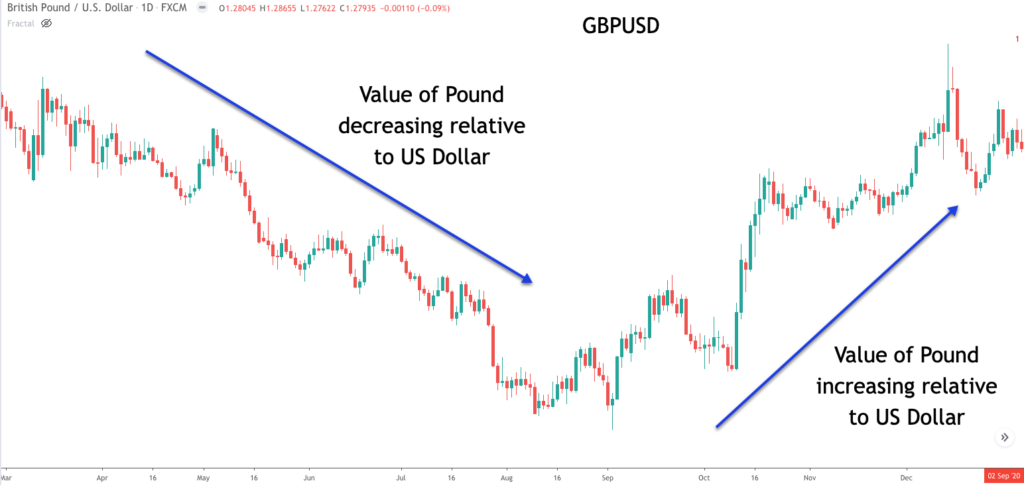
So for example, if GBP USD is currently trading at 1.4000, what that translates to is every 1.4 US dollars would be equivalent to one British pound. As such, when we’re looking at a price chart of the GBP USD pair, and the price action is moving higher, that upward movement means that the value of the British pound is gaining relative to the US dollar. And similarly, when the price action is moving lower, that downward movement means that the value of the British pound is losing value to the US dollar. Or said another way, that the US dollar is gaining relative to the British pound. Also as a point of interest, many forex traders refer to the Pound Dollar pair, as Cable. Take a look at the forex GBPUSD chart below to get a sense of what the price movements mean:
The GBPUSD pair is highly impacted by certain economic reports such as GDP, employment reports, inflation, and more. However, central bank activity is one of the biggest drivers of volatility and price direction in the GBP USD currency pair. And this relates to both the central bank decisions coming from the Bank of England as well as the FOMC, which is the branch of the Fed tasked with making interest rate decisions. From the historical perspective, the GBP USD pair has traded since the early 1970s. This was a time when both the United Kingdom and the United States shifted to free-floating exchange rates. Before that, the two currencies were pegged to the gold standard.
Best Time To Trade GBPUSD Forex Pair
GBP USD is an excellent currency pair for both day trading and swing trading. For one, the average daily range for cable is large enough to take advantage of short-term price trends. The average daily range, or ADR, measures the daily price volatility of the currency pair.
Additionally, aside from major price spikes resulting from unexpected news events, or central bank rate statements, the GBP USD currency pair is very stable and a safe currency to trade. It is well suited for both technical and fundamental traders. Technical analysts will find plenty of tradable opportunities using chart analysis, indicator analysis, or any other technical based approach. Fundamental analysts will also benefit from participating in the GBP USD market. There are plenty of economic reports and scheduled news announcements that can be studied and analyzed for this particular pair.
If you are a shorter-term trader looking to take advantage of intraday price swings in the GBP USD, then you must be cognizant of those times within the trading session, that offer the best opportunities. You need to make sure that the potential profits that you can make from intraday moves will outweigh the associated transaction costs. As such, you want to focus on times when liquidity is the highest, so that you can benefit from a tight bid ask spread, and reduced slippage costs. Aside from the obvious benefits mentioned, GPB USD trading during highly liquid periods of the day is also beneficial because it can help you catch the most explosive’s price swings for the session.
Now let’s get more into the specifics of the best times for daytrading the GBP USD forex pair. The ideal time for trading the GBP USD currency pair is when both the London session and New York session overlap. This is when there is the most amount of volume seen in the currency pair. The bid ask spreads will be the tightest during this period, and you will typically experience only minimal slippage on your trades.
The actual time window when the London session and New York session overlap is between 8 AM ET and 12 PM ET. The second best time for executing trades in the GBP USD currency pair is during the opening hour of the London session, which is 3 AM ET to 4 AM ET time window. This is when most of the European markets are trading, and as such, there is a good amount of volume in the pair. Often we’ll see a breakout during this time window that will persist through the New York session to the close of the trading day.
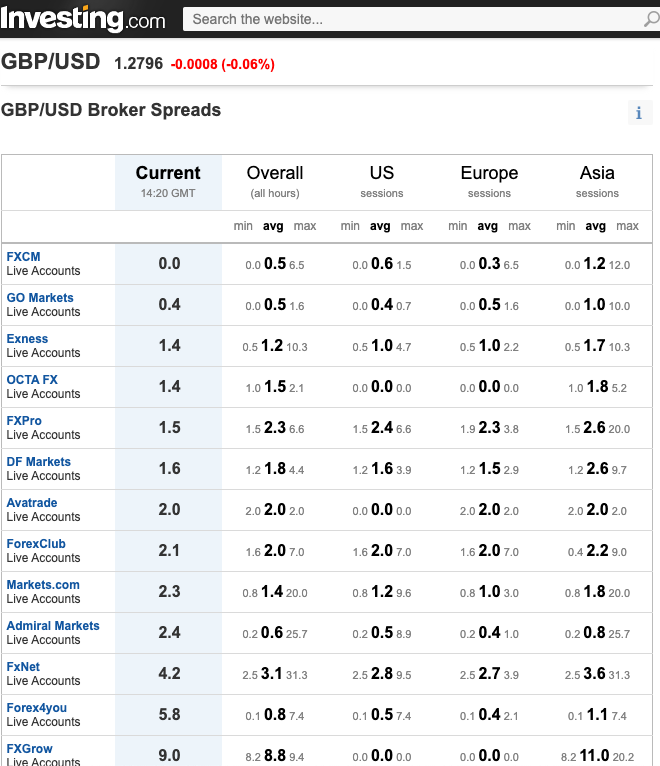
Below you will find a snapshot of various broker spreads for the GBPUSD pair based on market sessions. Note the widening spread seen in the Asian session.
Key Reports To Monitor For GBPUSD
So what are some of the most important economic reports to watch for when trading the GBP USD currency pair? There are quite a number of economic data releases that can affect the volatility in the GBP USD pair, however there are five in particular that forex traders should be particularly aware of.
The first is the GDP report for both the United Kingdom and the United States. GDP is a quarterly report that measures the level of economic activity in a specific country over a specified period of time. Typically the preliminary GDP estimates affect the price of the currency pair the most, since it is the earliest to be released and provides a trader an early assessment of the country’s economic health.
The second type of announcement that forex Cable traders need to be cognizant of is those that are related to monetary policy. Particularly, statements and interest rate decisions that are put out by the Bank of England BOE and the US Federal Reserve. The monetary policy committee or MPC are tasked with these important rate related decisions in England. In the United States, the FOMC branch of the Federal Reserve is responsible such related policies. These announcements are among the highest volatility market events as it relates to the GBP USD currency pair.
Another important economic data point to monitor is the trade balance figures. Generally, the trade balance will reveal how much money is flowing into and outside the country in terms of export and import business activity. As a general rule, an uptick in trade surplus is considered as a sign of a healthy economy, whereas a trade deficit is considered to be a less than ideal economic situation. What you want to pay particular attention to are the quarterly trade balance figures which provide detailed import export data.
GBP USD traders need to keep a close eye on both the US and UK unemployment rate figures. As with extreme volatility increases often seen following the BOE or FED rate decision, the employment data can also be a highly impactful economic report. Essentially the unemployment rate measures the percentage of the aggregate workforce that is out of work but currently seeking employment.
Obviously the higher the unemployment rate, the more detrimental it is for the economy as a whole. As such, any sudden spikes up or down in the unemployment figures reported by the BLS ,Bureau of Labor Statistics in the United States, or the Office of National Statistics in the United Kingdom from month-to-month can cause wild swings in the GDP USD currency pair.
Although they are both important, the most widely watched employment figures are those of the NFP report, the Nonfarm Payrolls report for the United States. Any significant and unexpected deviation from analyst expectations can drive prices up or down in the GBP USD pair in a blink of an eye. This elevated volatility can create both increased opportunity and risk in the Forex pair.
Last but not last least, traders should pay close attention to inflation figures. This includes both the CPI, which is the consumer price index, and the PPI, which is the producer price index. The CPI measures inflation for a basket of commodities, and is considered a gauge of inflation at the consumer level. The PPI measures inflation at the manufacturer or wholesale price level. Both of these inflation metrics provide important clues into potential long-term price trends. However, the PPI, producer price index, is considered as a leading indicator and can therefore be more useful for predicting future price trends.
GBPUSD Correlations
As a Forex trader, you must be aware of existing correlations between different currency pairs. This can be done through the analysis of a currency correlation table. Currency correlation analysis is important in reducing risk and overexposure to any specific market. GBPUSD currency pair can often move in tandem with other major currencies particularly the EURUSD pair, and it can often move with an inverse relationship to other major currencies such as USDCHF or USDCAD.
These relationships can exist at various time frames including the four hour, eight hour or daily timeframe. Additionally these correlations are dynamic and can change over time. As such, it’s important to monitor the different positive and negative GBP USD correlations with other currency pairs that are in your watchlist. A positive correlation refers to two currency pairs that are related in their directional movement. A negative correlation refers to two currency pairs that are inversely related in their directional movement.
Correlations are measured on a scale from 1 to -1. A positive reading of .70 to 1.0 indicates a strong correlation. A positive reading of .50 to .69 indicates a moderate correlation, and a positive reading of 0 to .49 indicates a weak correlation. The same rules apply for an inverse correlation which is indicated with a negative symbol. More specifically, a negative reading of .70 to 1.0 indicates a strong inverse correlation, A negative reading of .50 to .69 indicates a moderate inverse correlation, and a negative reading of 0 to .49 indicates a weak negative correlation. It’s also important to note that sometimes correlations will be represented on a scale of 100 to -100 depending on the data provider that you are using. In any case, the implications are the same.
Let’s take a look at an example of a correlation table and analyze a few GBP USD correlations.
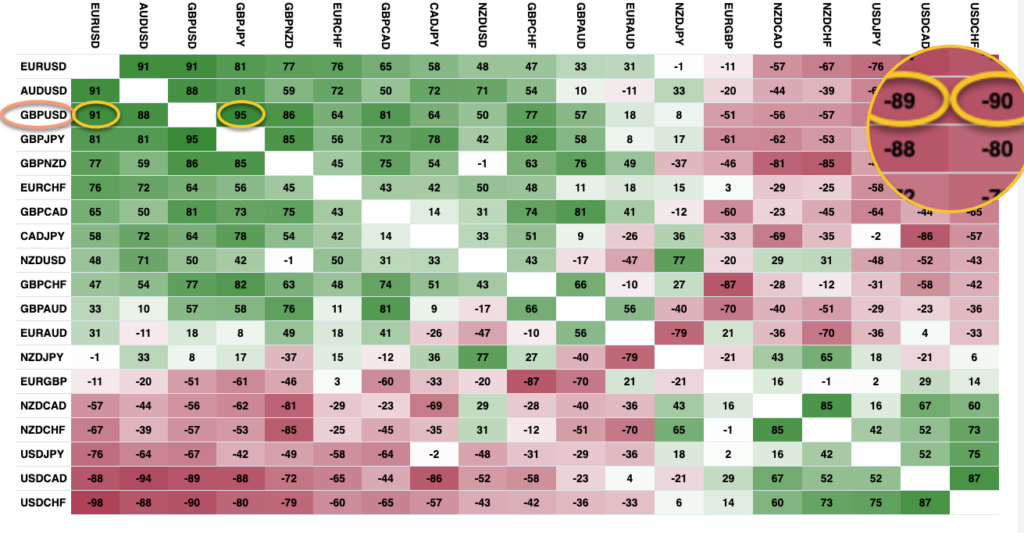
This correlation table was taken from the Mataf.net website. On the table above you can see the correlation matrix of the most popular forex currency trading pairs based on the daily timeframe. Let’s now perform a GBPUSD analysis, looking for high correlations. Notice here the GBP USD currency pair is located in the third row. If you scroll over to the right side, you can see the numerical correlation values of various currency pairs to the GBP USD.
Can you find a few of the more significant correlations that exist based on this data? Well, the first thing that jumps out is the positive 91 correlation that exists with the EUR USD currency pair. Also notice the positive 95 correlation that exists with the GBP JPY pair. What about any inverse correlations? Can you spot any important inverse relationships with the GBP USD? Well, if you look at the far right of the chart you will note that the USD CAD has a reading of -89, and USDCHF has a reading of -90. We have magnified that area for easy viewing. So this tells us that these two pairs have a strong inverse correlation with the GBP USD pair. Remember that this means that the price movements are correlated in the opposite direction.
GBP USD Trading Strategy
Now that we have discussed the basics foundations of the GBP USD currency pair, let’s discuss an intraday strategy for trading Cable. The strategy that I am referring to is known as the Big Ben strategy. This is essentially an opening range breakout strategy for the GBP USD currency pair. The logic behind the strategy is rooted in a shifting volume footprint that seeks to capture an early price move following the Asian session. Specifically, the volume of Pound Dollar trading dries up substantially after the close of the New York session and subsequently into the Asian session.
As a result, most of the major institutional traders and dealers trading the Cable will be off-line until the start of the European session. This often creates range bound market action in the GBP USD currency pair during this overnight session. And so, when the pair begins to pick up volume in the early European session, an opportunity exists for an opening range breakout trade. As Interbank dealers create a range on either side of the market during the opening, a potential breakout from this range will often produce a trend leg early in the trading session. There are a few different variations of the Big Ben trading strategy applied to the GBP USD currency pair.
Below I have detailed a strategy for how to trade GBPUSD using a variation of the Big Ben set up.
Rules for a long entry using the Big Ben set up with five-minute candles:
- Plot the high and low price range between the Frankfurt open and the London open. This is defined as the opening range.
- The price action during this period should appear rangebound
- Enter on a breakout and close above the 38% Expansion level of the range
- Stop loss to be placed at the midpoint of the opening range.
- Take profit will be equal to two times the length of the opening range measured from the breakout point.
Rules for a short entry using the Big Ben set up with five-minute candles.
- Plot the high and low price range between the Frankfurt open the London open. This is defined as the opening range.
- The price action during this period should appear rangebound
- Enter on a breakout and close below the 38% Expansion level of the range
- Stop loss to be placed at the midpoint of the opening range.
- Take profit will be equal to two times the length of the opening range measured from the breakout point.
GBPUSD Trade Strategy Example
Now that we have outlined the rules for our modified Big Bend trading strategy, let’s now go to a price chart and illustrates the set up. The price chart below is a five minute chart displaying the British Pound US dollar currency pair.
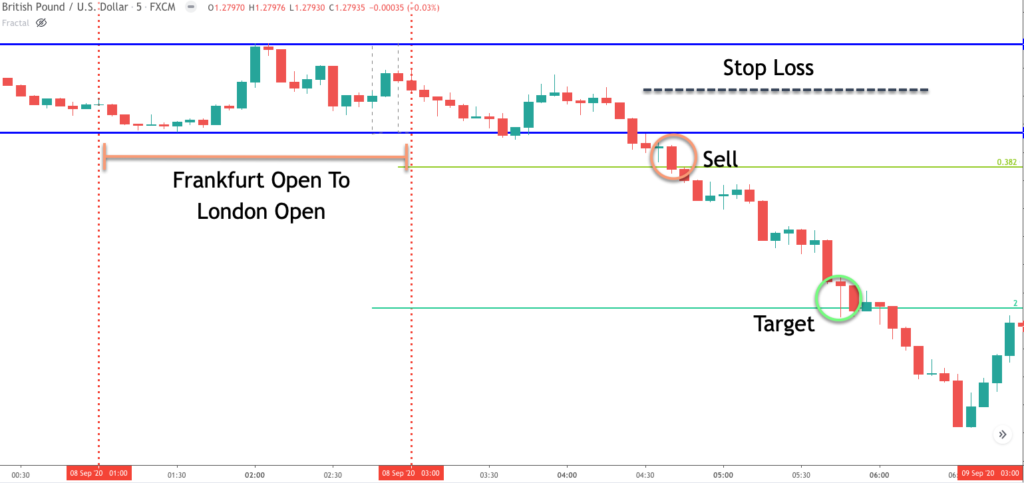
Take note of the two vertical lines plotted in red. The left dotted line represents the Frankfurt open, and the right dotted line represents the London open. This is the time period we will be looking at for a potential breakout trade opportunity. We have plotted the swing high and swing low during this opening range using the blue horizontal lines.
The upper blue horizontal line represents the swing high or resistance within the range, while the lower blue horizontal line represents the swing low or support within the range. If you look at the price action closely within this created boxed area, you will note that the market was trading in a fairly range bound manner. As such, the conditions for a potential Pound Dollar trade have been confirmed.
At this point, we would plot a 38% expansion of the range on both sides of the market. For the sake of clarity, we have only plotted the lower end of this measurement here, as can be seen by the olive colored line below the lower end of the opening range. Once the price breaks below and closes below this level, it would serve as our sell entry signal.
Notice how after our opening range, prices continue to move sideways for the next 90 minutes or so. But shortly thereafter, selling pressure entered the market pushing prices lower, and eventually, we spotted a candle close below the lower 38% expansion level. The confirmed breakout to the downside is shown within the orange circled area.
This event would have triggered a sell entry order at the market. The stop loss would be placed at the midpoint of the opening range. The dashed black line above the sell entry illustrates where the stoploss placement should be set. Now that are trade is protected in case of an adverse price move, we need to shift our focus to the take profit exit point.
As per the rules for this strategy, the target will be set at a distance that is equal to two times the length of the opening range measured from the breakout point. If you refer to the green horizontal line towards the lower portion of the price chart, you will see that take profit level marked accordingly. Price eventually reached that level and ultimately continued even lower before rebounding.
Summary
>
We have presented some GBPUSD trading tips that should prove helpful to you. Along with the EURUSD currency pair, the GBPUSD is one of the most liquid forex instruments the trade. It offers a very tight bid ask spread, and you will typically experience minimal slippage, when you execute your trades at the most opportune times.
The best times to trade the Cable currency pair is during the early European session, and the US and London overlapping session. Although this article, we are focused on an intraday strategy for trading GBP USD, there are a host of swing trading strategies that can be employed as well on this pair.