Fibonacci-based approaches are quite popular trading methods used by both novice and seasoned traders. Trading harmonic patterns is a subset of a Fibonacci trading methodology. One of the higher probability patterns that harmonic traders use is the Bat pattern setup. It offers a distinct edge, and a very favorable risk to reward profile when traded correctly. We’ll discuss the specific rules for identifying the bat pattern and some ideas for trading it in a profitable manner. So, let’s get started.
What Is The Bat Pattern?
The bat pattern is a harmonic trading pattern that was developed by Scott Carney. He wrote about the pattern in his series of books, entitled Harmonic Trading.
It is one of several different harmonic trading patterns that provides a trader a rule-based methodology, and combines pattern recognition with Fibonacci analysis. A few other popular harmonic patterns in forex include the Gartley, Butterfly, and Crab patterns. Of these the Gartley pattern is the most similar to the Bat pattern in terms of the overall pattern structure. We will be comparing and contrasting the Bat pattern and the Gartley in the later section.
The Bat pattern is a five point chart pattern that can often foretell a reversal in the market. It relies heavily on specific Fibonacci ratios to occur at various points within the structure. These are fairly strict measurements that need to be met in order for the pattern to be labeled accordingly as a bat pattern.
We’ll be defining each of these important relationships shortly, but for now, it’s important to understand that the Bat pattern has a deep retracement against the prior price move, and often resembles the shape of the letter M, in the case of a Bullish Bat, and the shape of the letter W in the case of a Bearish Bat formation.
Rules For Identifying The Bat Pattern
As mentioned earlier, the Bat pattern is a five-point pattern with very specific Fibonacci relationships. Below you will find an example illustrating the structure of the bat pattern:
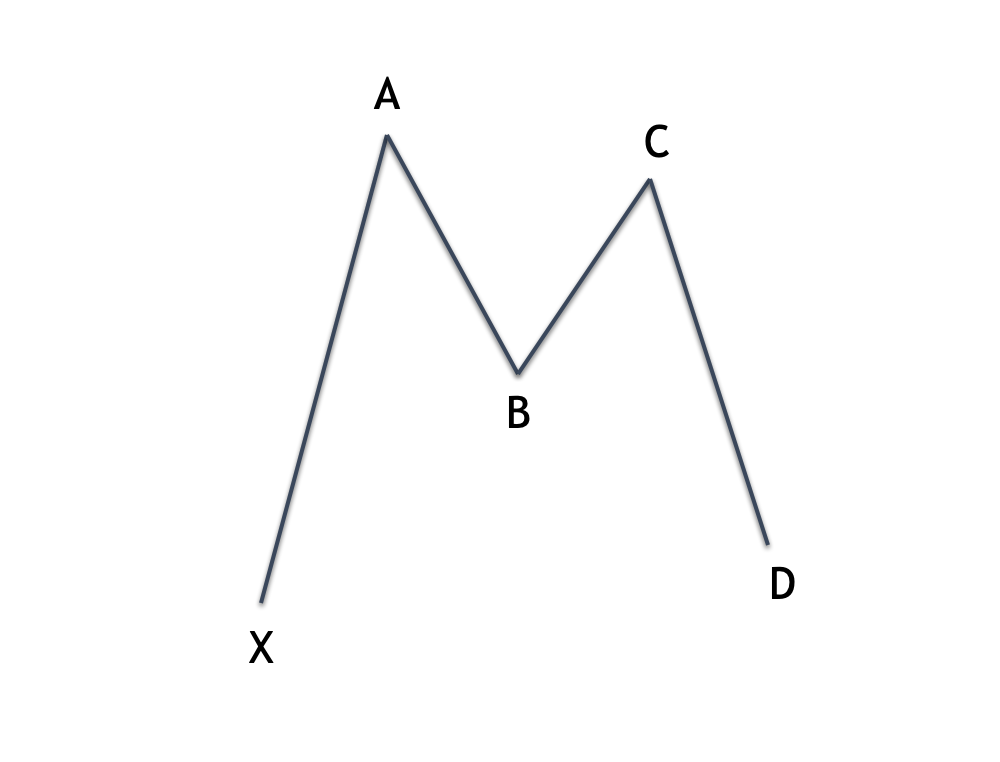
So, here’s how we go about drawing the harmonic bat pattern. First, notice here the five points that comprise the bat pattern. These five points make up the separate legs within the overall structure. These legs are labeled as per follows – the XA leg, the AB leg, the BC leg, and the CD leg.
So anytime that we are referring to a particular swing within the Bat pattern, we would identify it as one of these specified legs.
Let’s now take a little closer look at each of these four legs within the bat structure:
XA leg – the XA leg is the initial move within the structure. It is often an impulsive leg with a relatively sharp price movement. This leg is the longest leg within the overall structure and is the kickoff of the pattern.
AB leg – the AB leg is the initial retracement that occurs against the XA leg. This retracement is often the Fibonacci retracement of 38%, or 50% of the XA leg.
BC leg – the BC leg moves in the direction of the XA leg; however it must be contained within the extreme of point A. The BC leg usually retraces the prior AB leg within the 38 to 88% range.
CD leg – the CD leg is the final leg within the Bat structure, and the most significant part of the pattern in terms of the Fibonacci measurements. The CD leg should retrace the XA leg by 88%. In addition, but less important, is for point D to represent a 161% or 261% extension of the BC leg.
These are the primary rules for recognizing the bat pattern on the chart. When you’re starting out learning how to identify and label the bat pattern, it helps to perform these measurements manually with the different Fibonacci tools so that you can become intimately familiar with the rules behind them.
But eventually, you will want to opt for a charting platform that offers harmonic pattern recognition technology. At the very least you can opt for a harmonic trading indicator. This can help you label the Bat pattern in a much quicker and efficient manner.
Bullish Bat Pattern
The Bat pattern can be a bullish formation, or a bearish formation. We will start off by taking a closer look at the bullish bat pattern.
Below you will find an illustration of the bat pattern and its associated Fibonacci ratios:
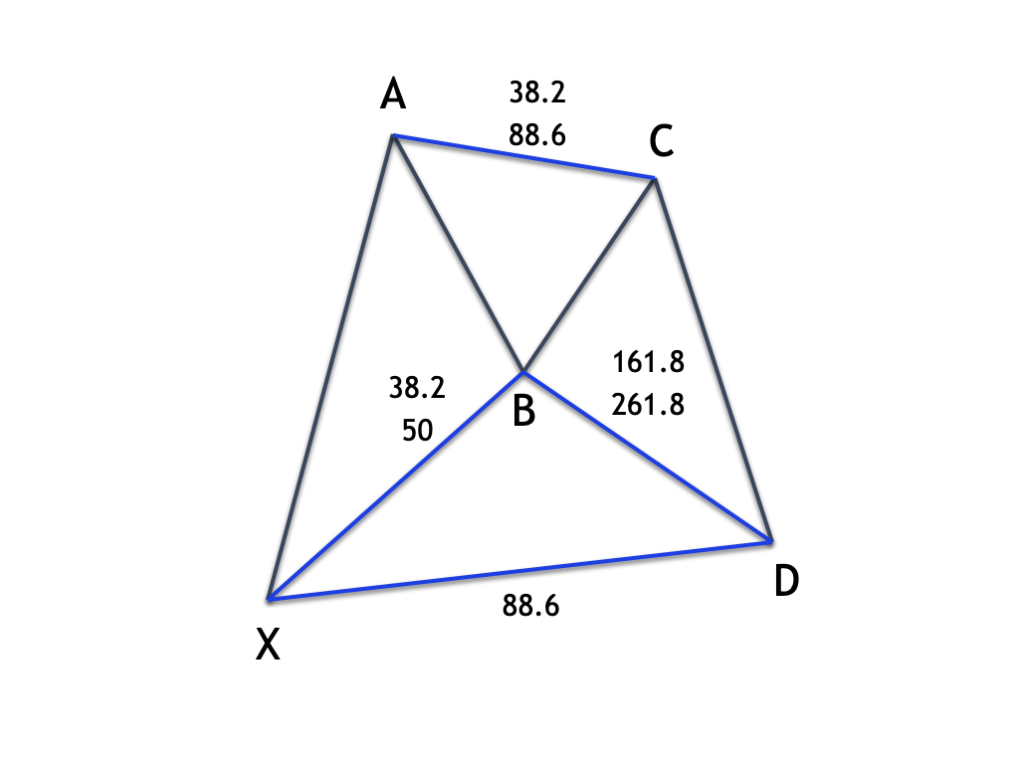
Notice on the above illustration of the bullish bat pattern, the initial XA leg is bullish, and kicks off the overall pattern. Next we can expect the AB leg to retrace the XA leg by either the 38 or 50%. The termination of this particular retracement is referred to as the B point. And this Fibonacci ratio seen at the B point is very important in the overall makeup of the Bat structure.
After the B point is established, we will see prices will move higher in the BC leg. The BC leg will typically retrace the AB leg within the range of 38 to 88% range. Finally at the termination of point C, the price action will begin to move lower within the CD leg. The D point of the CD leg represents the termination of the Bat pattern. The expectation is for price to terminate at or near the 88% retracement level, completing the harmonic bat formation, and putting bullish pressure on future price action.
Bearish Bat Pattern
The bearish variation has the opposite implication as the bullish Bat pattern. Let’s now illustrate how the bearish Bat pattern appears, and the price movements within each of its respective legs.
Here you can see the bearish variation and the associated fib ratios for the Bat Pattern:
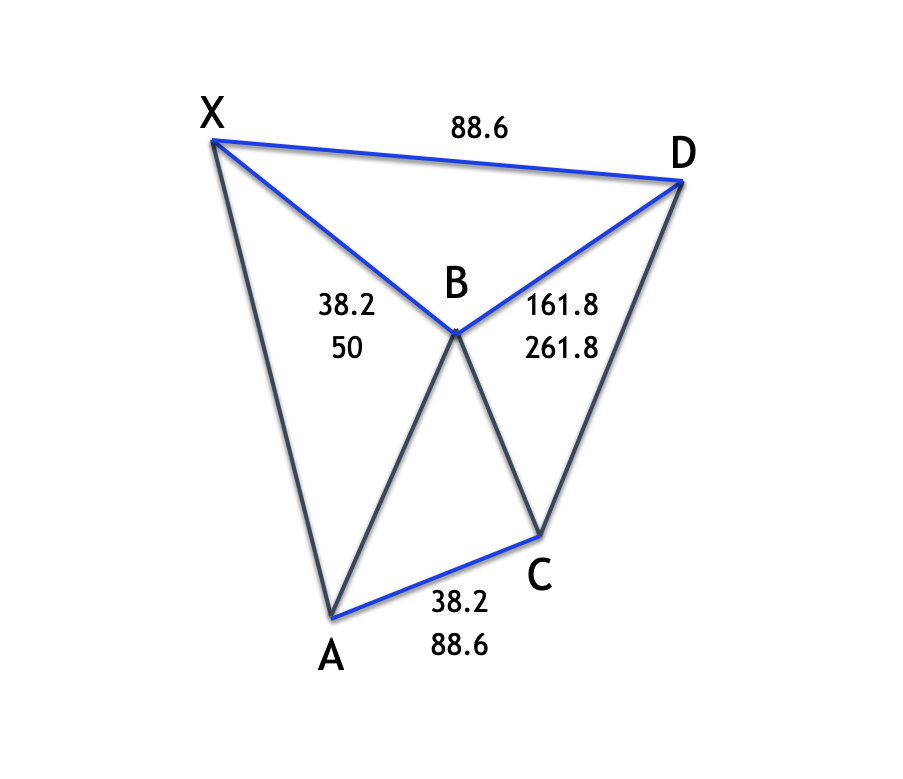
In a bearish Bat pattern, the initial XA leg will be bearish. The following leg will be the AB leg and will retrace the XA leg upwards by the Fibonacci ratio of 38% or 50%. This again marks the B point of the bearish Bat pattern. Again, the B point holds a special significance within the bat structure, and, it needs to terminate at one of these two specific levels in order to correctly label the structure as a bat.
As we will see later, a deeper retracement at the B point can invalidate this pattern, and instead, can lead to the classification of the pattern as a Gartley. Moving on, the BC leg will ensue and will retrace its prior AB leg by 38 to 88%. Finally, the last leg within the structure, the CD leg, will move higher and terminate at or near the 88% retracement of the initial XA leg. Once this happens, it confirms the bearish Bat structure, signaling an imminent reversal as prices should begin the trade lower.
Bat Pattern vs. Gartley Pattern
Some traders who utilize harmonic patterns in their trading get confused between the Bat pattern structure and the Gartley pattern structure. So, let’s take a moment to clarify the primary differences between these two harmonic patterns, so as to ensure that we are classifying and ultimately trading these patterns correctly.
Before we do that, it helps to understand the difference between an internal pattern and an external pattern as it relates to Fibonacci based harmonic structures. An internal pattern is one wherein the final point within the overall structure is contained within the extreme of the X leg, which is the first point within a harmonic structure. An external pattern is one wherein the final point within the overall structure extends beyond the extreme of the X leg.
Both Bat and the Gartley patterns are considered to be internal patterns, because both have their D termination point, within the hundred percent retracement of the XA leg. On the contrary, other harmonic patterns such as Butterfly patterns and Crab patterns are considered to be external patterns, because both have their D termination point outside the 100% retracement of the XA leg. This is considered an extension of the XA leg.
Now going back to the primary difference between the Bat and Gartley patterns, we now know that both are considered internal patterns and as such the D point will terminate within the XA leg. The two primary characteristics that differentiates a Bat formation from the Gartley formation is the Fibonacci ratio seen at point B, and the Fibonacci ratio seen at point D. More specifically, a Bat pattern predominantly has a B point terminating at either the fib retracement of 38% or 50% of the XA leg. On the contrary, the Gartley pattern predominantly has a B point terminating at the fib retracement of 61% of the XA leg. This is the first important difference.
The second distinction between the Bat and Gartley can be seen at the termination of the D leg. That is to say that the Bat will have a deeper retracement then the Gartley. The Bat patten will be an 88% retracement of the XA leg, while the Gartley pattern will be a 78% retracement of the XA leg. It’s also worth noting that within the Gartley formation, the AB leg will often be of equal length to the CD. This occurrence is often referred to as AB=CD.
Trading the Bullish Bat Pattern
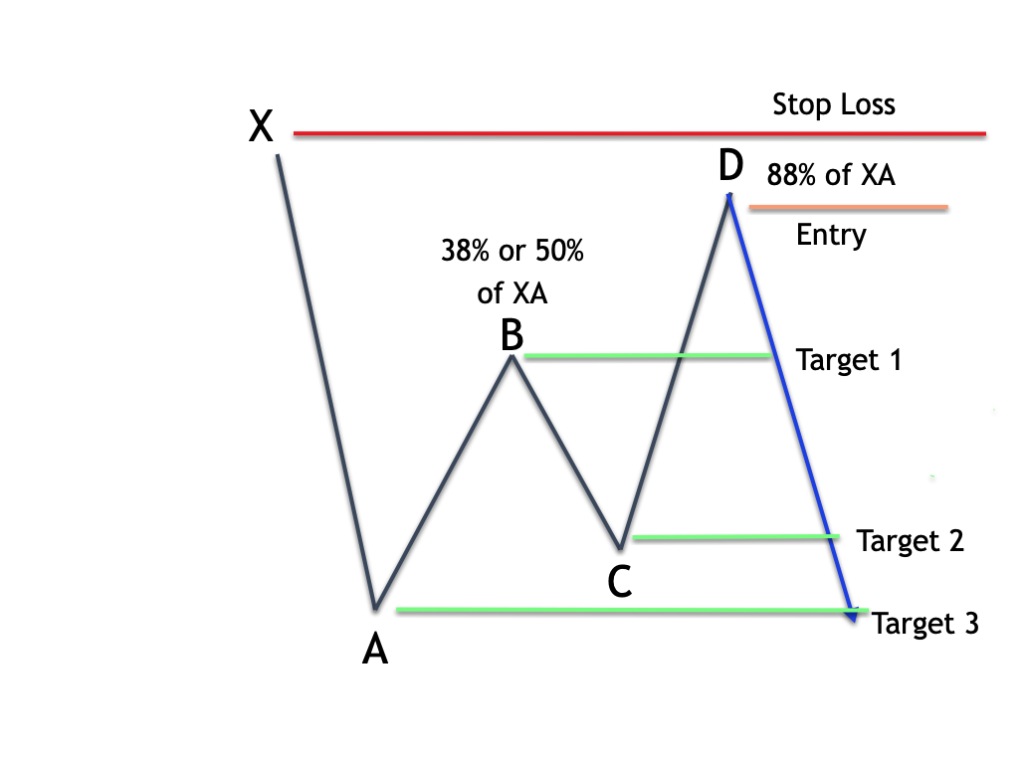
Now that we have laid out the foundations of the harmonic Bat pattern, let’s move on and discuss some trading strategies that we can implement when we identify a Bat pattern. We will start by taking a look at trading the bullish Bat pattern. Below you will find an illustration of the bullish Bat pattern. Here we have added a few notations including the Entry point, Stop Loss point, and Targets 1,2 and 3:
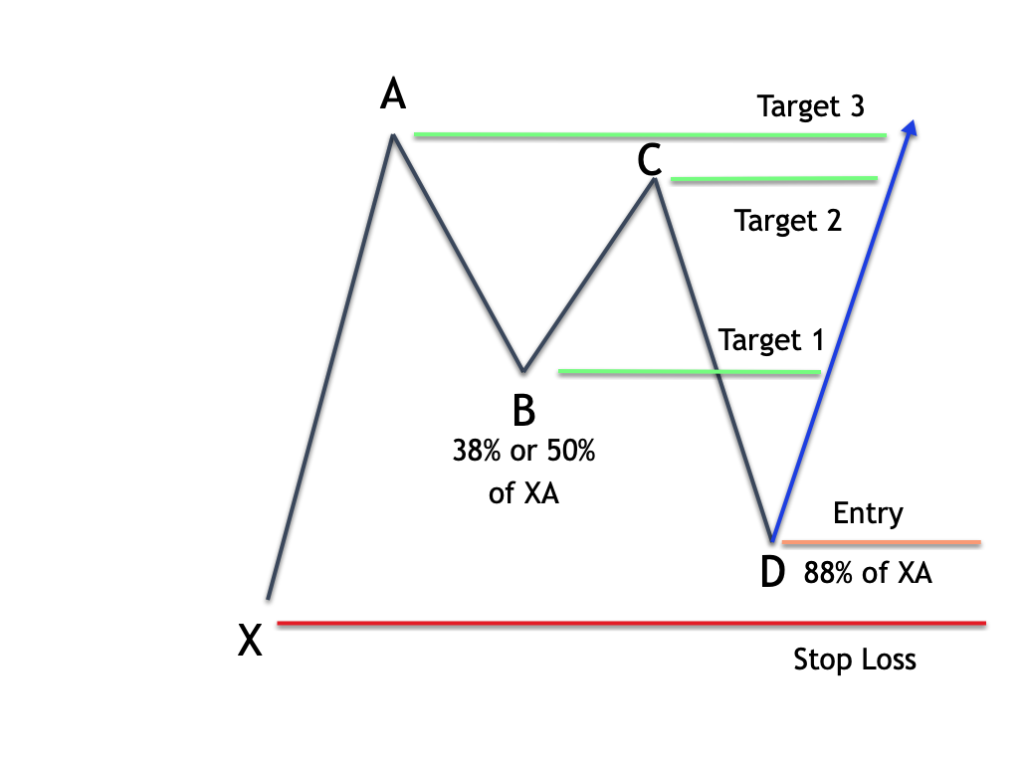
So the first thing that we need to do, is to apply our various Fibonacci tools to confirm whether or not a potential Bat pattern can be verified on the price chart. Keep in mind that the two most important levels that we want to look at and confirm are points B and D. We want to ensure that Point B is either a 38 or 50% retracement of the XA leg and that point D is an 88% retracement of the XA leg. When the Fibonacci ratios have been confirmed, then we will need to have a plan to trade the bat pattern. Here is my preferred Bat pattern trading strategy:
Rules for trading the bullish Bat pattern:
- Enter with a limit order to buy at the 88% retracement of the XA leg.
- Stop loss to be placed just below the swing low at point X
- Exit using a scale out approach, with three target points. Target one will be set at the swing low of point B, Target two will be set at the swing high of point C, and Target three will be set at the swing high of point A.
We will often realize a solid risk reward ratio using these entry and exit rules. Additionally, we should see a relatively high percentage of winning trades since we are scaling out at important resistance levels along the way.
Bullish Bat Pattern Trading Strategy
Let’s now take a look at a practical example of trading the Bat pattern in forex, starting with the bullish bat setup. The chart below shows the price action of the Euro-US Dollar pair on the four hour timeframe.
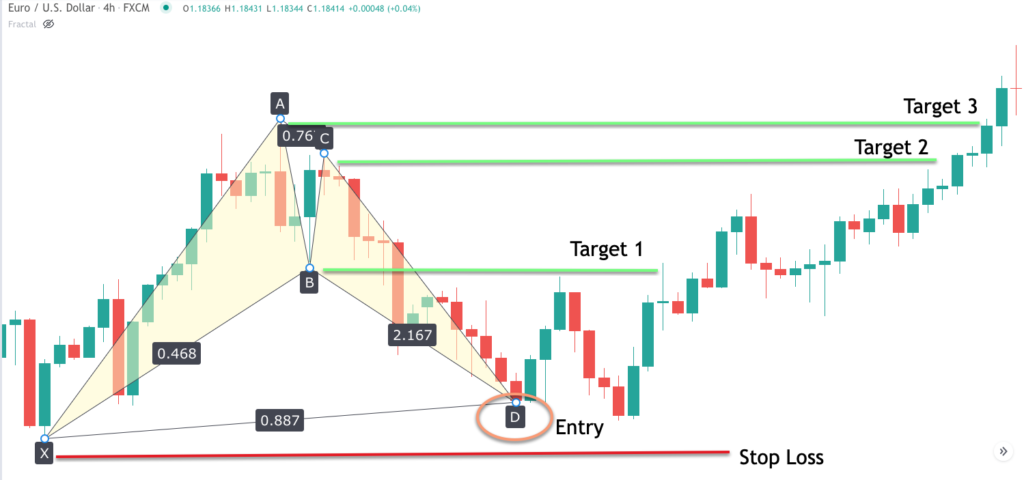
Firstly we have outlined the bullish Bat structure using the points X, A, B, C, and D. Notice here that the AB leg retraces the XA leg by just shy of 50%. The actual retracement seen here at point B is 47%, which is within a narrow range of our preferred 50% level that we like to see at point B.
Next, notice the price action during the CD leg. It’s a bearish leg and we can see a swift reversal that occurred upon reaching the 88% retracement of the XA leg. As price approached the 88% retracement level, we would have prepared to go long recognizing this bullish Bat pattern in progress. The circled area shows where the 88% retracement occurs at point D.
That would be the Bat pattern signal for entering a long trade. We would’ve placed a limit order to buy at this level in expectation of higher prices.
The stop loss would be placed just below the swing low of point X. You can see that level shown by the red line at the bottom of the chart, which is denoted, Stoploss. Our exit strategy calls for scaling out of the position in one third intervals. Our first target would be the swing low of point B. You can see that the first attempt to hit that target fell a bit short, but after a minor move lower, the second attempt was successful in reaching Target one.
Target two would have been set at the swing high of point C. You can see that the price action continues to move higher and eventually this target was hit, allowing us to close out the second third of the position. The final third of our position would be held for a short period longer, as price action continued higher to reach the swing high of point A, which would’ve served as our final exit trigger.
Trading The Bearish Bat Pattern
Let’s now shift our attention to the bearish Bat version. The trading rules would be the same as described above for the bullish Bat pattern, but in the reverse direction. For the purpose of completeness, we will describe the rules here again in the context of the bearish Bat formation.
Below you can see an illustration that details the bearish Bat pattern, along with some additional notations referring to the trade management process.
We will use our pattern recognition skills, or a harmonic pattern scanner, to locate a potential bearish bat formation on the price chart. Once we have found a structure that qualifies, will need to have a plan to execute a short position. Remember that within the bearish bat pattern as well, we need to play close attention to the termination points at point B and point D. And to reiterate, point B should terminate at either the 38% or 50% Fibonacci retracement as it relates to the XA leg. And D point should end at the 88% retracement level of the XA leg.
Rules For Trading The Bearish Bat Pattern:
- Enter with a limit order to sell at the 88% retracement of the XA leg.
- Stop loss to be placed just above the swing high at point X
- Use a multi-target exit strategy. Target one should be set at the swing high of point B, Target two should be set at the swing low of point C, and finally the last target, Target three, should be set at the swing low of point A.
Bearish Bat Pattern Trading Strategy
Let’s now move on and see the strategy in action for a bearish Bat pattern. If you refer to the chart below you will find the British Pound to Canadian Dollar pair with a bearish Bat pattern highlighted.
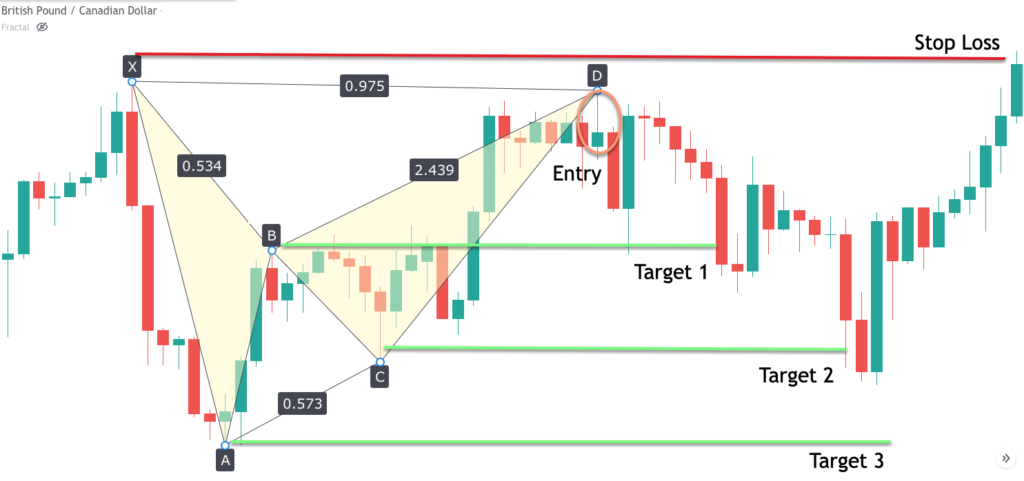
The XA leg kicks off the structure, and you can see that the price action within this leg is quite impulsive with strong bearish momentum within the overall price movement. Then as prices move higher in the AB leg, we can see that the B point terminated near the 53% retracement of the XA move. Though this is slightly higher than our preferred 50% level, it is nevertheless within an acceptable range for the classification of the bat pattern.
Then after a minor move lower in the BC leg, the final CD leg brought prices higher taking out the swing B high on its way up. At this point we should have been put on notice that a solid bearish Bat trading opportunity is likely developing.
We would have placed a limit order to sell at the 88% retracement of the XA leg, as price was moving higher in the CD leg. You can see the bar wherein our entry would’ve occurred in the circled area near the top of the chart. Also notice that prices continue to move higher even after our sell order would have executed, and the D point terminated all the way to the 97% retracement of the XA leg, forming a double top.
Since our stop loss would’ve been placed beyond the X point high, we would not have been in any major jeopardy of it being hit in this particular instance. It’s also worth noting that the terminal price bar within the CD leg is clearly a pin bar formation. This further bolsters our outlook for a bearish reversal.
As prices move lower, we can see that our first target was hit by the long bearish candlestick that broke below the swing B high. Afterwards, the price retraced higher a bit, before eventually rolling over to the downside again. As the selling momentum increased, our second target was triggered at the swing low of the C point. This was, however, the best we could hope for on this particular trade because shortly after target two was hit, the price action reverses swiftly and begins to trade higher. Soon afterwards, our stop loss at the extreme of the X point was triggered. As such, or entire position was now closed out, but we would have ended up with an overall profit on the trade.
Summary
The bearish Bat pattern is one of four major harmonic trading patterns. The other three include the Gartley pattern, Butterfly pattern, and Crab pattern. The Bat pattern offers the best reward to risk profile of all these other harmonic structures. This is due to the deep retracement that is required to validate the bat formation. Because of this deep retracement, we able to lean heavily on the major swing point nearby at point X, for the placement of our stoploss.