Harmonic patterns are becoming increasing popular in Forex trading. Harmonic patterns can be classified as Internal Patterns or External Patterns. Internal patterns include structures such as the Gartley and Bat. External patterns include structures such as the Butterfly and Crab.
In today’s lesson, we will discuss the Butterfly extension pattern. After reading this material, you will be able to recognize the Butterfly setup and know how to trade it profitably.
What is the Forex Butterfly Pattern?
The Butterfly is a reversal chart pattern that falls within the category of Harmonic patterns. The pattern represents price consolidation and is often seen at the end of an extended price move.
Traders can use the Forex Butterfly pattern to pinpoint the end of a trending move and positon for the beginning of a correction or new trend phase. In Elliott wave terms, you will often see this pattern during the last wave (Wave 5) of the impulse sequence.
Structure of the Butterfly Formation
The Butterfly pattern has four price swings, and its appearance on the chart resembles the letter “M” (in in downtrends ) and “W” (in uptrends). During its development, it is can sometimes be mistaken for a Double Top or Double Bottom pattern.
The difference though is that the Butterfly does not necessarily appear after a trend, though it often does. Contrary to this, you do want to see the Double Top or Bottom appear only after a sustain move for best results.
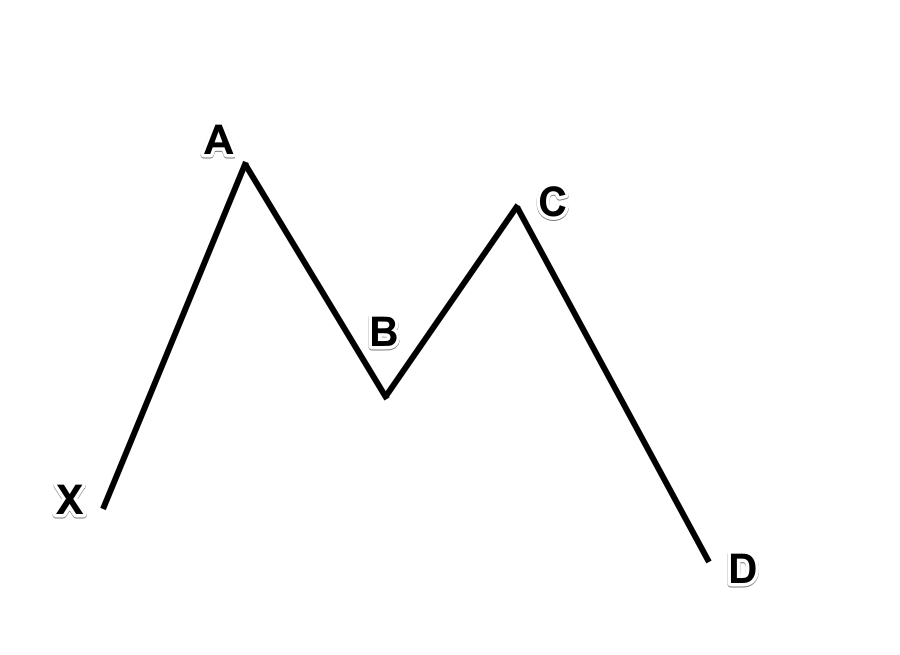
Notice that the beginning of the pattern is marked with “X.” Following that, we identify the four price swings of the formation as: XA, AB, BC, and CD.
Fibonacci and the Butterfly Pattern
There are specific Fibonacci levels that are critical for the proper identification of the Butterfly pattern. As you may know, Fibonacci relationships are a key component to harmonic pattern trading, and so it is with the Butterfly.
In order to confidently identify a real Butterfly chart pattern, you will need to confirm that the price swings of the formation conform to specific Fibonacci levels.
Let’s now take a closer look at what these various Fib relationships are within the Butterfly figure:
XA: This is the initial move that forms that pattern. No specific rules are required for this move.
AB: The B point is the most critical level for the Butterfly pattern and it should retrace 78.6% of XA leg.
BC: The BC move should take either the 38.2% or 88.6% retracement of the AB move.
CD: If BC is 38.2% of AB, then CD is likely to reach the 161.8% extension of BC. On the other hand, if BC is 88.6% of AB, then CD is likely to reach the 261.8% extension of BC.
AD: Then, the general AD move that consists of AB, BC, and CD should be either 127.0% or 161.8% of XA.
Now let’s visualize these harmonic relationships.
Take a look at the illustration below:
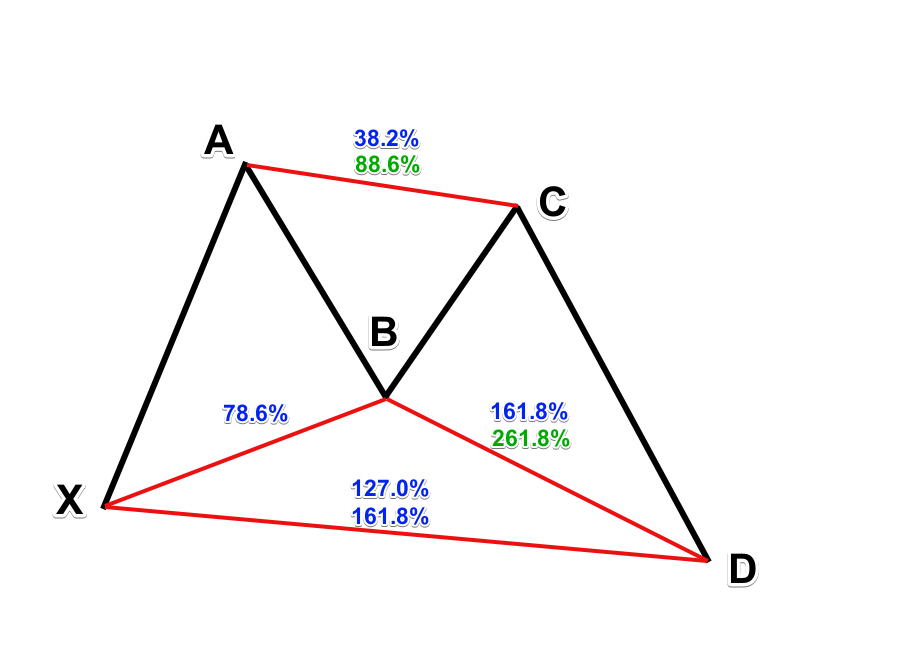
We want to see a Fibonacci cluster form at the projected D point so that we can gain confidence in the anticipated reversal zone.
Notice that the Fib levels of the BC and the CD move are shown with two different colors – green and blue. The green color levels are related to each other, just as the blue color levels are related to each other.
As we discussed above, if BC reaches 38.2% of AB, CD should go to 161.8% of BC. If BC reaches 88.6% of AB, then CD should reach 261.8% of BC. This is not an unbreakable rule but rather a general guideline that you should be aware of. However, as mentioned earlier the B point retracement of 78.6% of XA is critical and must be met in order to correctly classify a pattern as a Butterfly.
Bullish Butterfly Chart Pattern
In the above illustration, we discussed the bullish butterfly pattern. Let’ take a look at the structure again with the expected price reaction at the D point.
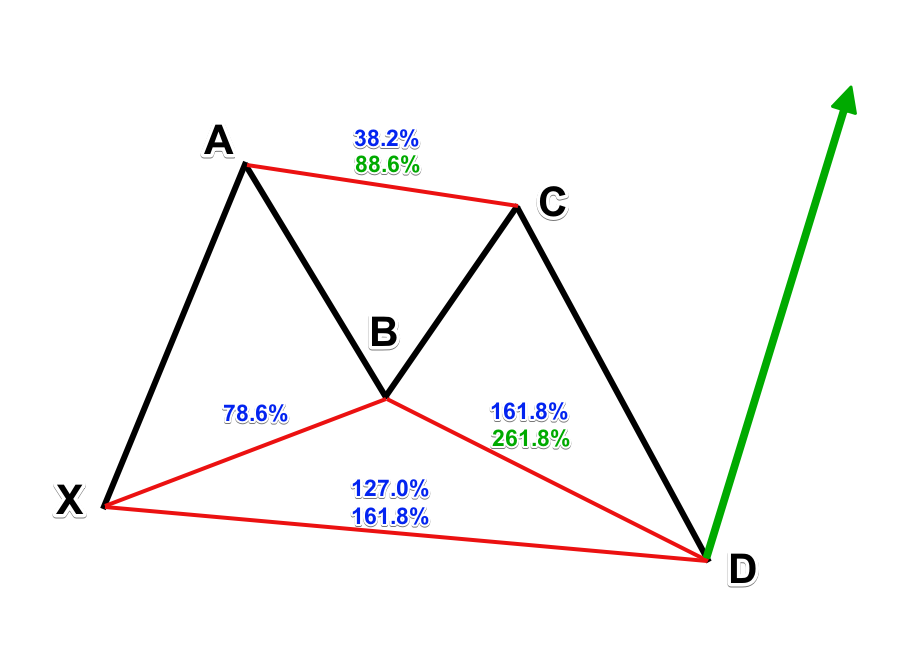
Notice how the bullish Butterfly resembles an “M” type structure. The bullish Butterfly is expected to lead to bullish price action at the D point as shown by the green arrow on the sketch.
Bearish Butterfly Chart Pattern
The bearish Butterfly is the mirror image of the bullish Butterfly. In this relationship, the bearish Butterfly pattern resembles a “W” type structure. Let’s look at a sketch of the bearish Butterfly:
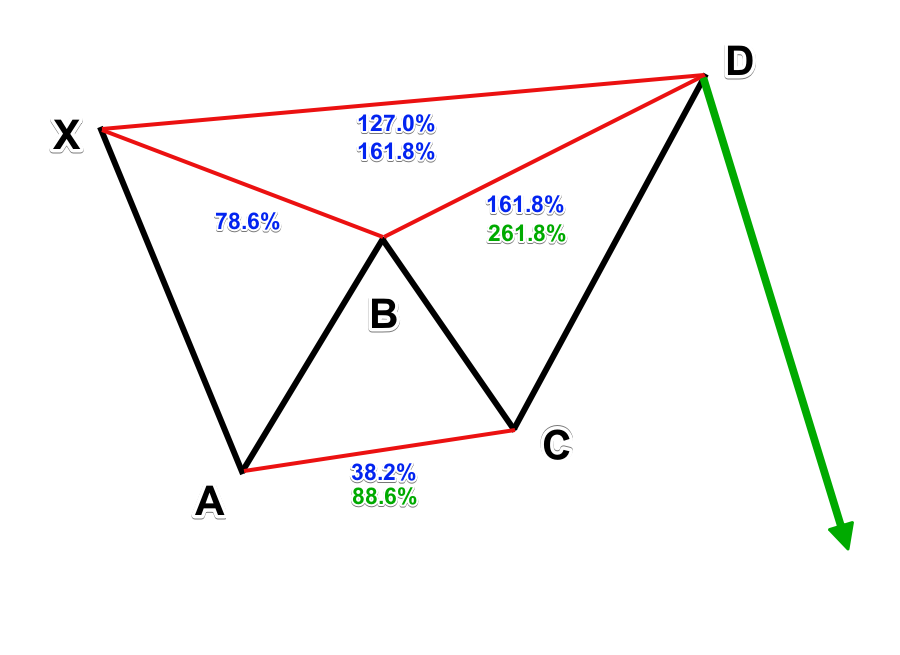
The bearish Butterfly is expected to lead to bearish price action at the D point as shown by the green arrow on the sketch.
Confirmation of the Harmonic Butterfly Trade
The confirmation of the Butterfly chart pattern comes from the establishment of point “D.”
When the price actions begins to show signs of a reversal at that level, you would consider entering the trade.
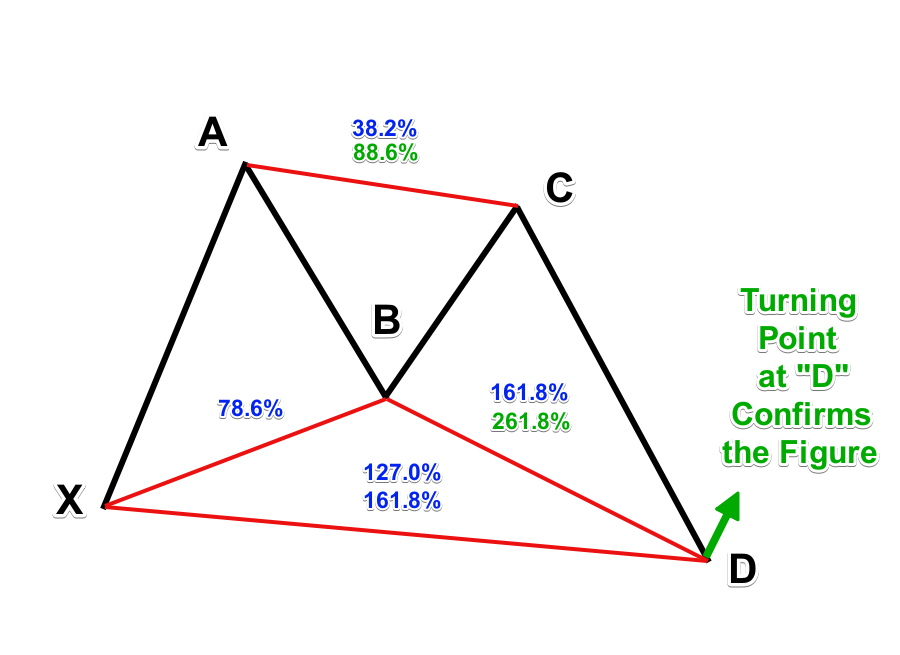
This image shows the typical confirmation of a bullish Butterfly chart pattern. Notice in the sketch, the manner in which price begins to turn once it reacts to the D level. Obviously, it would work the same way with a bearish Butterfly pattern but in the opposite direction.
Forex Butterfly Strategy
Now let’s describe a system for trading the Butterfly pattern. Keep in mind there are different strategies for trading the Butterfly pattern, but we will discuss a variation based mainly on using the BC projection to find the D point. We will walk through each of the three important trade elements – Entry, Stop Loss, and Take Profit.
Entry Point
If you are trading a bullish Butterfly, you would buy the Forex pair when the price reacts to the D level after:
- CD sets a bottom at 161.8% of BC if BC retraces 38.2% of AB
- Or after CD sets a bottom at 261.8% of BC if BC retraces 88.6% of AB
If you are trading a bearish Butterfly, you would sell the Forex pair when the price reacts to the D level after:
- CD sets a top at 161.8% of BC if BC retraces 38.2% of AB
- Or after CD sets a top at 261.8% of BC if BC retraces 88.6% of AB
Stop Loss
If you are trading a bullish Butterfly, you should place a Stop Loss order below the swing of the newly created D bottom. If you are trading a bearish Butterfly, then place a Stop Loss order above the swing of the newly created D top.
Make sure you position the Stop at a reasonable distance beyond Point D, taking current volatility into consideration.
Take Profit
There are numerous ways that you could manage your exit for the Butterfly extension pattern. One effective way is to set the price target at the 161.8% extension of the CD move.
You may consider closing a portion of your position prior to this level as price approaches key swing points within the structure. These important levels include the price swings at points B, C, and A.
These levels could act as potential turning points. As such, you should carefully watch the way that price interacts at these levels to determine if you should stay in the trade further or exit.
If a breakout through the A level occurs, then you can be fairly confident that the projected target at the 161.8% extension of the CD leg should be achieved.
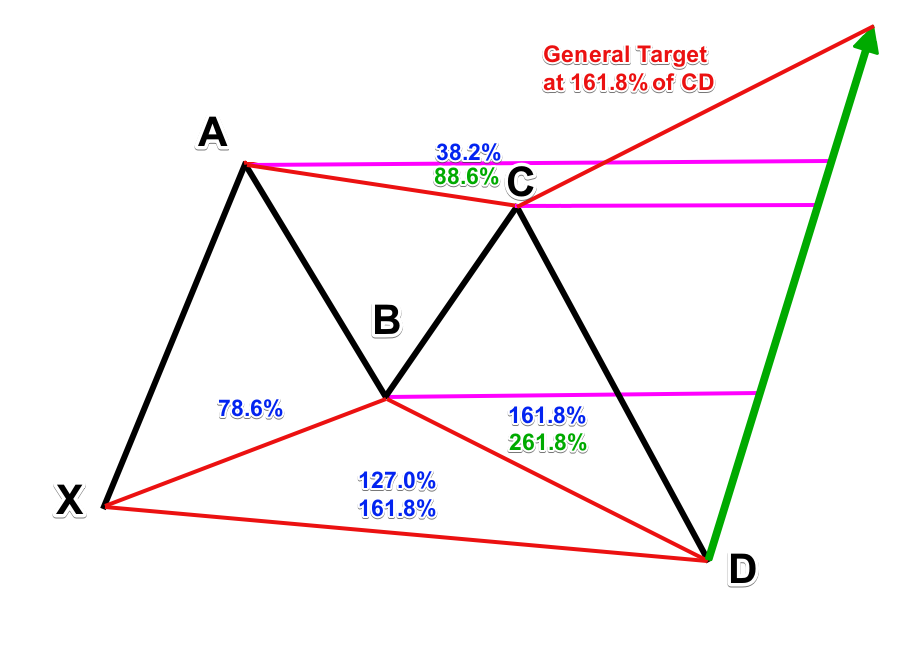
The diagram above provides a visual representation of the general expectations during a bullish butterfly trade. The magenta horizontal levels at points B, C, and A are the potential resistances on the way up to the final target. Watching price action at these levels carefully will help you to better manage your trade.
There is no set progression for the Butterfly pattern, so it is important that you monitor the trade for the best exit opportunities. The rules above are fully applicable to the bearish version of the Butterfly chart pattern but in the opposite direction.
Bearish Butterfly Pattern Example
The first example we will study is a bearish Butterfly pattern. You will find the pattern below:
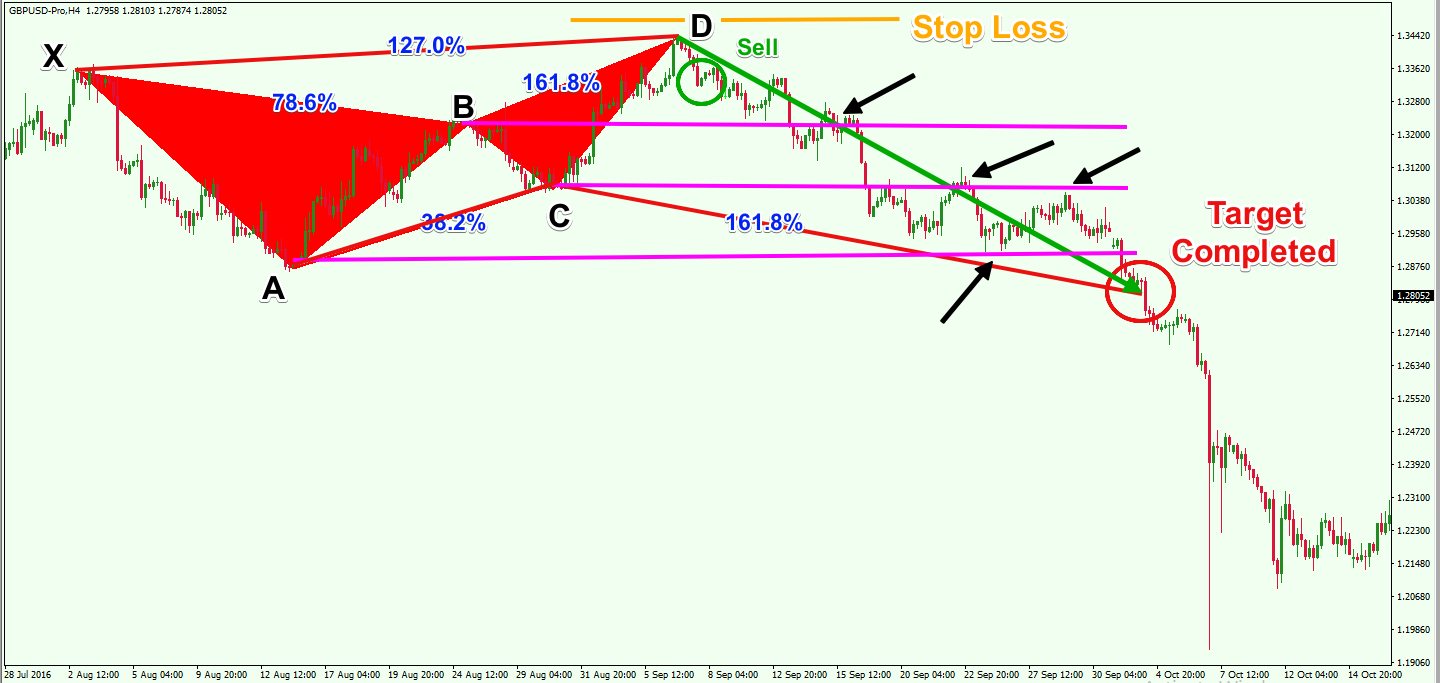
Above you see the H4 chart of the GBP/USD for August – October 2016. The red section on the chart highlights the bearish Harmonic pattern.
We can clearly see the four moves that make up the butterfly pattern on the chart – XA, AB, BC, and CD. At the same time, the price swings respond to all the requirements of our Harmonic Butterfly pattern. They are as follows:
- XA can be any random bearish move on the chart.
- AB retraces 78.6% of XA.
- BC retraces 38.2% of AB.
- CD extends 161.8% of BC.
After price reaches the 161.8% Fibonacci extension of BC, we see a turning point and a bearish bounce. This is when you would want to sell the GBP/USD pair on the assumption that the price will begin a bearish move. Your Stop Loss order should be placed above the D point as shown on the image.
The magenta levels on the chart indicate the different support zones that we are likely to encounter for this Short Butterfly trade. The black arrows point to the price reaction around these levels. Notice how they react, and turn from support into resistance as price breaks thru these key areas. The bears are overpowering the bulls at each of these levels. This demonstrates the strength of the bearish move and the increasing likelihood of our final target being reached.
Soon afterwards, the GBP/USD price reaches the 161.8% extension target of the CD move. Upon reaching this desired target we would close the trade with a profit.
Bullish Butterfly Pattern Example
Now let’s dissect a bullish Butterfly pattern on the price chart. Have a look at the image below which displays a bullish butterfly formation.
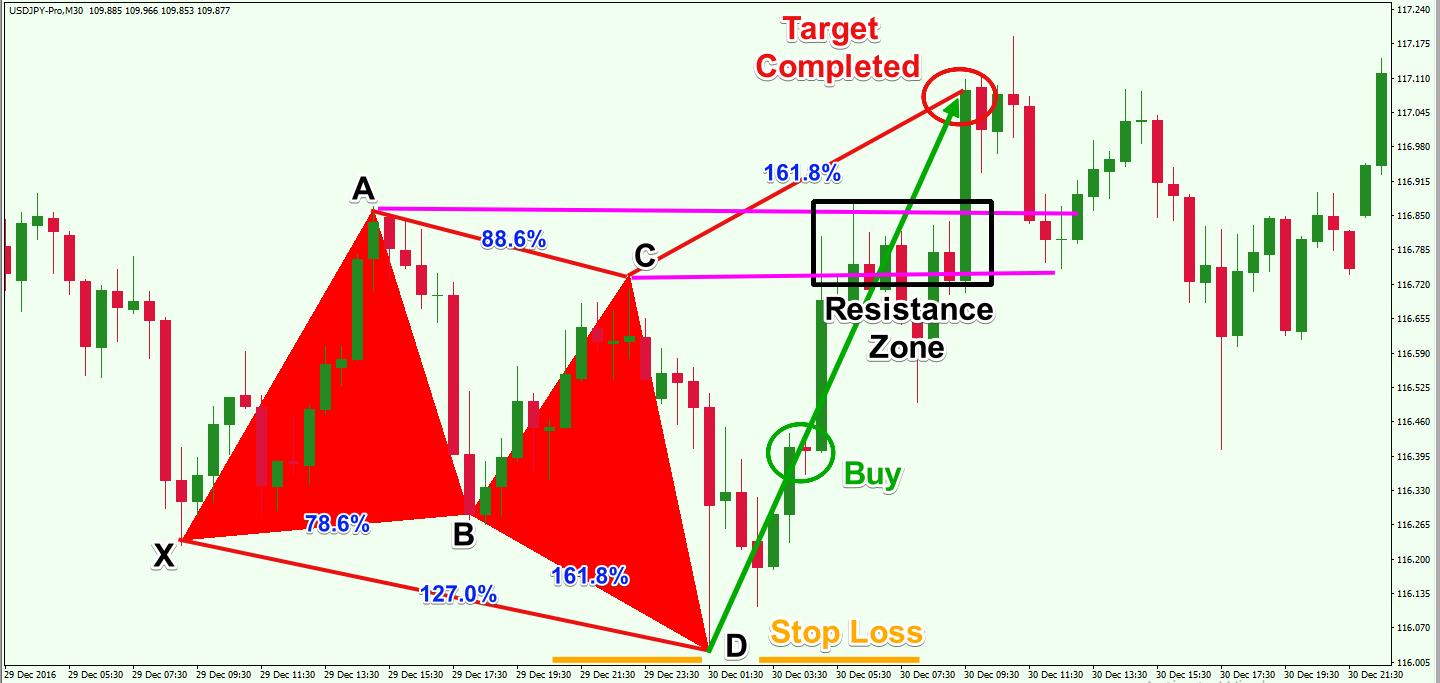
Above you see the 30-minute chart of the USD/JPY Forex pair for December 29 – December 30, 2016. The image shows a bullish Butterfly chart pattern that provides a tradable opportunity. The pattern is highlighed in red on the chart. We see that the level of the swings respond as follows:
- XA is a random bullish move on the chart.
- AB retraces 78.6% XA.
- BC reaches 88.6% of AB.
- CD reaches 161.8% of BC.
After the price reached the 161.8% extension of BC, we see the creation of a turning point on the chart. This also corresponds to a 127% extension of the XA leg. As such we have to think that in this case, we may not get any further extension in the CD leg. Notice the low at the D point is created on high volatility and price is rejected quickly from the 127% extension area.
Keep in mind, that in trading, we are working with probabilities and not certainties. As such, we must always be mindful of price action and what the market is telling us at any given moment and react accordingly. With the excessive volatility, it would be wise to wait for the market to normalize before committing to a trade here.
We can enter at the end of the second consecutive bullish candle. This is shown with the green circle on the chart. You could buy the USD/JPY on the assumption that we have a valid Butterfly pattern and that price is likely to move higher from here.
Notice the two magenta lines that indicate the top of C and the top of A. They create a resistance zone where the price shows clear hesitation. The price consolidates and dips a bit during this time. It would certainly be a viable option to close out the trade here based on the price action evidence being presented to us at this time.
Soon after, the price creates a sharp increase, and it eventually reaches the 161.8% of the CD move, which completes the final price target of this bullish Butterfly setup.
Notice that this time there are only two magenta levels indicating potential resistance points on the way up. Why are there only two in this case? This is because our entry signal comes after the price has already increased above the B bottom and so there is no point in marking this level as resistance. The price may return to it and test it as a support, but this does not happen in our example.
Fibonacci Retracement Tool Settings
As you start searching and studying your charts for potential butterfly patterns, you may notice that some of the levels required to confirm the Butterfly pattern are not present in the default Fibonacci indicator within your platform. The standard Fibonacci Retracement tool consists of the following levels:
- 0.00%
- 23.6%
- 38.2%
- 50%
- 61.8%
- 100%
- 161.8%
- 261.8%
But the Butterfly chart pattern requires some additional levels:
- 78.6%
- 88.6%
- 127%
In this case, you need to manually add these specific levels to your default Fibonacci drawing tool. If you are using the MetaTrader 4 platform, you can do this by right-clicking the indicator and choosing “Fibo Properties…” Then go to “Fibo Levels” and add the respective levels.
Conclusion
- The Butterfly formation is an extension pattern that is a part of the Harmonic family of patterns.
- The Butterfly pattern is a reversal pattern, which can often be found at the end of a trend move.
- Structurally, the formation consists of five points: X, A, B, C, and D.
- The pattern is represented by four important price swings: XA, AB, BC, and CD.
- A valid Butterfly pattern should conform to the following guidelines.
- XA: could be any random move on the chart.
- AB: should be a 78.6% retracement of the XA leg.
- BC: should be either a 38.2% or 88.6% retracement of the AB leg.
- CD: should reach 161.8% of BC if BC has reached 38.2% of AB, or it should reach 261.8% of BC if BC has reached 88.6% of AB.
- Confirmation of the Butterfly setup comes as price begins to turn at point D.
- Forex Butterfly Strategy:
- Open a trade when you identify the turning point at D.
- Place a Stop Loss order beyond the D point, taking into account current volatility.
- Take Profit target is equal to 161.8% of the CD leg. Although this is the final target area, you should watch the price behavior at B, C, and A to manage an early exit if necessary.
- The Fibonacci indicator is an essential tool when trading the Butterfly setup in Forex. You should make sure to add the required levels to the indicator in order to visualize the pattern correctly. The following levels should be added to the default Fibonacci drawing tool:
- 78.6%
- 88.6%
- 127%