Candlestick trading techniques are very popular with price action traders. There are a countless array of candlestick patterns that appear in the market. Some of these patterns have reversal implications, while others are considered continuation patterns. The dark cloud cover is one such candlestick that has a bearish reversal characteristic.
Dark Cloud Pattern In Technical Analysis
The dark cloud cover is a two candle formation that is characterized as having reversal characteristics. More specifically, it is seen near the top of an uptrend, or near the top of a trading range. Either way, it has bearish implications. The dark cloud cover is comprised of two candles, wherein the first candle is a bullish candle, with a relatively long body. The second candle gaps higher, but then reverses and closes below the halfway point of the body of the first candle.
Below you can see an illustration of the dark cloud cover candlestick pattern.
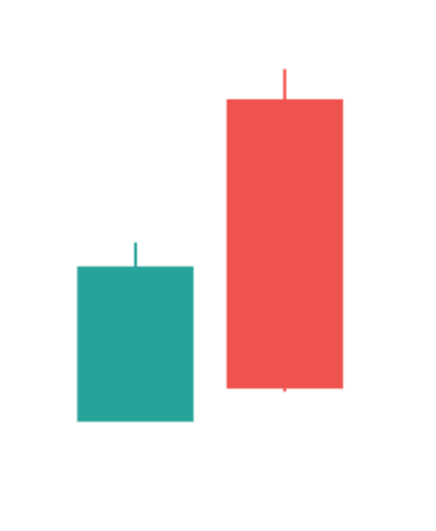 Notice on the above price chart how the first candle is a bullish candle, and then how the second candle gaps above the high of the first candle, but ultimately closes below the midpoint of the body of the first candle. The gap higher after the first candle’s close is typically considered as a bullish sign. But the reversal of price and a close below the central point of the body of the first candle is what holds the most significance in this formation. It foretells the change in sentiment, from bullish to bearish.
Often times, the larger the upside gap, the more powerful the potential reversal will be.
The dark cloud candlestick confirmation will come upon a break below the low of the second candle within this formation. Typically we want to see an immediate follow through to the downside.
More specifically, we prefer that the candle that immediately follows the completion of this pattern take out the low of the second candle. Sometimes however we may need to wait for some additional candles to form before we get this downside break. Nevertheless, the sooner it occurs the more advantageous it will be from the bearish trade perspective.
Additionally, the best dark cloud cover pattern formations tend to occur after a prolonged price move to the upside. In these cases, they tend to provide an excellent reversal signal that can lead to a minor retracement within the trend, or result in a complete trend reversal. Dark cloud candle patterns occurring near the top of consolidation ranges can be useful as well, however, there are not nearly as powerful as when they occur after an uptrend.
Most traders are advised to use some additional market timing indicator or technique in conjunction with the dark cloud pattern. Doing so, will provide for a higher probability trade set up.
Some of the more popular technical tools that can be utilized in combination with the dark cloud cover formation include momentum oscillators such as RSI, Stochastics, or MACD, chart patterns such as rectangles and flag patterns, support and resistance levels such as horizontal price levels, diagonal trendlines, or moving averages. These are just some of the technical methods that can be used alongside the dark cloud cover formation.
Also as a point of interest, the dark cloud cover is sometimes confused with the bearish engulfing pattern. Although both of these patterns appear similar and have bearish implications, there are some distinct differences between the two that traders should be aware of.
The most important of which is that a bearish engulfing pattern is a two candle formation wherein the second candle completely engulfs the body of the first candle. Contrary to that, the second candle within the dark cloud cover pattern is only required to close below the center point of the body of the first candle.
Psychology Behind The Dark Cloud Pattern
So what is going on behind the scenes within the dark cloud cover formation? As we’ve noted, this is a reversal pattern that occurs near the top of the up trending market, or near the top of a range bound market environment. In either case, the prices have been rising and as such there is bullish complacency in the market. This sentiment is also fueled by the gap up that occurs following the first candle within this formation.
However, that upside gap is quickly met with strong supply, which pushes the prices lower, ultimately closing below the middle point of the initial candle. This marks an important turning point in the market. The bulls were in control and now the bears are starting to take control. The dark cloud cover formation marks this subtle but important transition point, which will often be followed by a sharp market reversal to the downside.
Now, those bulls who were long the market are starting to feel the pain of the bearish price reaction. Many of them will act to minimize their losses by exiting their long positions with sell to close orders. This is in addition to traders with long positions who have placed a hard stop or trailing stop in the market. As these additional sell to close orders get triggered, it will add fuel to the fire pushing prices lower.
It’s important to note that while the dark cloud cover can appear on any price chart regardless of timeframe, it is most useful when seen on a daily or weekly chart. The price action on the daily chart is particularly important, and as a result, when you see the dark cloud appear on this timeframe, you should pay very close attention to it.
Bearish Dark Cloud Cover In Uptrend
Let’s now look at an example of the bearish dark cloud cover candlestick pattern within the context of an up trending market. Below you can see the price chart of Qualcomm stock shown on the one day timeframe.
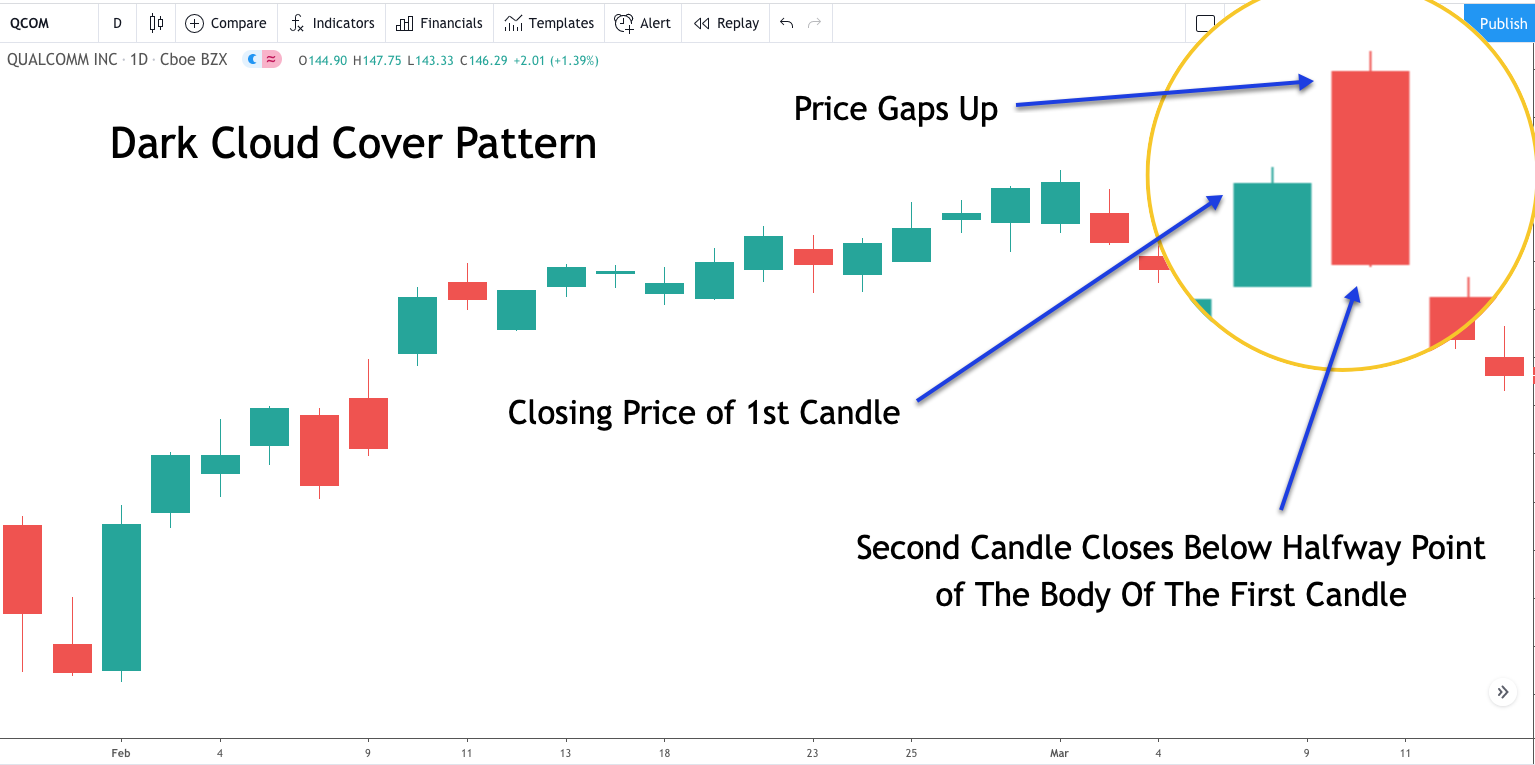
As you can see from the above chart, the price was moving steadily higher forming a nice uptrend. Towards the upper right section of the chart you can see the dark cloud cover pattern within the magnified area. Notice the first candle is a green candle, which represents a bullish close. The price action at the start of the next candle gaps higher, and then starts to selloff, pushing prices lower below the halfway point of the body of the first candle. Can you see that? These conditions confirm that the structure is indeed a dark cloud cover pattern.
The expectation following the completion of this pattern would be for prices to start heading lower retracing a portion of the uptrend, or potentially reverse course entirely and began a new downtrend phase. It is difficult to know which of these two scenarios is likely to occur at the completion of the pattern. However, the price action should help us in gauging the more likely scenario.
More specifically, if following the dark cloud cover there is a very sharp reversal, then there is a higher tendency for a complete trend change to occur. If however, the reversal following the dark cloud cover formation is relatively sluggish and you can see overlapping candles as the price moves lower, then there is a higher chance that the bearish reversal will more likely be a minor correction to the uptrend.
Dark Cloud Cover At Horizontal Price Resistance
As we noted earlier, it’s recommended that when trading the dark cloud cover candlestick formation that you do not do so in isolation. That is to say that an additional technical study or indicator should be utilized in conjunction with this reversal pattern. One of the best ways is to look for the dark cloud cover formation at critical horizontal price levels. When you’re able to identify such a scenario, you will increase the odds of a winning trade.
Below is an example of the dark cloud cover seen at a major price resistance zone.
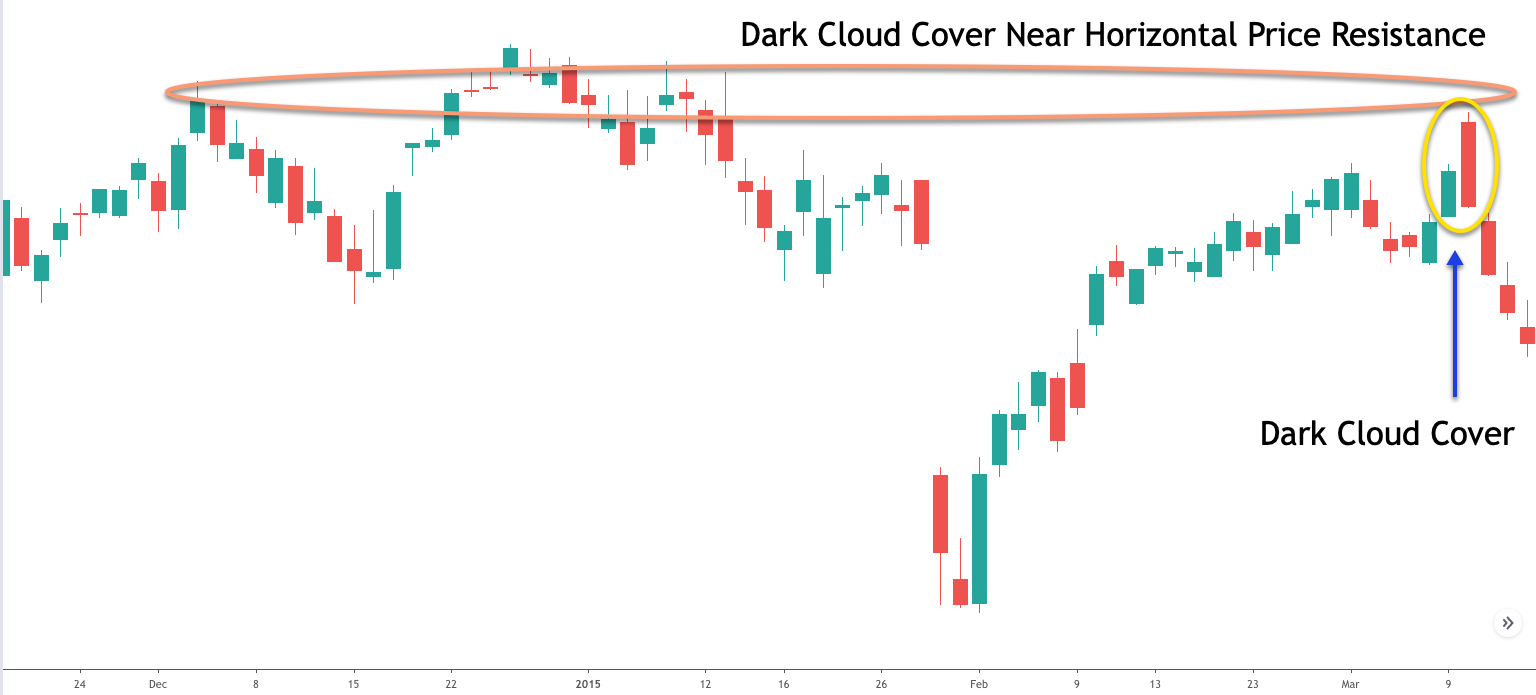
Notice the swing highs near the top of this price chart. Prices are attracted to this level. However as soon as it enters within that zone, the supply from the sellers pushes the price back lower. You can see the dark cloud cover near the upper right of this price chart. Notice just as soon as the price nears this level and forms the dark cloud cover, it gets rejected to the downside as the selling pressure intensifies near the horizontal price level.
It’s important to note that when we’re talking about a key horizontal price level, we need to keep in mind that these are areas of interest or a zone rather than a fixed price along the horizontal axis. As such, you should be thinking of horizontal price resistance, and support for that matter, in these terms and not become overly rigid in trying to plot the exact fitting line.
Dark Cloud Cover At Upper Bollinger Band
Let’s now look at out another example of combining a technical study with the dark cloud cover formation. In this example we will combine the Bollinger band indicator with the dark cloud cover. The Bollinger band is a volatility band that can help locate overbought and oversold conditions in the market. Essentially, we can use the Bollinger band to create a mean reversion strategy to find potential reversal points.
So in this way, when the price touches or penetrates the upper Bollinger band, that event could provide a selling opportunity. Similarly, when the price touches or penetrates the lower Bollinger band, that event could provide a buying opportunity. In our particular case, with the dark cloud cover, we are primarily interested in the upper Bollinger band, since we would be looking to confirm a bearish signal.
Below is a chart image of Facebook stock based on the daily timeframe.
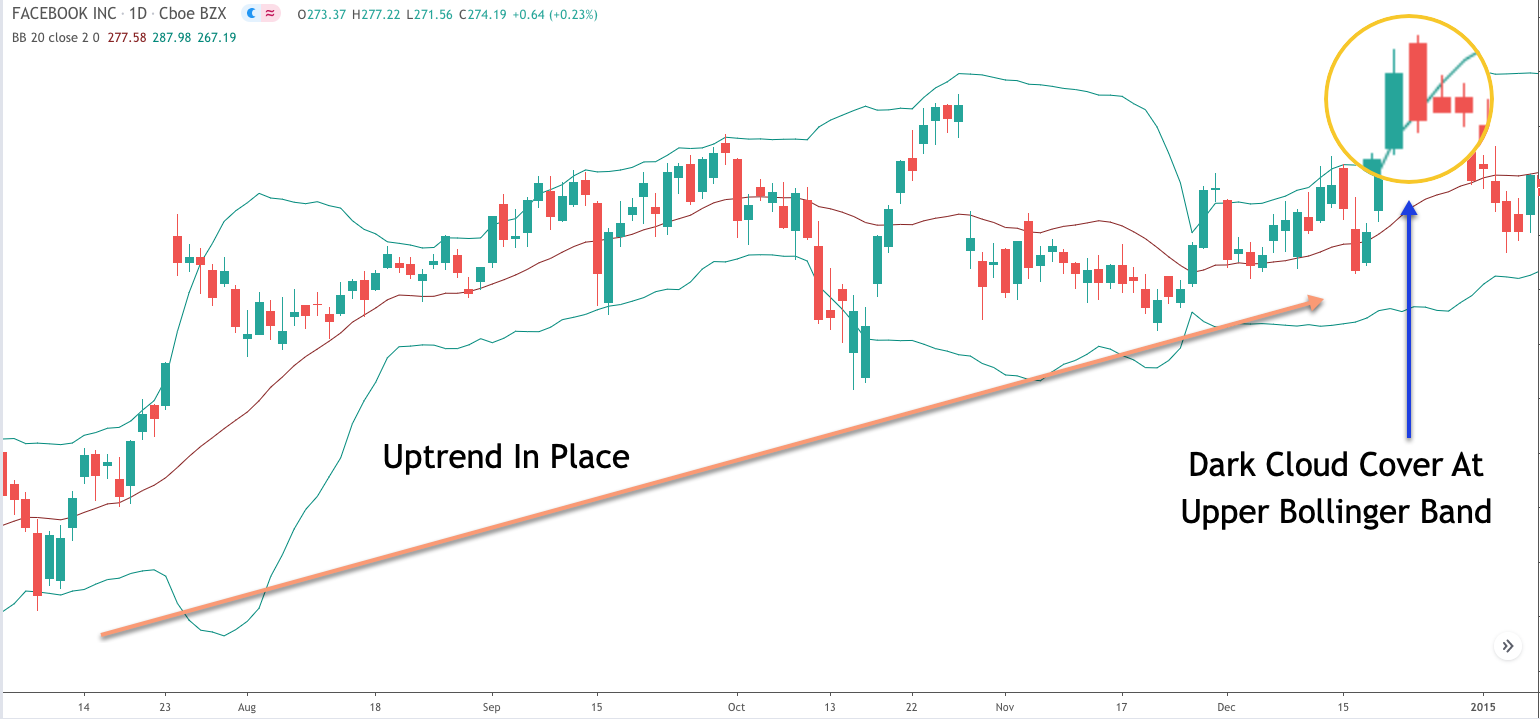
We can see that the market has been on a steady uptrend since the swing low seen at the bottom left of the chart. Scrolling to the upper right of the chart we can see the nice dark cloud cover pattern that forms. Notice also that this pattern occurs and completes near the upper line of the Bollinger band. As a result, the dark cloud formation at the upper Bollinger band provides confluence for a short trading opportunity. The more evidence that we can stack on our side, the better chance we will have for achieving a positive result on the trade. The dark cloud cover, and Bollinger band combination is an excellent way to combine two non-correlated technical studies for market analysis.
Trading Dark Cloud Cover Candlestick Pattern
Let’s now build a trading strategy based on the dark cloud cover formation. This strategy will be based on a mean reversion methodology that uses two primary technical studies. The first will obviously be the dark cloud cover formation, and the second will be the Bollinger band indicator. We’ll use the default for the Bollinger band indicator which is a 20 period moving average centerline, and two standard deviations for the bands. The strategy will seek to capture a high likelihood bearish reversal point in the context of an uptrending market condition.
So here are the rules for entering a short position using this strategy. The recommended timeframe for this strategy is the daily chart.
- An uptrend must be clearly present on the price chart.
- A dark cloud cover formation must be present.
- The second bar within the dark cloud cover must be outside the upper Bollinger band line.
- Enter a sell order at the break and close of the low of the second candle within the dark cloud cover. This sell order must be triggered within a maximum of three bars following the completion of the dark cloud cover.
- The stoploss should be placed above the high of the second bar of the dark cloud cover formation.
- The exit will occur when one of these conditions is met: The price crosses below the Bollinger band centerline and then closes above it or the price touches the lower Bollinger band line. Whichever condition occurs first will trigger the exit.
Dark Cloud Trading Example
It’s now time to look at an example of this strategy. The price chart below is the daily chart of Facebook, and is the same chart that was shown earlier in the Bollinger band section above. What we have done, however, in this case is that we have zoomed in to the area of the dark cloud cover set up to better illustrate this trade example.
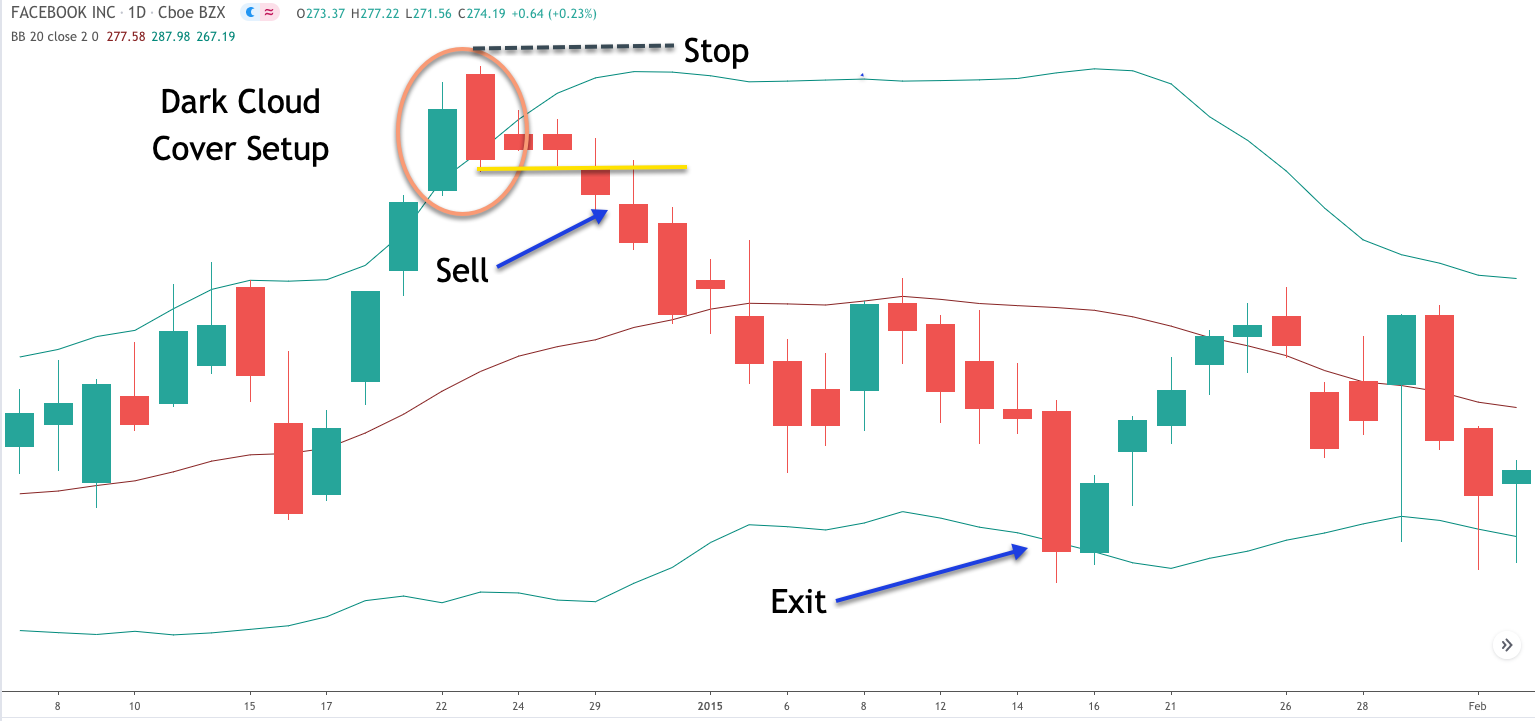
So let’s begin. As you can see, the price action has formed a dark cloud cover formation. Notice the first candle which is a bullish candle with a relatively sizable body, and the second candle which gaps higher, and then manages to close below the midpoint of the body of the initial candle. This validates the dark cloud cover formation.
Next, we want to ensure that the dark cloud cover occurs in the context of an uptrending market. Although it’s not clearly visible on this price chart which has been zoomed in for illustration purposes, you can refer to the same chart shown earlier which clearly shows that the price of Facebook was trending higher leading to this dark cloud cover formation.
Now that we have confirmed these two important elements of this trading strategy, we want to make sure that the Bollinger band condition is also met. More specifically, based on our strategy rules, the second bar within the dark cloud must extend beyond the upper Bollinger line. This provides evidence of an extreme overbought market condition, which will increase the chances of a price move lower. As we can see from this price chart the second bar opened above the upper band, thus confirming this requirement.
Now with all of these items in place, we can prepare for a short trading opportunity. We would place a market order to sell once the price crosses below and closes below the second candle within this formation. You can see the yellow horizontal line marked which shows this signal line. Additionally, we must keep in mind that in order for this to be a valid trade set up, that breach and close below the signal line must occur within a maximum of three bars following the dark cloud cover formation. If you look closely at the price chart, you can see that the third candle was the charm, and was the one that broke and close below the important signal line.
With that, we would’ve entered a sell order at the market. Once the sell entry order was filled, we would turn to the trade management process. The first thing we would need to do is to place a stop loss order in the market to protect the trade. The stoploss would be placed above the high of the second candle of the dark cloud cover formation.
We can see that immediately following the sell entry, prices began to move lower sharply and thus, our stoploss was never in any jeopardy of getting hit. As the price was moving lower, we would need to be cognizant of where our exit signal would occur. Remember, that the exit for this trade would be executed upon either the price moving below the centerline and then closing back above it, or upon the touch of the lower Bollinger band, whichever of these two conditions occur first.
As we can see from the chart, the price did cross below the centerline quite easily, however it was not able to close above it, and instead kept moving lower until it interacted with the lower Bollinger band as shown by the blue arrow marked Exit. Therefore, this event would have triggered the exit on the trade closing us out with a profitable position.
Summary
In this lesson we learned all about the candlestick reversal pattern known as the dark cloud cover. It is similar in appearance and has the same implications as the bearish engulfing candlestick, however, there are some distinct differences as we’ve noted. Both are extremely powerful trading signals, particularly when they occur after a prolonged period of rising prices.
Some traders mistakenly believe that they can simply use candlestick patterns in isolation. Using dark cloud cover formations, or any candlestick or for that matter by itself is not recommended.
The higher probability trade occurs when you are able to find an additional layer of confluence that supports taking a short position. We illustrated a few such techniques of incorporating this type of hybrid method using horizontal support resistance or Bollinger bands.
As a final note, the dark cloud cover chart pattern is most often seen in stock prices, and the in the futures market. Within the Forex market this formation is more likely to occur at the start of the trading week, since that is the time when weekend gaps tend to occur.