The primary job of a trader is to protect his or her account at all times. Placing an initial stop loss in the market following an entry execution is an important step towards that goal. A trader who has an open trade profit must also attempt to contain the risk of loss, while balancing the prospect of remaining in a trade for as long as possible to add further profits on the trade. A trailing stop loss order provides an excellent means for achieving this balance.
What Is A Trailing Stop Loss Order?
Although there are two primary components to a trade, the entry and the exit, the vast majority of traders focus primarily on the entry mechanism. Successful traders have come to realize that the exit is as important as the entry if not more so.
As such, it’s imperative that traders have a plan for reducing risk by using an initial stop loss on the trade, as well as a trailing stop strategy which moves closer to the current price as the trade moves in your favor. Trailing stops help lock in open trade profit while helping to realize the maximum potential profit on a trade.
The initial hard stop loss is typically placed at the time of entry execution, while the trailing stop can be implemented upon entry or as the trade begins moving in your intended direction. Trailing stops align perfectly with the trading axiom that says that we should let our winners run while cutting our losers short.
A properly designed and executed trailing stop strategy will allow you to stay in the market for as long as the price action continues to move higher in the case of a long position, and continues to move lower in the case of a short position. Unless and until the weight of evidence proves otherwise, a trailing stop loss order forces you to be patient in an attempt to extract the most gain from the price trend.
There are different types of trailing stops that can be used effectively in the market. It is beyond the scope of this article to list and detail each and every one of them. However, we will be discussing four of the more popular trailing stop strategies used by forex and futures traders alike. This includes the ATR trailing stop loss, the Chandelier trailing stop loss, the Donchian channel trailing stop loss, and the Keltner channel trailing stop loss.
ATR Trailing Stop Loss Strategy
The average true range, or ATR, is a volatility based indicator and is quite versatile. One of the best uses of the ATR indicator is as a trailing stop loss mechanism. Since the ATR reveals the current volatility of the market, an ATR trailing indicator has the characteristic of tightening closer to the price action during low volatility phases, while expanding during high volatility phases.
The ATR indicator is calculated using a specified look back period. The most common of which include the 14 or 21 day look back. The ATR exit strategy will usually call for a two or three times multiple of the ATR reading as the trailing stop loss order.
For example, in the context of an uptrend, a 2X ATR(21) stop loss order would trail below the current price by twice the ATR reading of the last 21 periods. In the context of a downtrend, a 2X ATR(21) stop loss order would trail above the current price by twice the ATR reading of the last 21 periods.
Many trend following systems utilize some variation of the ATR trailing stop. It allows traders to get the most benefit from a trending environment while capping open trade risk along the way. In addition to the obvious benefit that the ATR trailing stop order offers from the practical trading perspective, it also provides a key psychological benefit as well.
In other words, we know that trade management is one of the most important yet difficult parts of trading, and wherein emotions rather than rationality can drive our decision-making. An ATR based stop loss provides a trader a systematic way for planning out their exit strategy in a logical non-biased manner.
ATR Trailing Stop Loss Example
Below is an example of an ATR trailing stop in forex. The ATR trailing stop loss is shown on the four hour chart of the Euro to USD currency pair.
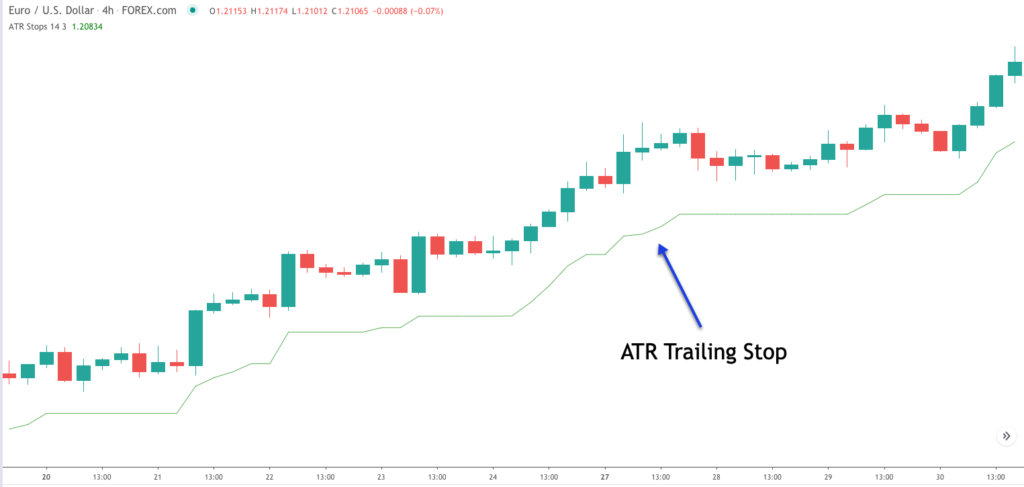
The green line below the price action represents the ATR trailing stop. The settings for this particular example are based on a look back period of 14, and an ATR multiple of three. Notice here as the uptrend progresses the ATR trailing stop moves higher towards the current price. Notice also how the ATR line flattens out as the price action begins to consolidate. Assuming that you had a long position in this market, the automatic trailing stop exit point would occur when the price breaches and closes below this ATR trailing stop indicator.
Chandelier Stop Loss Strategy
The Chandelier exit strategy was created by Chuck LeBeau, who is a renowned technical analyst and system trader. The chandelier stop loss strategy uses the average true range within its calculation. It works similarly to the ATR stop loss strategy detailed above, however, the chandelier exit uses a few very specific parameters.
More specifically, the chandelier exit is computed using an ATR look back period of 22, and a 3X average true range multiplier. The actual chandelier exit indicator plots a line below the price as prices are moving higher, and the exit is triggered upon prices penetrating to the downside. Similarly as prices are moving lower, the exit is triggered upon prices penetrating the line to the upside.
These days most trading platforms include the chandelier exit indicator as part of its default library of technical studies. If however, your particular trading or charting platform does not include the chandelier exit indicator, you may be able to customize the default ATR indicator to produce the chandelier indicator on your own.
Again, the primary goal for incorporating this exit strategy is to help traders avoid getting scared out of a correction too early, and stay with the trend for as long as possible.
Although the chandelier exit strategy can be implemented on various time frames, it is best used as a swing trading or position trading exit strategy rather than as a short-term exit strategy. This is because there is a higher tendency for trends to persist on timeframes such as the daily and weekly, and less so on lower time frames.
As such, the chandelier stoploss method will trail the price action more effectively and be less prone to false signals on the preferred time frames mentioned.
Chandelier Stop Loss Example
The price chart below illustrates an example of the chandelier trailing stop strategy. The chart is for the EURUSD currency pair based on the daily timeframe. 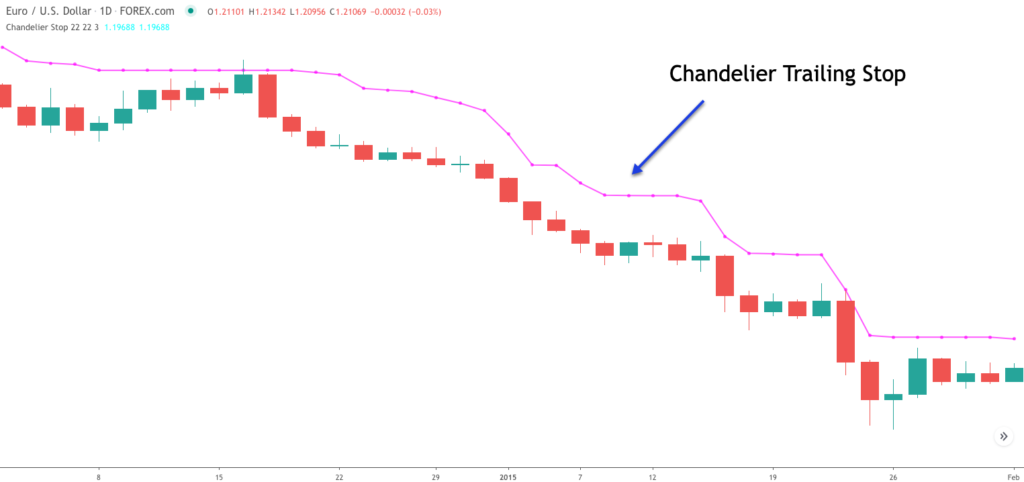
The red line above the price action represents the chandelier trailing stop indicator. The default settings used for this indicator include a 22 period look back, which in this case is 22 days, and an ATR multiple of three.
Notice that during the progression of the downtrend the chandelier stop moves lower with the price action. Just like the standard ATR trailing stop, the chandelier trailing stop limit accelerates its downward movement as the prices move lower. However, notice how during the consolidation phases the chandelier exit indicator tends to flatten out.
This is quite common with the chandelier trailing indicator. That is the reason it represents an excellent exit mechanism. In other words, it will allow enough breathing room to account for normal and expected retracement within a trend.
As soon as the correction becomes a bit overextended, the chandelier trailing stop will signal the trade exit. In this particular case, if you were short this market you would look to exit when the price breaches and closes above the chandelier indicator line.
Donchian Channel Trailing Stop Loss Strategy
The Donchian channel was created by Richard Donchian, a pioneer in technical analysis and trend trading methodologies. The Donchian channel is technical study that is often used within many momentum breakout type systems and strategies. The channel is drawn on the price chart using an upper resistance line, and a lower support line. These lines represent the current high and low, respectively, over a specified number of periods.
The Donchian channel typically uses the look back period of 20 within its calculation. Although some technical traders are familiar with the Donchian channel breakout indicator used as an entry signal, not too many traders are familiar with its application as a trailing stop loss mechanism.
The best trailing stop period setting for the Donchian channel is 20. So essentially, when you are long a position, and the 20 period Donchian channel plots a support line below the price, that line represents the lowest low of the previous 20 bars. When the price reaches this level to the downside, traders should immediately exit their long position.
Similarly, if you are holding a short position, and the 20 period Donchian channel plots a resistance line above the price, that represents the highest high of the previous 20 bars. When the price reaches this level to the upside, traders should consider exiting their short position.
Traders that prefer a wider stop loss, can consider a setting of 55. Though the 55 input within the Donchian channel provides a good breakout entry, it does not perform as well as the 20 period setting when used primarily as an exit strategy. In any case, traders should test both variations to see which performs best in their chosen market, and which one they feel more comfortable with.
As with the chandelier exit strategy, the Donchian exit strategy is best utilized on a relatively higher timeframe such as the daily and weekly charts for the same reasons as we noted earlier.
Donchian Channel Trailing Stop Loss Example
Let’s now look at a trailing stop example using the Donchian channel. Below you can see the price chart of the EURUSD currency pair based on the daily timeframe.
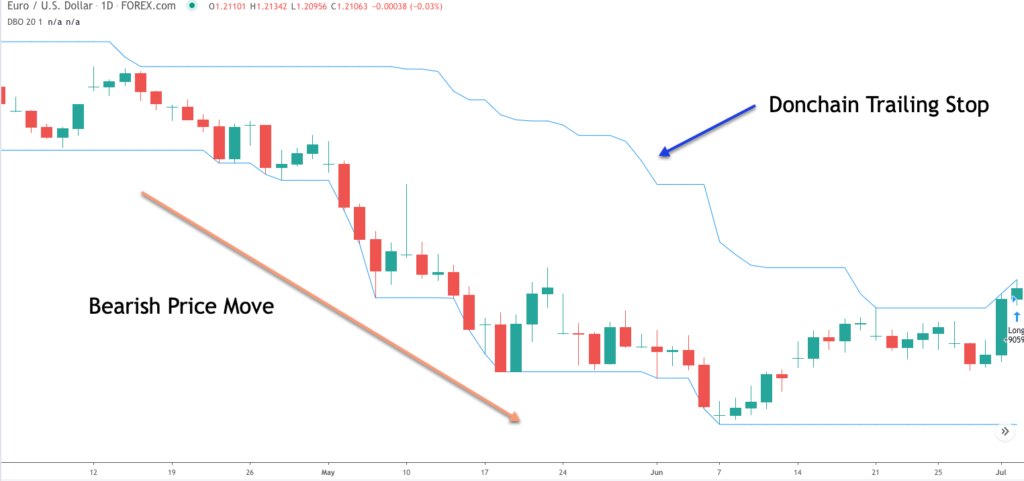
The upper blue line represents the resistance line of the Donchian channel. The lower blueline represents the support line of the Donchian channel. The settings for the Donchian channel here is the default 20 period lookback. And so, what that essentially means is that the upper line represents the highest high over the previous 20 periods. And similarly, the lower line represents the lowest low over the previous 20 periods.
In the context of this trade example, we can see that there is a nice bearish price move that occurred on the chart. As such, if we were able to catch a short entry into this trade, then we could have used the upper line of the Donchian channel, the resistance line, as our trailing stop mechanism.
The actual exit for a short trade would have been a close above the upper line of the Donchian channel. You can see the strong bullish candle at the far right of this price chart that signaled the Donchian trailing stop exit for this bearish trend move.
Keltner Channel Trailing Stop Loss Strategy
The Keltner channel is envelope based technical study that overlays the price of an instrument on the chart. The indicator has three lines within it. The upper channel line, the middle channel line, and the lower channel line. The indicator is based on a combination of the exponential moving average, and the average true range.
Specifically, the middle line is defined as the 20 period Exponential moving average of price. The upper channel line is defined as the 20 period Exponential moving average of price plus 2X the average true range. And the lower channel line is defined as the 20 period Exponential moving average of price minus 2X the average true range.
Essentially, the Keltner channel is a 20 period Exponential moving average with the upper and lower bands being two times the average true range. When the market is in an uptrend, traders can utilize the middle or lower line within the Keltner channel as a potential trailing exit for their long position. Similarly when the market is in a downtrend, traders can use the middle or upper line of the Keltner channel as a potential trailing exit for their short position.
Using the middle line provides for a tighter trailing stop, while using the lower line within the context of an uptrend, or the upper line within the context of a downtrend provides for a looser trailing stop loss limit. Additionally, as for actually exiting the position, some traders require the condition that the price bar close beyond their preferred Keltner exit line, while others only require a touch of their preferred line.
Based on the testing that we’ve done, waiting for the price to close above the upper Keltner line in the case of a short trade, and waiting for the price to close below the lower Keltner line in the case of a long position, tends to offer the best combination from the risk to reward perspective.
Keltner Channel Trailing Stop Loss Example
Let’s now see what the Keltner channel trailing stop strategy looks like on the price chart. Below you can see the price action for the EURUSD currency pair shown on the one day timeframe.
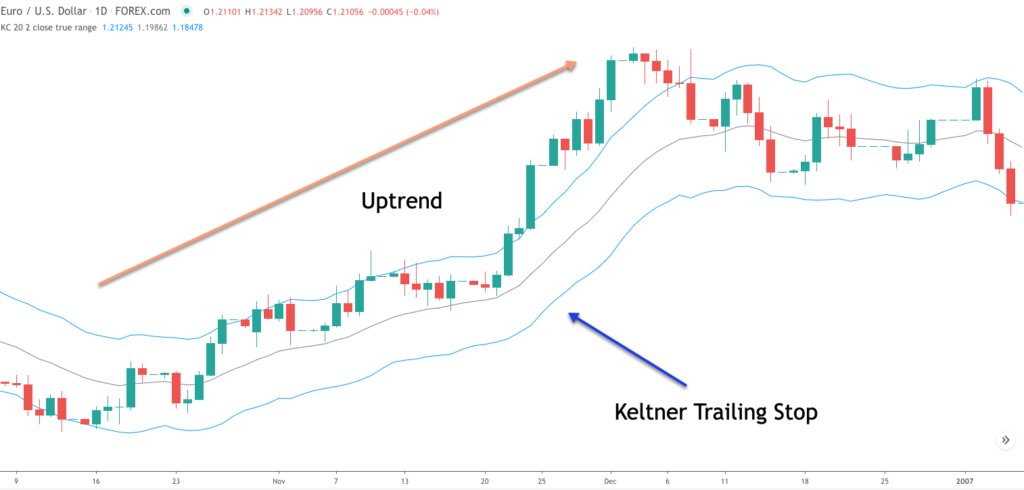
The Keltner channel consists of three lines, the middle line is the 20 period Exponential moving average line. The upper line is the 20 period EMA plus a 2X multiple of the average true range. The lower line is the 20 EMA minus a 2X multiple of the average true range.
In this example we can say that the market is displaying an uptrend. Assuming that we had a long position in this market we could use the Keltner trailing stop as our exit strategy. The first way would be to use the middle line as the exit mechanism. More specifically if the price crosses and closes below this middle line, that would be the signal to exit the trade.
Although this is a viable exit strategy, it will often take us out of a position prematurely. The preferred way to use the Keltner trailing stop is to use the lower line in the case of an uptrend. And the upper line in the case of a downtrend.
Since this example illustrates an uptrend, the preferred Keltner exit strategy would call for a price to cross and close below the lower line. This would be the actual signal to exit the short position. You can see at the far right of the price chart the bearish candle that breaches the lower Keltner line and closes below it.
Final Thoughts
We described four different trailing stop strategies that can be applied to any liquid financial instrument. Each of these exit strategies offers a mechanical method for managing open trade profits. Regardless of the trailing profit exit strategy that you choose to implement in your trading, it’s important to recognize the importance of reducing risk while trying to maximize profit on a winning position.
Often 80% of our trading profits will be realized on about 20% of our trades. As such, it’s imperative that we put ourselves in a position to take advantage of those big opportunities. A properly designed trailing stop strategy will help enable us to achieve these types of outsized gains that will subsidize our other losing trades.