Candlestick patterns are an essential component of price action analysis. Candlestick formations can provide high probability signals about a potential outcome on the price chart. Therefore, Forex traders should be aware of the various candlestick setups that can occur in the market. Today we will discuss one of these candlestick formations. This candlestick structure is called the Engulfing candlestick pattern. We will go through the functions of this chart figure and we will discuss a strategy for combining it with other forms of price action analysis.
What is the Japanese Engulfing Candlestick Pattern?
The Engulfing candlestick pattern is formed by two candles (two periods). For this reason, it falls in the category of double candlestick patterns.
The pattern has a pretty easy-to-recognize structure. It consists of a candle, which gets “engulfed” by the next candle on the chart. To get a valid Engulfing pattern, the first candle should completely fit inside the body of the next candle. See below, an illustration of an engulfing formation:
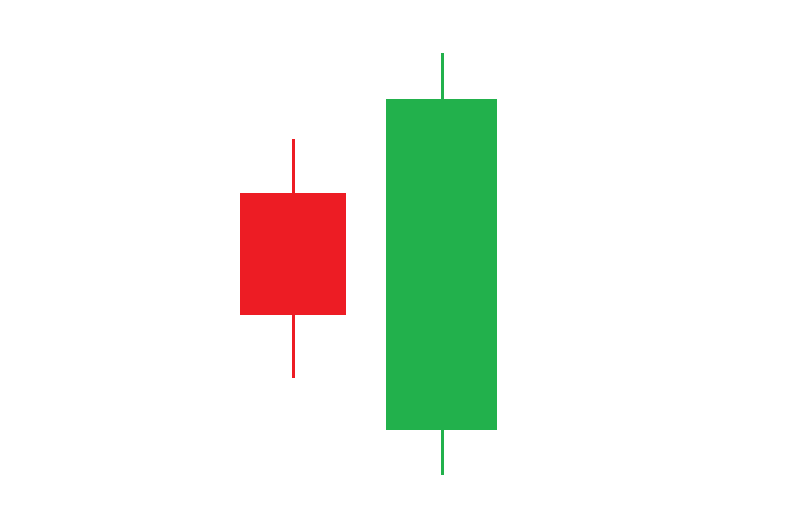
This is how the Engulfing pattern appears on the chart. Notice that the bearish candle is fully engulfed by the body of the next candle which is bullish. The opposite scenario is possible too. The engulfed candle could be bullish and the engulfing candle could be bearish.
Potential of the Engulfing Candlestick Setup
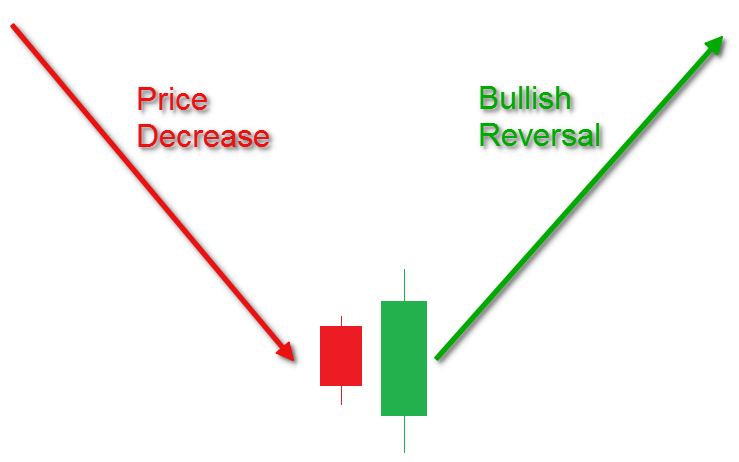
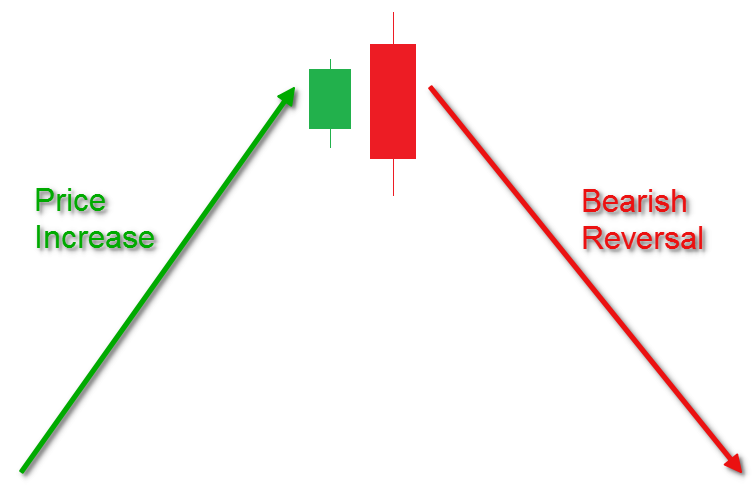
The Engulfing candlestick setup has a strong reversal character. If the price is increasing and an Engulfing pattern is created on the way up, this gives us a signal that a top might be forming now.
The opposite is in force too. If the price is decreasing and an Engulfing pattern appears on the chart, this suggests that the price action might be forming a bottom.
Types of Forex Engulfing Patterns
As you may have probably guessed, the Engulfing trading pattern has two variations depending on its potential. The first one is the bullish Engulfing pattern, and the other is the bearish Engulfing pattern. Let’s now go through each of these two Engulfing types:
Bullish Engulfing
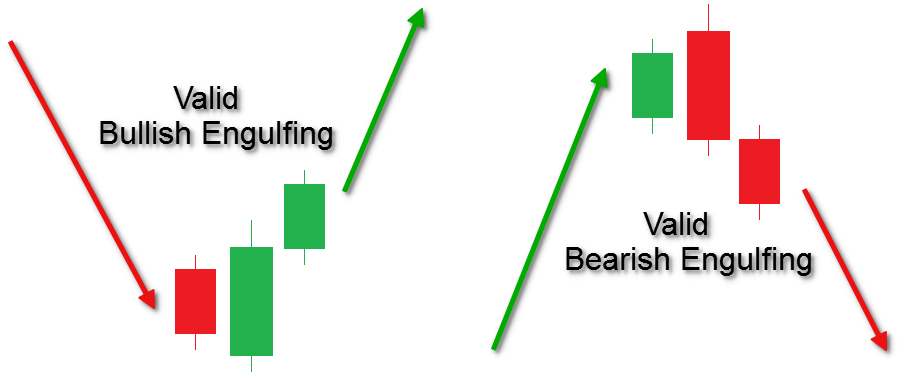
The bullish Engulfing pattern could be found during bearish trends. It starts with a bearish candle on the chart. Then this candle gets fully engulfed by the body of the next candle on the chart, which is bullish. This pattern creates a bullish potential on the chart and it could reverse the current bearish trend. Take a look below at the sketch of the bullish Engulfing candle pattern:
Notice that the first candle of the pattern is bearish and it is fully contained by the body of the next candle, which is bullish. This creates the bullish Engulfing, which implies the trend reversal. A valid bullish Engulfing would be the beginning of a bullish move after a recent decrease.
Bearish Engulfing
The bearish Engulfing pattern has exactly the opposite functions compared to the bullish Engulfing. The bearish Engulfing formation on the chart could be found during bullish trends. The pattern starts with a bullish candle. This candle then gets fully contained by the body of the next candle, which is bearish. This pattern creates a strong potential for a price reversal on the chart. In this manner, the current bullish trend might turn into a new bearish movement on the chart. Now have a look below at the sketch of the bearish Engulfing pattern:
This time the engulfed candle is bullish and the Engulfing candle is bearish. The body of the second candle fully contains the first candle, which completes the shape of the bearish Engulfing pattern on the chart. A bearish Engulfing setup could indicate the beginning of a new bearish move on the chart.
Engulfing Trading Pattern Confirmation
The confirmation of the Engulfing pattern comes with the candle after the pattern. It needs to break the body level of the engulfing candle to confirm the validity of the pattern.
A valid bullish Engulfing pattern continues with a third candle (bullish), which breaks the body of the engulfing candle upwards. A valid bearish Engulfing pattern continues with a third candle (bearish), which breaks the body of the engulfing candle downwards. This is how the Engulfing confirmation appears on the chart:
See that this time we have added the confirmation candle after the pattern. When you see this candle behavior after an engulfing pattern, this will confirm its validity.
Engulfing Trading Strategy
We have gone in detail through the structure of the Engulfing formation. Let’s now discuss a trading strategy related to this chart pattern.
Engulfing Pattern Trade Entry
The opening of your trade comes with the confirmation of the Engulfing pattern. This is the third candle – the one that comes after the engulfing candle – and it is supposed to break the body of the engulfing candle in the direction of the expected move. When a candle closes beyond this level, we get the confirmation of the pattern and we can open the respective trade.
If the Engulfing scenario is bearish, the price breakout should be through the lower level of the engulfing candle’s body. In this manner, we should prepare for a short trade. If the Engulfing scenario is bullish, the price breakout should come through the upper level of the engulfing candle’s body. This means that we should react with a bullish trade.
Engulfing Pattern Stop Loss
You should always be in control of the risk you are taking. As such, your Engulfing trades should always be protected with a stop loss order. The stop will secure your bankroll and you will typically know the maximum you can lose on the trade. Analyzing your risk and reward before initiating any trade will help in deciding whether to take the trade or not.
The best place for a stop loss order in an Engulfing trade is beyond the Engulfing pattern extreme. This would mean that if the Engulfing setup is bullish, the Stop Loss order should be placed under the lower candlewick of the engulfing candle. If the Engulfing setup is bearish, then the Stop Loss order should be located above the upper candlewick of the engulfing candle.

Above you see a sketch which illustrates where you should place your stop loss when trading bullish and bearish Engulfing patterns. If the pattern fails to move in the desired direction causing the stop loss to be hit, it will prove the trade assumption wrong and act to protect your bankroll.
Engulfing Pattern Take Profit
A rule of thumb is that an Engulfing trade should be held for at least the price move equal to the size of the pattern. This means that the minimum you should pursue from an Engulfing pattern should equal the distance between the tips of the upper and the lower candlewick of the engulfing candle.
When this distance is fulfilled by the price action, you can either close the whole trade, or part of it. If you decide to keep a portion of the trade open, then you should carefully monitor price action for a potential exit opportunity. This includes support/resistance breakouts and trend or channel breakouts. Chart and candle patterns are also very important here. If you spot a chart/candle pattern which is contrary to your trade, you may want to close your position.
Engulfing Pattern and Price Action Strategy
Now let’s take our understanding of the Engulfing pattern and illustrate a price action based trading strategy. Have a look at the chart below:
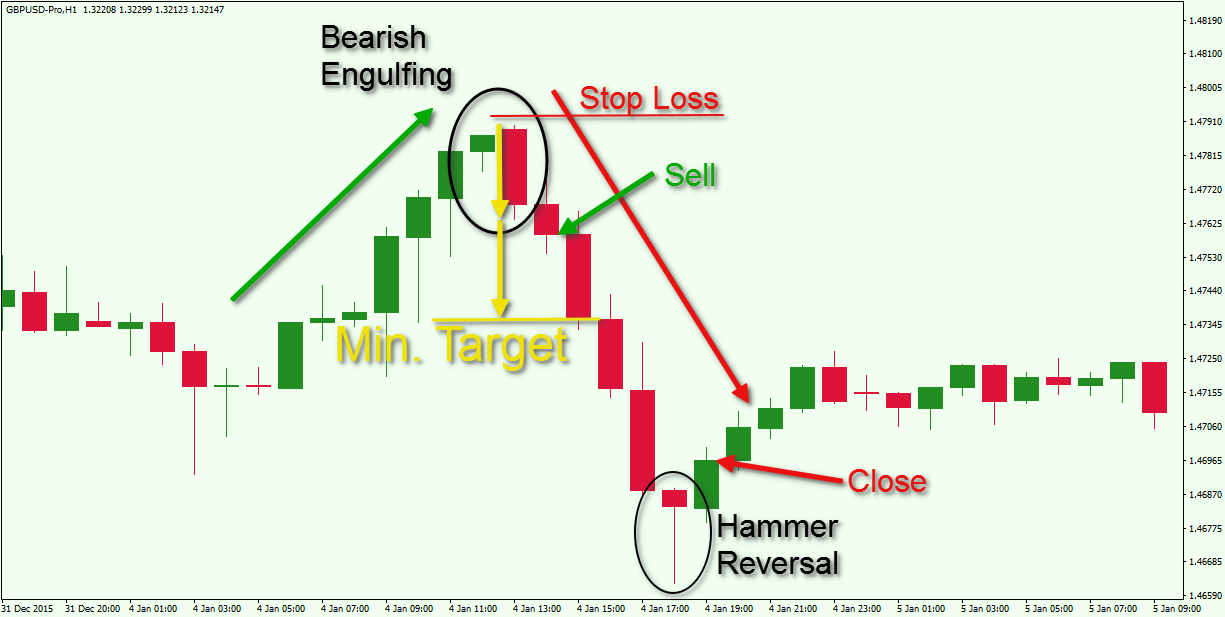
This is the hourly chart of the GBP/USD Forex pair for Jan 1 – Jan 5, 2016. The image depicts a bearish Engulfing pattern and some rules to trade it.
The chart starts with a price increase which we have marked with the green arrow on the image. You will notice that the price action creates only bullish candles. Suddenly, we see a relatively big bearish candle, which fully engulfs the previous candle. This confirms the presence of a bearish Engulfing pattern on the chart.
However, a confirmation candle needs to appear before we can consider taking a position in this case. The next candle on the chart is bearish again and closes below the body of the engulfing candle. This is the confirmation needed to take a trade based on this bearish Engulfing pattern. The stop loss order for this trade should be located above the upper wick of the engulfing candle as shown on the image.
The yellow arrows on the chart show the size of the pattern and how it should be applied as a minimum target on the chart. This target gets completed with the next candle, which appears after the Engulfing confirmation.
This trade could be extended for further gains. You can use price action rules to attain a final exit signal on the chart. You will note that the price of the GBP/USD creates another two big bearish candles on the chart. This would have doubled the gains on the trade. However, the next candle on the chart is a Hammer Reversal, also referred to as a Pin Bar. and it has a strong bullish potential. The trade should be closed out when confirmation of the Hammer pattern appears on the chart. As you see, the next candlestick is bullish and breaks the upper level of the Hammer pattern. This confirms the validity of the Hammer Reversal, which creates an exit signal for the short position. The bearish Engulfing trade should be liquidated at the close of the bullish candle which appears after the Hammer. This is shown with the second red arrow on the chart.
This example shows how price action rules could assist in finding the most opportune exit point on the chart.
Engulfing Patterns at Support and Resistance
Another effective way to trade the Engulfing pattern with price action is by spotting the pattern at key support and resistance levels.
If the price action approaches a resistance area and at the same time a bearish Engulfing pattern appears around that zone, this creates a very strong bearish potential on the chart. The same is in force in the opposite direction. If the price action approaches a support level and at the same time a bullish Engulfing pattern appears on the chart, this creates a very strong bullish potential.
These occurrences offer a high probability of success on the trade. Many times, when you spot this technical confluence and enter at the right moment, you can get in early on an emerging trend reversal. Let’s now see how combining Engulfing patterns with support and resistance levels work:
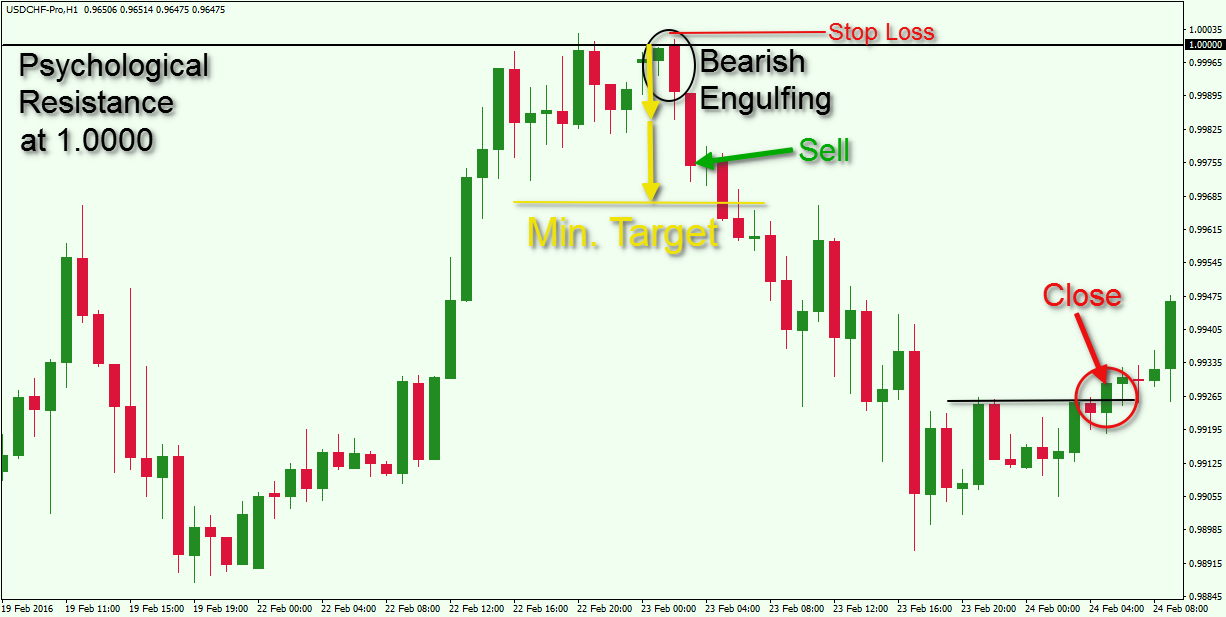
You are looking at the hourly chart of the USD/CHF for Feb 19 – 24, 2016. The image shows another bearish Engulfing trade, which takes place after price interaction with a psychological resistance level.
The black horizontal line on the image is the very strong psychological resistance of the Swissy at the parity rate of 1.0000 Swiss Franc for 1 Dollar. After a strong price increase, the USD/CHF meets this resistance level and tests it two more times afterwards. The third time the price tests the resistance, it creates a relatively big bearish candle, which engulfs the previous bullish candle. This creates a bearish Engulfing pattern on the chart.
The confirmation of the bearish Engulfing comes with the next candle, which is bearish and breaks the lower level of the engulfing candle’s body. The closing of the confirmation candle provides the short entry signal.
A stop loss should be placed above the upper candlewick of the engulfing bar. This is the level right above 1.0000.
The price starts drop afterwards. A couple of periods later, the minimum target of the pattern is reached (yellow arrows). You could close a portion of the position here, and keep a portion open in anticipation of a further decrease in price.
Notice that on the way down the USD/CHF pair continues with lower highs and lower lows, which provides for confidence in the downtrend. Suddenly, the price action starts a sideways movement and we mark the upper level of the range with the thin black horizontal line on the chart. The trade should be closed as soon as the price action breaks this resistance and closes a candle above. As you see, this creates a higher top on the chart, which implies that the bearish run might be interrupted.
Combining Support and Resistance with the Engulfing pattern is an excellent price action based trading method.
Conclusion
- The Engulfing Candlestick pattern is a double candle formation.
- It is a two-candle formation wherein the second candle fully engulfs the previous candle including the wicks.
- The Engulfing candlestick pattern has a reversal potential on the chart. In this manner, we recognize two types of Engulfing candle patterns:
- Bearish Engulfing: It could be found at the end of bullish trends. It starts with a bullish candle and then a bigger bearish candle, whose body fully engulfs the first candle of the pattern. This creates bearish (reversal) potential on the chart.
- Bullish Engulfing: It could be found at the end of bearish trends. It starts with a bearish candle and then a bigger bullish candle, whose body fully engulfs the first candle of the pattern. This creates a bullish (reversal) potential on the chart.
- The confirmation of the Engulfing pattern comes with the next candle on the chart:
- If the Engulfing is bullish, the next candle should be bullish and it should close above the upper level of the engulfing candle’s body.
- If the Engulfing is bearish, the next candle should be bearish and it should close below the lower level of the engulfing candle’s body.
- There are the three basic Engulfing trading rules:
- Open a trade when the price closes at the confirmation candle.
- Place a stop loss order beyond the opposite side of the Engulfing formation.
- Stay in the trade for a minimum price move equal to the size of the Engulfing pattern, or use price action rules to extend the duration of the trade.
- A high probability price action approach for trading bullish and bearish Engulfing patterns is to look for the pattern to appear at important support and resistance levels.