Knowing when to enter the market is one of the most important skills in Forex trading. We should aim to hop into emerging trends as early as possible in order to catch the maximum price swing. One of the best ways to do this is by predicting potential reversals on the chart. In this lesson, we will discuss some of the top Forex reversal patterns that every trader should know.
What are Forex Reversal Patterns
Chart patterns can represent a specific attitude of the market participants towards a currency pair. For example, if major market players believe a level will hold and act to protect that level, we are likely to see a price reversal at that level.
Forex reversal patterns are on chart formations which help in forecasting high probability reversal zones. These could be in the form of a single candle, or a group of candles lined up in a specific shape, or they could be a large structural classical chart pattern.
Each of these chart formations has a specific reversal potential, which is used by experienced traders to gain an early edge by entering into the new emerging market direction.
Types of Reversal Chart Patterns
There are basic two types of trend reversal patterns; the bearish reversal pattern and the bullish reversal pattern.
The Bullish reversal pattern forecasts that the current bearish move will be reversed into a bullish direction.
The bearish reversal pattern forecasts that the current bullish move will be reversed into a bearish direction.
Top Candlestick Reversal Patterns
We will start with four of the most popular and effective candlestick reversal patterns that every trader should know.
Doji Candlestick Pattern
The Doji candle is one of the most popular candlestick reversal patterns and it’s structure is very easy to recognize. First, the Doji is a single candle pattern. The Doji candle is created when the opening and the closing price during a period are the same. In this manner, the Doji candle has no body and it looks like a cross. The Doji can appear after a prolonged price move, or in some cases when the market is very quiet and there is no volatility. In either case, the Doji candle will close wherever it has opened or very close to it.
The Doji candlestick is typically associated with indecision or exhaustion in the market. When it forms after a prolonged trend move, it can also provide a strong reversal potential. The candle represents the inability of the trend riders to keep pressuring the price in the same direction. The forces between the bears and the bulls begin to equalize and eventually reverse direction.
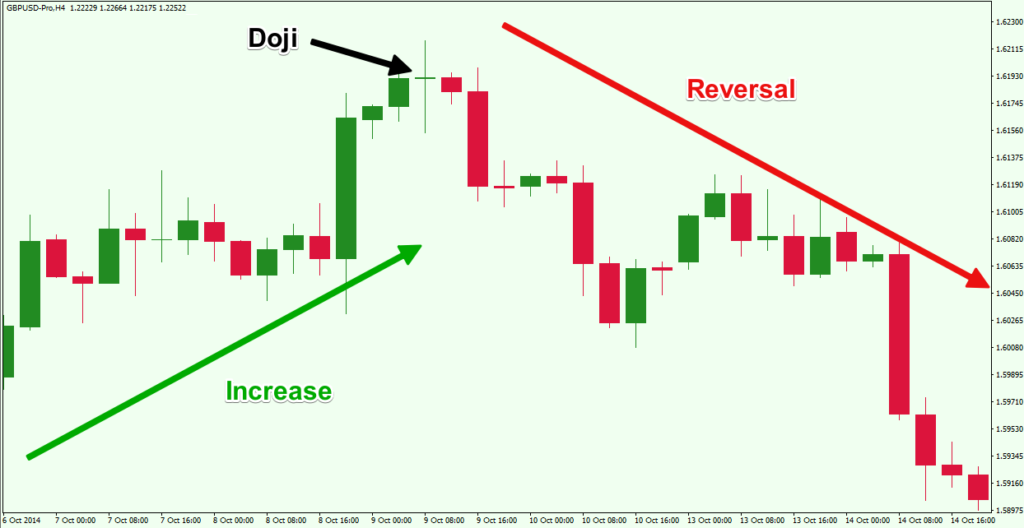
In the case above, you see the Doji candle acting as a bearish reversal signal. Notice that the price action leading to the Doji candle is bullish but the upside pressure begins to stall as evidenced by the Doji candle and the two candles just prior to the Doji candle. After the appearance of the Doji, the trend reverses and the price action starts a bearish decent.
Hammer / Shooting Star Candlestick Patterns
The Hammer candlestick pattern is another single candle which has a reversal function. This candle is known to have a very small body, a small or non-existent upper shadow, and a very long lower shadow. The Hammer pattern is only considered a valid reversal signal if the candle has appeared during a bearish trend:
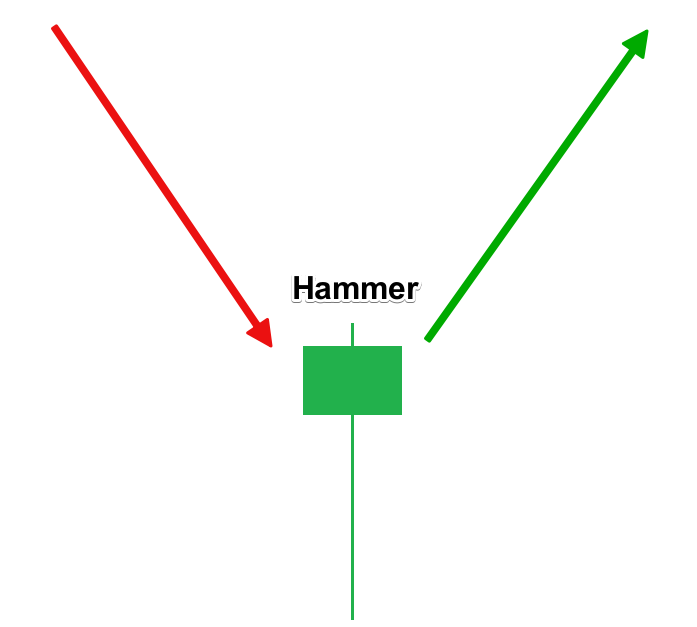
This sketch shows you the condition you should have in order to confirm a Hammer reversal. It should be noted that the hammer candle itself could be bullish or bearish and this wouldn’t change its function. There are four similar variations of the Hammer candle, depending on the trend and the candle’s structure:
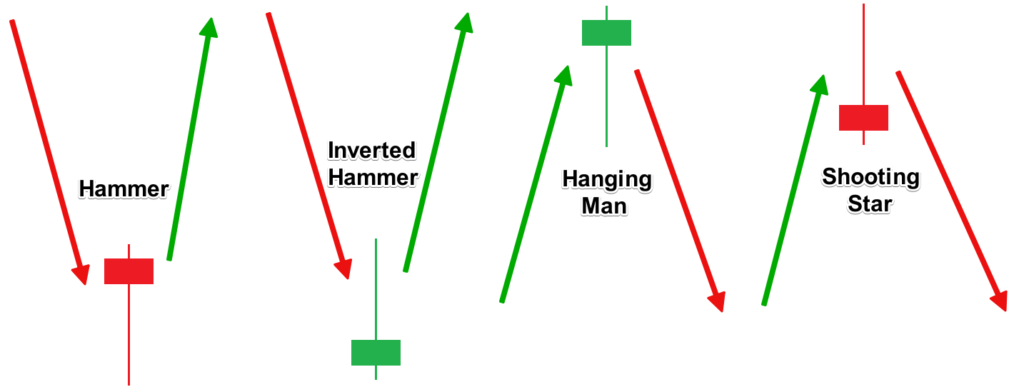
In the first two cases, you have a bearish trend, which reverses to a bullish price move. The difference between the two candles is that in the second case the long wick it positioned in the opposite direction and this formation is called an Inverted Hammer.
In the second two cases we have a bullish trend which turns into a bearish trend. If the long shadow is at the lower end, you have a Hanging Man.
If the long shadow is at the upper end, you have a Shooting Star. In all four cases it doesn’t matter whether the reversal candle is bullish or bearish. This doesn’t change its function.
Now let’s approach a Shooting Star example:
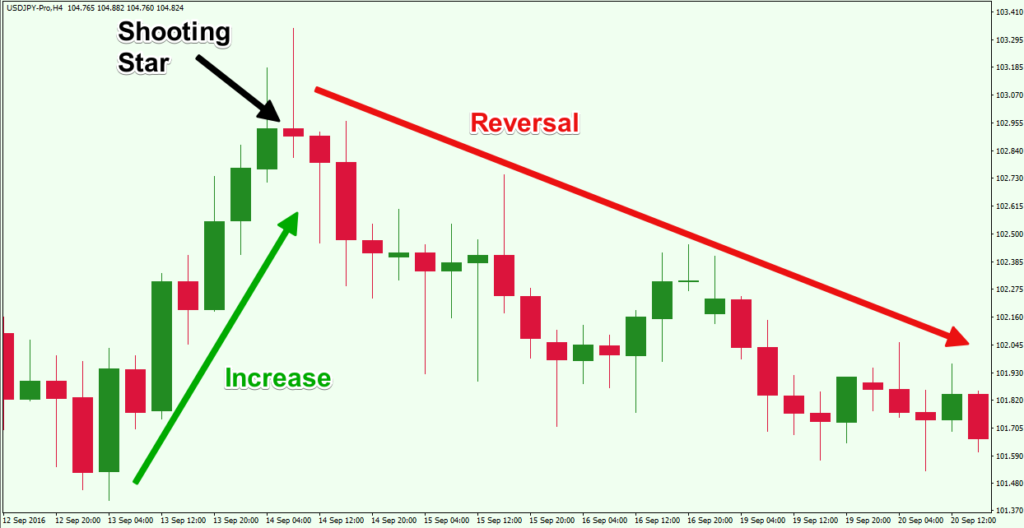
The chart above shows you a Shooting Star candle, which is part of the Hammer reversal family described earlier. The shooting star candle comes after a bullish trend and the long shadow is located at the upper end. The shooting star pattern would signal the reversal of an existing bullish trend.
Engulfing Candlestick Pattern
The next pattern we will discuss is the Engulfing pattern. Note that this is a double candle pattern. This means that the formation contains two candlesticks. The engulfing formation consists of an initial candle, which gets fully engulfed by the next immediate candle. This means that the body of the second candle should go above and below the body of the first candle.
There are two types of Engulfing patterns – bullish and bearish. The bullish Engulfing appears at the end of a bearish trend and it signals that the trend might get reversed to the upside. The first candle of the bullish Engulfing should be bearish. The second candle, the engulfing candle, should be bullish and it should fully contain the body of the first candle.
The characteristic of the bearish Engulfing pattern is exactly the opposite. It is located at the end of a bullish trend and it starts with a bullish candle, whose body gets fully engulfed by the next immediate bigger bearish candle.
Take a moment to check out this Engulfing reversal example below:
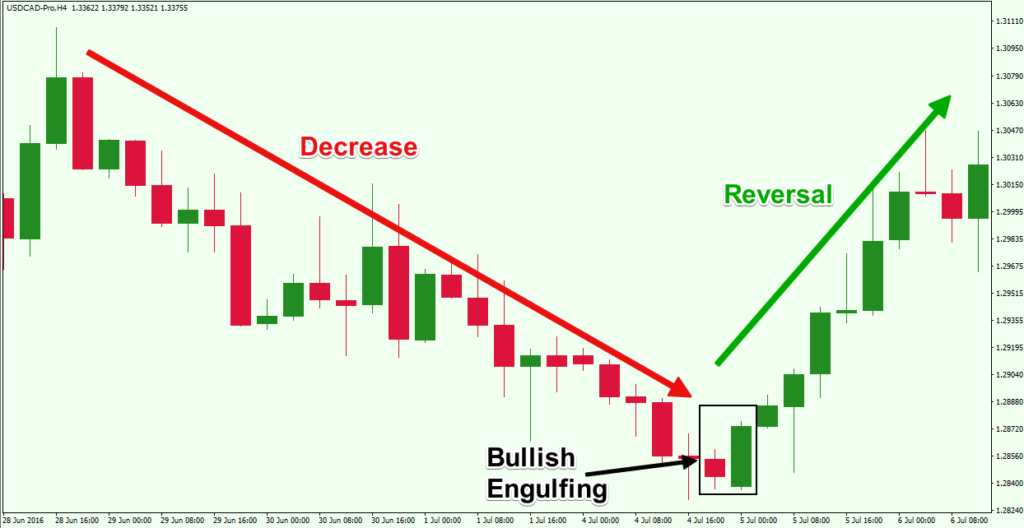
This chart shows you how the bullish Engulfing reversal pattern works. See that in our case the two shadows of the first candle are almost fully contained by the body of the second candle. This makes the pattern even stronger. We see on this chart that the price reverses and shoots up after the Bullish Engulfing setup.
Trading Rules for Reversal Candle Formations
To trade reversing candles, you should remember a few simple rules regarding trade entry, stop loss placement, and take profit. We will go this in the following section:
Trade Entry
The confirmation of every reversal candle pattern we have discussed comes from the candle which appears next, after the formation. It should be in the direction we forecast. After this candle is finished, you can enter a trade.
In the Bullish Engulfing example above, the confirmation comes with the smaller bullish candle, which appears after the pattern. You can enter a long trade at the moment this candle is finished. This would be the more conservative approach and provide the best confirmation. Aggressive traders may consider entering a trade when the high of the prior bar is taken out (in case of a bullish reversal pattern) or when the low of the prior bar is taken out (in case of a bearish reversal pattern).
Stop Loss
Never enter a candlestick reversal trade without a stop loss order. You should place a stop order just beyond the recent swing level of the candle pattern you are trading. So, if you trade long, your stop should be below the lowest point of your pattern. If you are going short, then the stop should be above the highest point of the pattern. Remember, this rule takes into consideration the shadows of the candles as well.
Take Profit
The minimum price move you should aim for when trading a candle reversal formation is equal to the size of the actual pattern itself. Take the low and the high of the pattern (including the shadows) and apply this distance starting from the end of the pattern. This would be the minimum target that you should forecast. If after you reach that level, you may decide to stay in the trade for further profit and manage the trade using price action rules.
Top Reversal Chart Patterns
Now let’s switch gears and talk a bit about some classical chart patterns that have a reversal potential. Two of the most popular and effective among this class would include the Double Top / Double Bottom formation and the Head and Shoulder pattern.
Double Top and Double Bottom
We will start with the Double Top reversal chart pattern. The pattern consists of two tops on the price chart. These tops are either located on the same resistance level, or the second top is a bit lower. The double top pattern typically looks like the letter “M”.
The Double Top has its opposite, called the Double Bottom. This pattern consists of two bottoms, which are either located on the same support level, or the second bottom is a bit higher. The double bottom pattern typically looks like the letter “W”.
These patterns are known to reverse the price action in many cases. Let’s see the Double Top formation on a price chart:
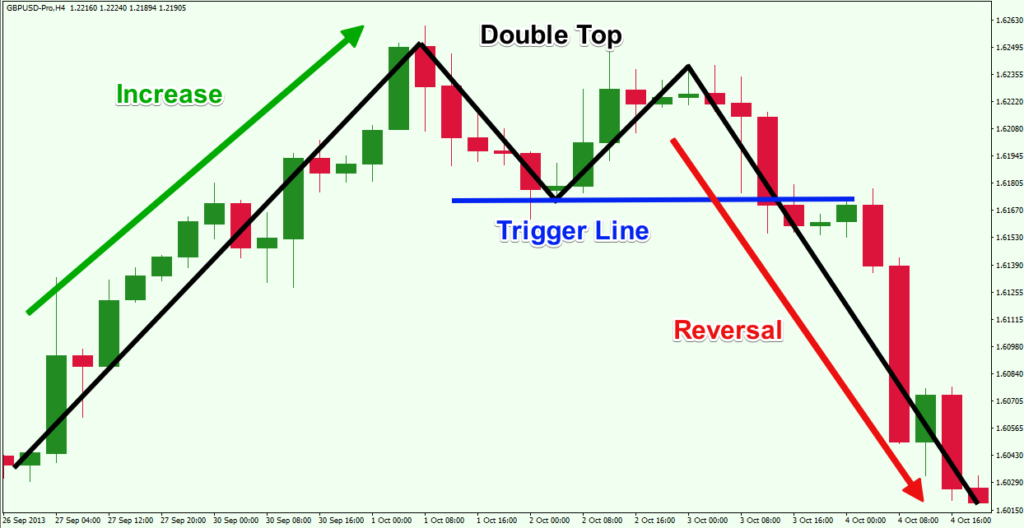
Notice we have a double top formation and that the second top is a bit lower than the fist top. This is a usual occurrence with a valid Double Top Pattern.
The confirmation of the Double Top reversal pattern comes at the moment when the price breaks the low between the two tops. This level is marked with the blue line on the chart and it is called a trigger or a signal line.
The stop loss order on a Double Top trade should be located right above the second top.
The Double Top minimum target equals the distance between the neck and the central line, which connects the two tops.
The Double Bottom looks and works absolutely the same way, but everything is upside down. Thus, the Double Bottom reverses bearish trends and should be traded in a bullish direction.
Head and Shoulders
The Head and Shoulders pattern is a very interesting and unique reversal figure. The shape of the pattern is aptly named because it actually resembles a head with two shoulders.
The pattern forms during a bullish trend and creates a top – the first shoulder. After a correction, the price action creates a higher top – the head. After another correction, the price creates a third top, which is lower than the head – the second shoulder. So we have two shoulders and a head in the middle.
Of course, the Head and Shoulders reversal pattern has its upside down equivalent, which turns bearish trends into bullish. This pattern is referred to as an Inverted Head and Shoulders pattern.
Now let me show you what the Head and Shoulders formation looks like on an actual chart:
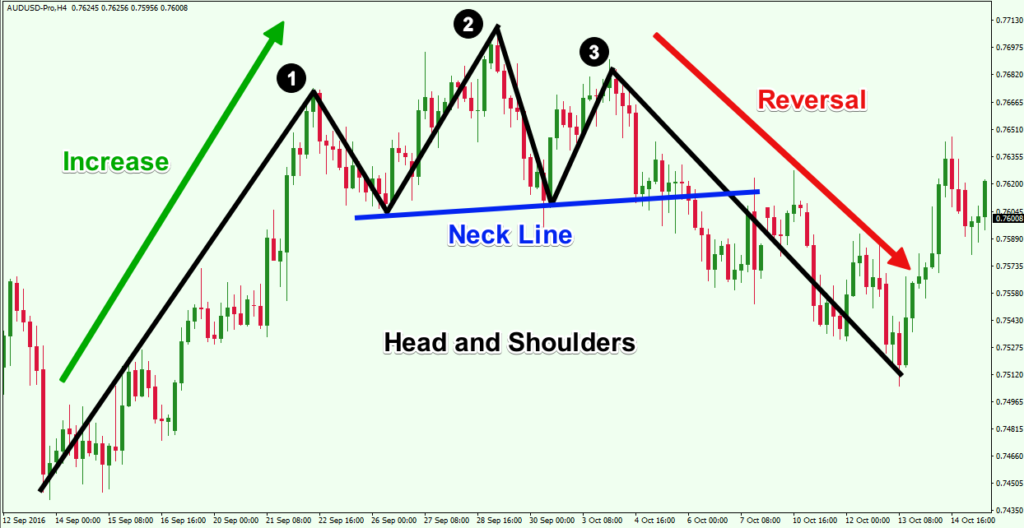
In the chart above we see price increasing just prior to the head and shoulders formation. This is an important characteristic of a valid head and shoulders pattern. The confirmation of the pattern comes when the price breaks the line, which goes through the two bottoms on either side of the head. This line is called a Neck Line and it is marked in blue on our chart. When the price breaks the Neck Line, you get a reversal trading signal. This is when you would want to initiate a trade to the short side.
You should put your stop loss order above the last shoulder of the pattern – the right shoulder. Then you would trade for a minimum price move equal to the distance between the top of the head and the Neck Line.
The Inverted Head and Shoulders pattern is the upside down version of the Head and Shoulders. The pattern comes after a bearish trend, creates the three bottoms as with a Head and Shoulders and reverses the trend. It should be traded in the bullish direction.
Forex Reversal Strategy
When using a reversal trading system, it is always a good idea to wait for the pattern to be confirmed. I will present some confirmation ideas for you to apply when trading trend reversals in Forex. In the following chart example, I will illustrate five reversal trades for you.
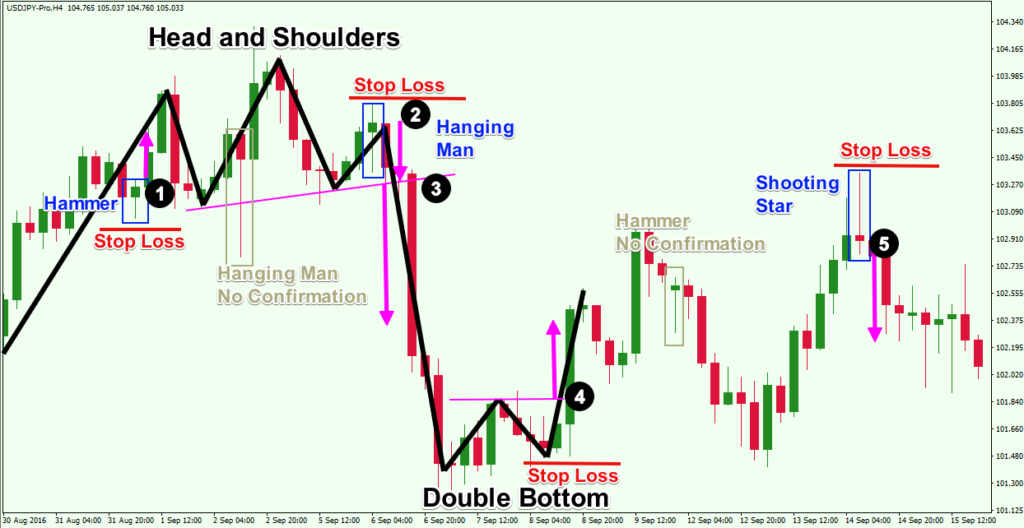
The image above is the H4 chart of the USD/JPY Forex pair for Sep, 2016. The chart shows 5 potential trades based on a reversal trading strategy using candlestick and chart patterns. Each of the trades is marked with a black number at the opening of the trade.
The first trade comes when we get a small Hammer candle, which gets confirmed by a bullish candle afterwards. Note that after the confirmation candle, price quickly completes the minimum target of the pattern.
Then we see a big Hanging Man candle (because it comes after an increase), but the following candle is bullish, which provides no reversal confirmation. Therefore, this pattern should be ignored.
Soon the price action creates a Head and Shoulders pattern. At the top of the last shoulder we see another Hanging Man pattern, which this time gets confirmed and completed. This is another nice trading opportunity. The stop loss order should be located above the top of the upper shadow of the Hanging Man.
This trade could actually be extended by the confirmation of the big Head and Shoulders pattern. Simply hold the Hanging Man trade with the same stop loss order until the price action moves to a distance equal to the size of the Head and Shoulders structure as calculated by the measured move. You can close the trade after the target is completed at the end of the big magenta arrow.
The price then consolidates and creates a Double Bottom pattern – another wonderful trading opportunity. You can buy the USD/JPY when the price breaks the magenta horizontal trigger line. Your stop should be located below the second bottom of the pattern as shown on the image. You hold the trade until the size of the pattern is completed.
The price action reverses afterwards and starts a bearish move. On the way down we see a Hammer candle in the gray rectangle. However, the next candle after the Hammer is bearish, which does not confirm the validity of the pattern. For this reason, this Hammer candle should be ignored.
The next trading opportunity comes after an upward price swing. In the last blue rectangle you see a Shooting Star candle pattern with a very big upper shadow. This increases the reliability of the pattern. You could open a short trade when the next bearish candle completes to confirm the shooting star pattern, or if you want a more aggressive entry, you could have entered short when the low of the shooting star candle was taken out. The stop loss order should be placed above the upper shadow of the candle. Then you would want to hold the trade for at least the minimum price move equal to the size of the Shooting Star.
Conclusion
- Forex reversal patterns are on chart candlestick formations of one or more candles or bigger chart patterns which forecast price reversals.
- Every chart pattern has a mass sentiment component that can help a trader in gauging potential price swings.
- There are two types of reversal chart patterns:
- Bullish Reversal Chart Patterns – reverse the bearish move and starts a bullish move
- Bearish Reversal Chart Patterns – reverse the bullish move and starts a bearish move
- The top candlestick reversal patterns are:
- Doji – The price closes wherever it has opened and creates a candle with no body.
- Hammer – It has a small body, one big shadow and another small shadow. There are four variations of the Hammer candle depending on the previous trend and the position of the candle.
- Engulfing – It consists of two candles – a small candle and another candle, whose body fully engulfs the body of the first candle. There is a bullish and a bearish Engulfing.
- The top reversal chart patterns are:
- Double Top – The price creates two tops on approximately the same resistance level. The price is likely to start a bearish move afterwards. The opposite equivalent of this pattern is the Double Bottom.
- Head and Shoulders – The price creates a top, a higher top, and a lower top afterwards. The price is likely to start a bearish move afterwards. The opposite equivalent of this pattern is the Inverted Head and Shoulders.
- When using a Forex reversal strategy you would want to open a trade when you get a pattern confirmation and to hold for at least the minimum price projection based on the structure of the pattern.