The Price Rate of Change is a technical indicator that helps measure the velocity of price movements. And thus, it is essentially a momentum based indicator. ROC is included within most charting platforms these days. Thus, traders will be able to access it within their platform’s library of technical indicators. We will outline some of the most important characteristics of the ROC indicator, and provide insights into applying it in the correct manner.
Rate of Change Technical Indicator
The Rate of Change indicator, also commonly referred to as ROC, is a momentum based technical indicator. It moves up and down around the zero line depending on the strength of the recent momentum. When the upward momentum behind the price action is strong, the ROC indicator line will move higher above the zero line. As the downward momentum behind the price action is strong, the ROC indicator line will move lower below the zero line. When the price action is trading sideways, then the ROC indicator line will often whipsaw around the zero line.
Below you can see a price chart with the ROC indicator plotted in the lower pane.
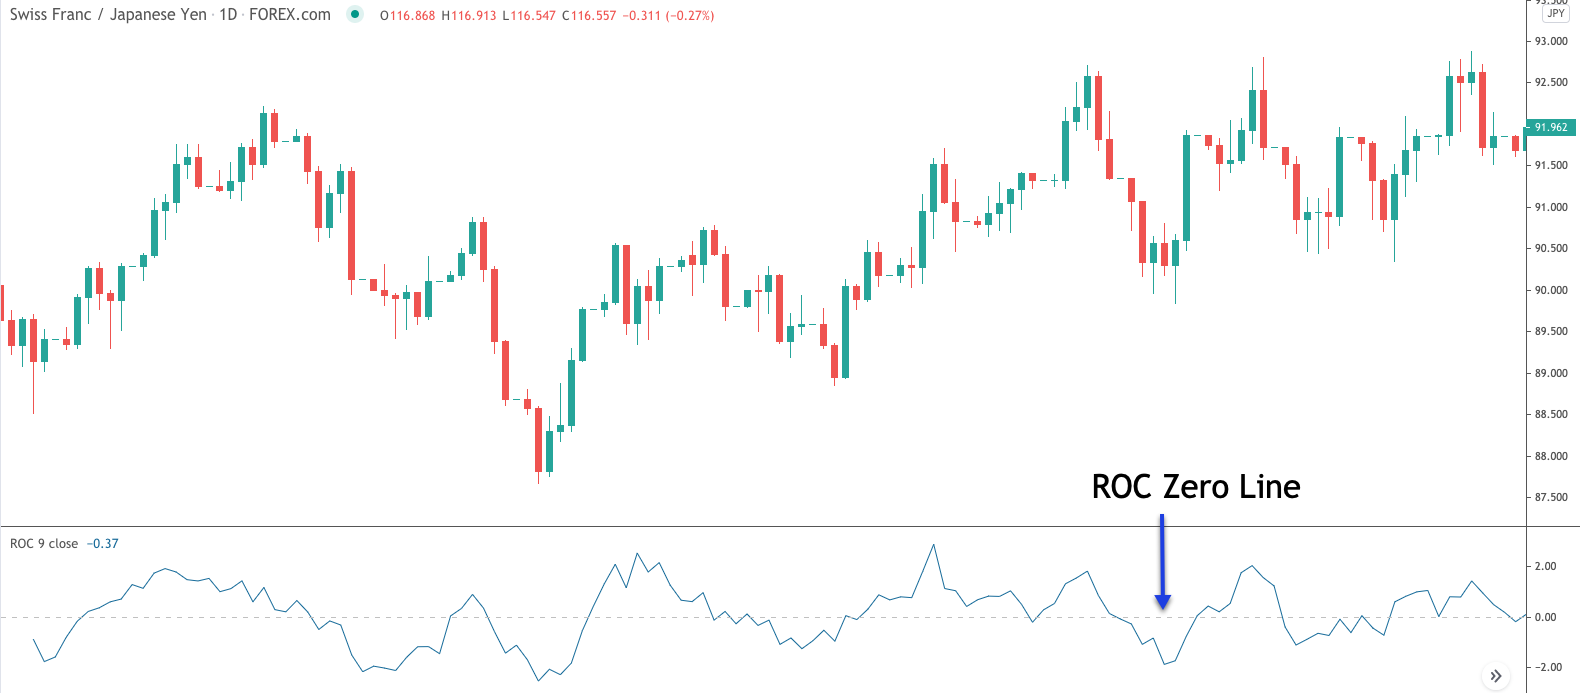
Although the ROC indicator is considered a technical oscillator, it’s important to note that it is not restricted by any upper or lower bounds like some other momentum based oscillators such as Stochastics, or Williams %R. It is calculated by comparing the current closing price with the closing price N periods ago. And so, it measures the Rate of Change in price for a specified look back period. Although simple in its construction, the ROC indicator can be quite powerful in gauging the underlying price action on the chart.
Trend following traders can utilize the ROC as an entry timing tool to enter into an emerging trend. One way to do this, is to wait for a confirmation of the price to cross above the zero line in the case of a long signal, or the cross below the zero line in the case of a short signal.
Likewise, contrarian traders can utilize the ROC for timing countertrend set ups using overbought and oversold readings, along with divergence signals.
ROC Indicator Formula
Let’s now look at the exact formula for calculating the ROC indicator.
ROC = [Current Closing Price – Closing Price N periods ago) / Closing Price N periods ago] x 100
The above formula is fairly straightforward to understand. The primary input within the ROC formula is the end value. Remember the end value represents the look back period. The default ROC indicator setting for the N value is nine. This is the period that most shorter-term traders and swing traders will want to use. Position traders will often adjust the setting higher to align with their longer-term trading horizon.
Here’s an example of the ROC calculation based on the following assumptions.
- Instrument – Stock XYZ
- Current Closing Price: 50
- Closing Price N periods ago: 40
- N period: 9 ( days )
Here’s the formula once again that we will need to input the variables above.
ROC = [Current Closing Price – Closing Price N periods ago) / Closing Price N periods ago] x 100
ROC = [50 – 40) / 40] x 100
ROC = 25
As such, the ROC line would be plotted at the 25 level, which is above the zero line indicating bullish momentum.
What about another example, this time using the EURUSD currency pair.
- Instrument – EURUSD
- Current Closing Price – 1.3500
- Closing Price N periods ago – 1.2000
- N period – 14 ( days )
Here’s the formula once again that we will need to input the variables above.
ROC = [Current Closing Price – Closing Price N periods ago) / Closing Price N periods ago] x 100
ROC = [1.3500 – 1.2000) / 1.2000] x 100
ROC = 12.50
As such, the ROC line would be plotted at the 12.50 level, which is above the zero line indicating bullish momentum.
Some technical analysts will recognize the similarity between this Price Rate of Change indicator and the Momentum indicator. Although both are very similar, there is a key difference between them.
More specifically, the ROC oscillator will divide the difference in the current closing price and the closing price N periods ago, by the closing price N periods ago.
In contrast to this, the momentum indicator simply takes the difference in the closing prices and multiplies it by 100. Regardless, both the ROC indicator, and the Momentum indicator will provide the same information for the most part.
Rate of Change Indicator Strategy
As we have learned, the ROC indicator is a momentum study that will register a positive reading above zero, as prices are increasing. Similarly, it will register a negative reading below zero, as prices are decreasing.
Some of the more common uses for the Rate of Change in technical analysis include locating overbought and oversold market conditions, as well as confirming a breakout or continuation of a trend move.
Let’s look at an example of the ROC indicator strategy used as a range breakout confirmation filter.
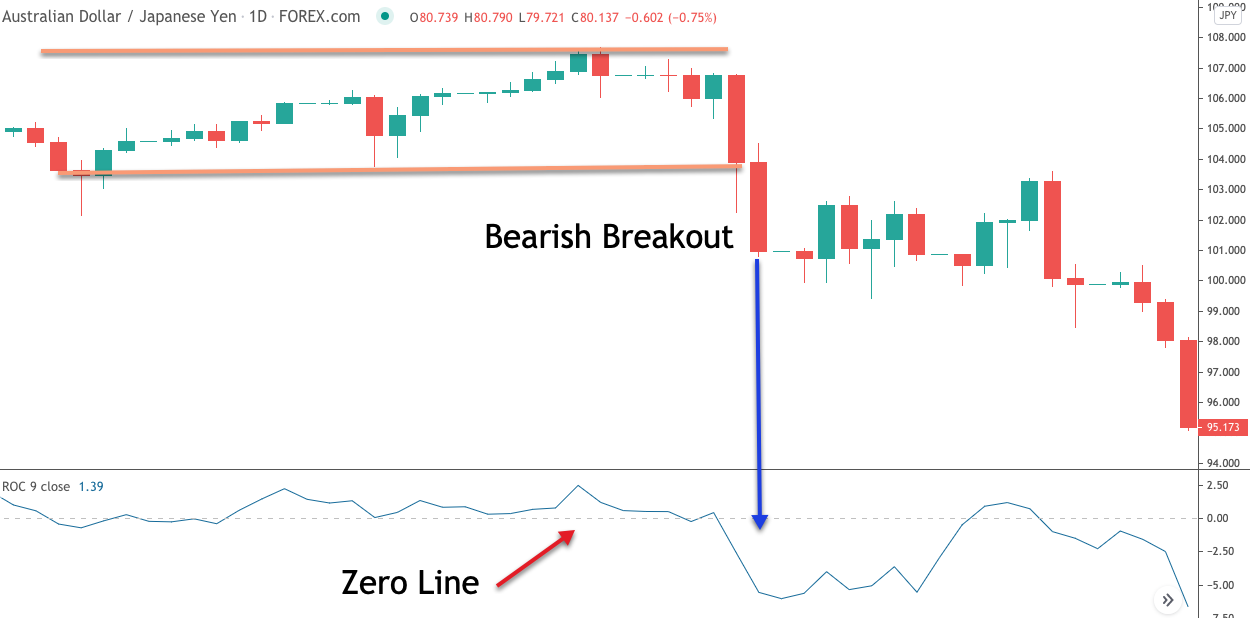
We can see that there was a tight consolidation range that had formed within the price action. Notice the upper line representing the resistance level within the range, and the lower line representing the support level within the range. Soon after moving lower from the resistance level, the price attempted to test the lower support line once again, but this time the support level was breached, and a breakout occurred to the downside.
Notice how the ROC indicator as shown in the lower pane was plotting just above the zero line during the entire consolidation range. But it registered a lower reading, below zero upon the bearish breakout from the consolidation range.
Now let’s look at an example of the ROC oscillator as a divergence signal.
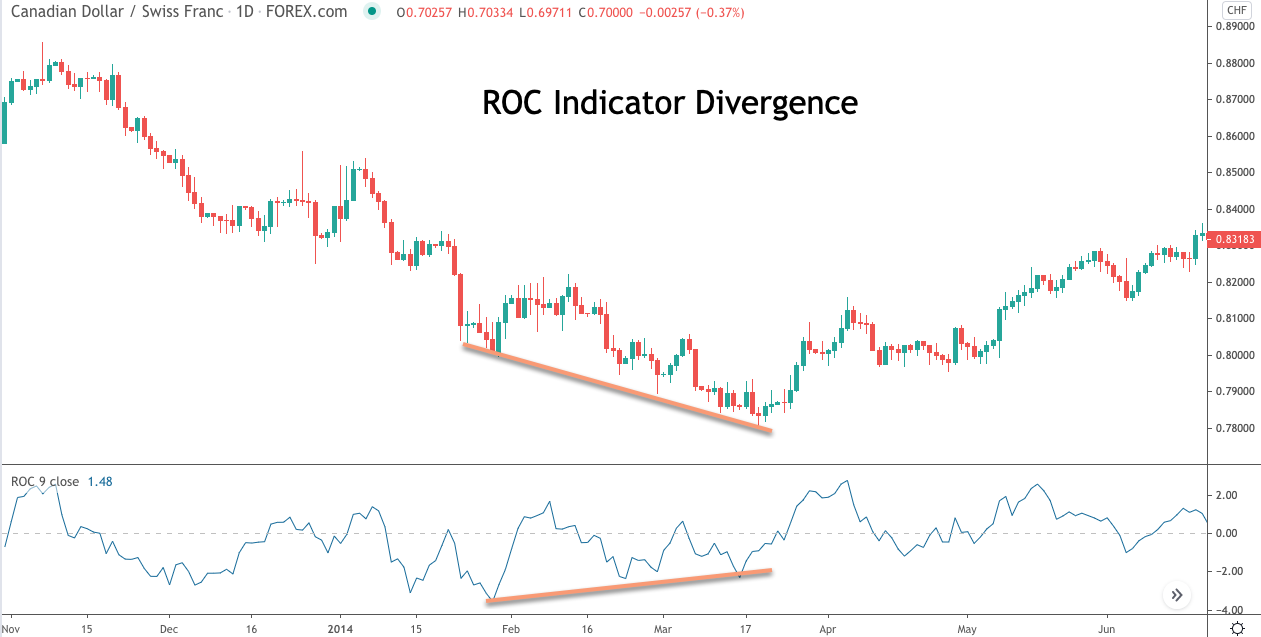
A regular divergence is a powerful reversal signal that is often seen at the end of a prolonged price trend. More specifically a bullish divergence occurs when the price makes a lower low, while a momentum oscillator, in this case, the ROC indicator, makes a higher high. Similarly a bearish divergence occurs when the price makes a higher high, while a momentum oscillator such as the ROC indicator, makes a lower high.
Notice on the image above, the price action is making a lower low after a prolonged downtrend, while the ROC indicator is making a higher high. As such, this would be considered a bullish ROC divergence signal. The expectation would be for prices to rise, moving in the direction of the rising ROC indicator reading. We can clearly see that following the ROC indicator divergence, prices began to reverse the downtrend and move higher.
We can also use the Rate of Change analysis to spot overbought and oversold conditions. Below you can see an example of this.
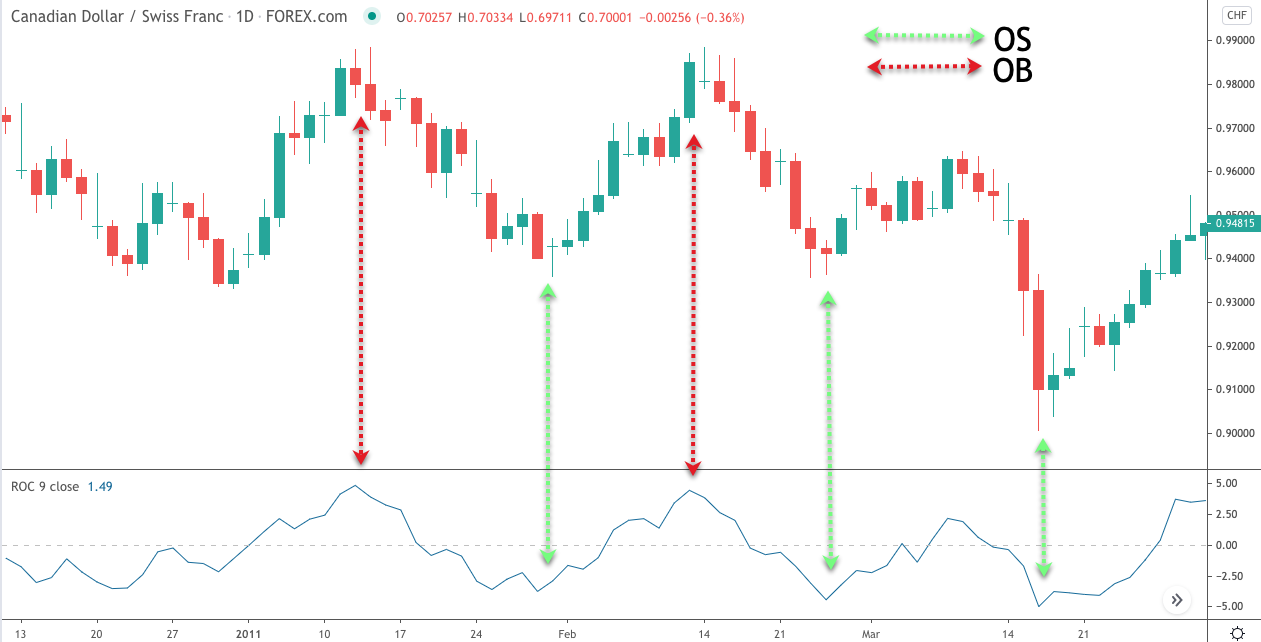
Another practical application of the Price ROC indicator is its ability to provide countertrend signals based on extended price moves. Notice on the chart above, the red arrows represent levels wherein the ROC indicator can be considered to be in overbought territory, and how prices selloff with these relatively high ROC readings.
Along the same lines, you will note the green arrows which represent levels wherein the ROC indicator can be considered to be in oversold territory, and how prices rebound from those relatively oversold levels.
There are several ways that traders can incorporate the ROC indicator into their trading strategy. We’ve outlined a few of the more popular methods for using the indicator. Depending on whether your style of trading is more trend based or mean reversion based, you will likely prefer one type of signal over another.
Rate of Change Trading Strategy
We’ll now detail a trading strategy based on the ROC indicator. This strategy will be a countertrend strategy that seeks to find potential reversal points within the context of a trend. More specifically, we will attempt to take a long position at or near the terminal point of a downtrend. Similarly we will attempt to take a short position at or near the terminal point of an uptrend.
To help us in isolating a high probability reversal point, we will use a divergence based strategy. The ROC indicator will be incorporated in order to identify a bullish divergence in the context of a downtrend, and to identify a bearish divergence in the context of an uptrend.
So here are the trading rules for the long trade set up using this ROC divergence strategy.
- A bullish divergence pattern must be present on the price chart.
- The price action leading to the divergence pattern must display a clear bearish trend.
- Enter a buy order upon the cross above the ROC zero line threshold from below.
- Place a stop loss below the most recent swing low preceding the buy entry.
- The target will be based on the 50% Fibonacci retracement of the prior downtrend, measured from the most significant swing high to swing low point within that downtrend.
And here are the trading rules for the short trade set up using this ROC divergence strategy.
- A bearish divergence pattern must be present on the price chart.
- The price action leading to the divergence pattern must display a clear bullish trend.
- Enter a sell order upon the cross below the ROC zero line threshold from above.
- Place a stop loss above the most recent swing high preceding the sell entry.
- The target will be based on the 50% Fibonacci retracement of the prior uptrend, measured from the most significant swing low to swing high point within that uptrend.
This ROC strategy incorporates a few key concepts within it. Firstly, we are looking for a countertrend opportunity following an extended price move. The divergence set up provides us evidence that the market is waning, and thus, is poised for a reversal.
The zero line cross confirms that the momentum behind the price action is increasing in the direction of the reversal. And finally, our exit, which is based on a 50% Fibonacci retracement, provides us a high probability level at which to take profits on the countertrend trade set up.
Rate of Change Trading Example 1
We’ll start off by illustrating the bullish variation of this strategy. On the chart below you will find the Canadian Dollar to Swiss Franc currency pair based on the daily timeframe. We have presented this chart in an earlier example, but this time we have expanded the view to better illustrate this specific trade set up.
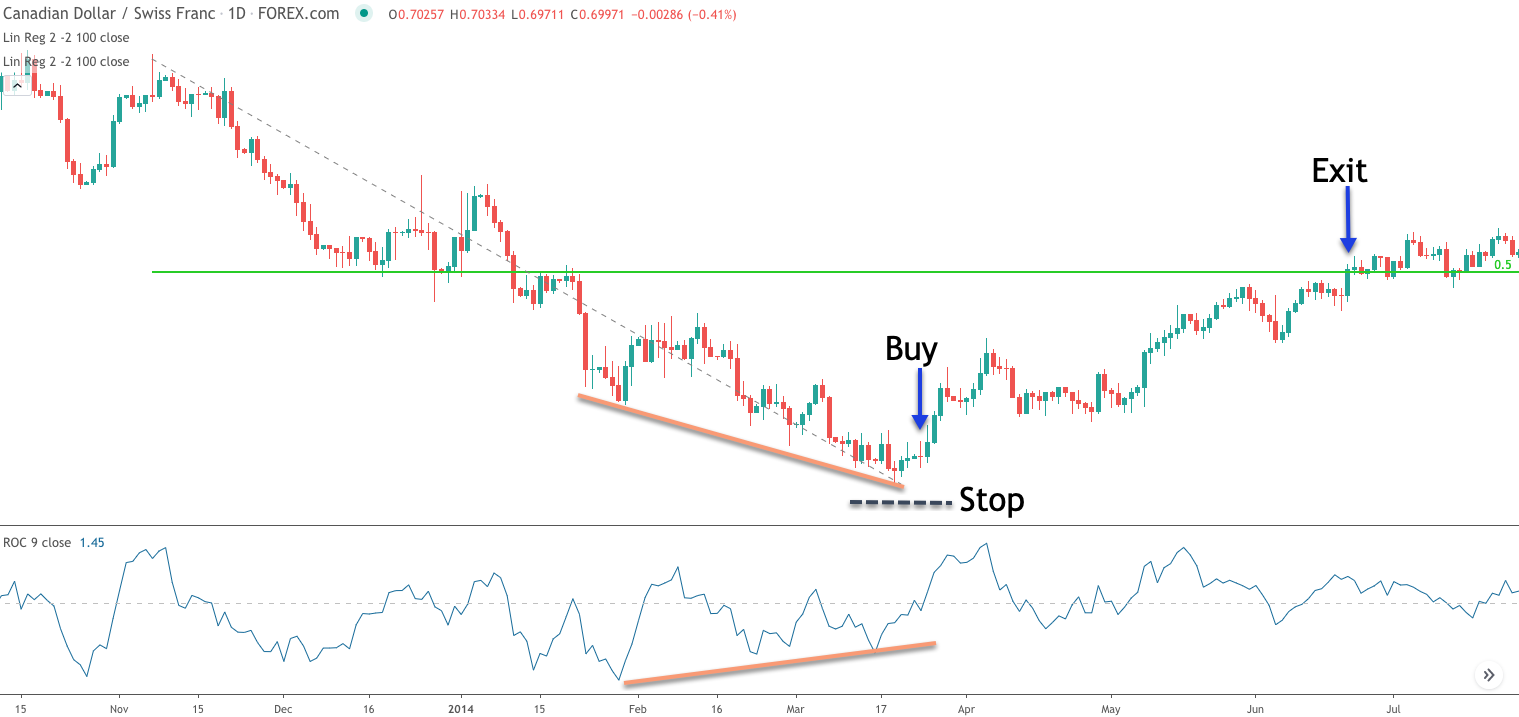
The very first condition that needs to be met for this ROC forex strategy is for a bullish divergence pattern to be present on the price chart. Remember, a bullish divergence occurs when the price is making lower lows, while the ROC indicator is making higher highs. As we can clearly see from the sloping orange lines plotted on both the price action and the ROC indicator, a bullish divergence formation is present.
Now we must confirm that the price action leading to the divergence pattern was exhibiting a downward trend. Again, looking at the price movement preceding the divergence formation, it’s quite clear that a strong downtrend was in place.
We can now prepare for a potential buy signal to go long. The buy entry order would occur upon the upward cross of the ROC zero line. You can see where this event occurred by referring to the blue arrow noted as, Buy. The stop was would be placed below the most recent swing low preceding the long entry. The target would be set at a level that represents the 50% retracement of the prior downtrend. You can see the green horizontal line plotted which represents this exit level.
As soon as the long position was executed, the price began to increase and move towards the 50% fib retracement level. After several months of steadily rising price movement, the currency pair eventually reach this level, and we would have exited the position with a nice profit.
ROC Trading Strategy Example 2
Will now show what the bearish variety of this ROC trading strategy appears like. Below you will find the Swiss franc to Japanese Yen for X pair shown on the daily timeframe.

If you refer to the upper section of this price chart, you will notice that the price action was making a higher high. This can be seen by the upward sloping orange line connecting the two swing high points. If you scroll to the bottom pane, you will find the ROC technical indicator. There you will find a downward sloping orange line connecting the swing highs within the ROC indicator that aligns with the swing highs in the price above it. This creates the bearish divergence formation between price and the ROC indicator.
Now that we have identified the bearish divergence formation, let’s see what the price action preceding it looks like. We can see that there was a strong uptrend leading to the divergence formation. As such, this scenario represents a viable opportunity to go short. The sell signal will occur upon a cross below the zero line of the ROC indicator from above. If you refer to the upward pointing blue arrow noted, Sell, you can see where this event occurred, signaling the short trade entry.
The stop loss should be placed above the swing high preceding this sell signal as can be seen by the black dashed line above it. The target level for exiting the trade would be measured using the Fibonacci retracement tool. More specifically, we would measure from the swing low to the swing high of the prior uptrend, and use the 50% fib retracement level as the exit point. The green horizontal line plotted on the price chart represents this 50% Fibonacci retracement level.
Following the sell entry, the price began to slide, moving lower towards our predefined target level. After a minor upside correction that interrupted the decline, the price continued lower, finally triggering the take profit level at the 50% retracement level. As a result the trade turned out to be a profitable, and we were in no real jeopardy of the stoploss being triggered during the course of the entire trade.
Summary
Momentum is an important concept in trading, and there are many different technical studies that measure the momentum behind price action. The ROC Rate of Change is one such indicator. It is a versatile trading indicator that can benefit both trend following and mean reversion traders alike.
ROC is very similar to the Momentum indicator, and they tend to correlate with one another quite closely. The primary input within the ROC indicator is the N value, which represents the look back period. Shorter-term traders should consider using the default setting of nine for the N value, while longer term traders might consider a somewhat longer setting. Ultimately, that input will depend on the relative time horizon that the trader is seeking to capture.