The moving average is one of the most common indicators in Forex trading. It is present in almost every chart analysis that you will see online. Some platforms even come with pre-built templates that include different moving averages. For this reason, today we will discuss one of the most common signals given by the different moving average indicators.
What is the Moving Average Indicator?
The moving average is an indicator that takes price points on the chart on an equal time distance and averages them. This way, at a specific moment, the moving average will show you the price average based on past data on the chart.
What Does the Moving Average Indicator Look Like?
The moving average study is seen as a curved line. It can be applied directly on the price action chart, no matter what type of chart you are using. Sometimes the moving average line will be above the price action and other times it will be below the price action. Here is an example:
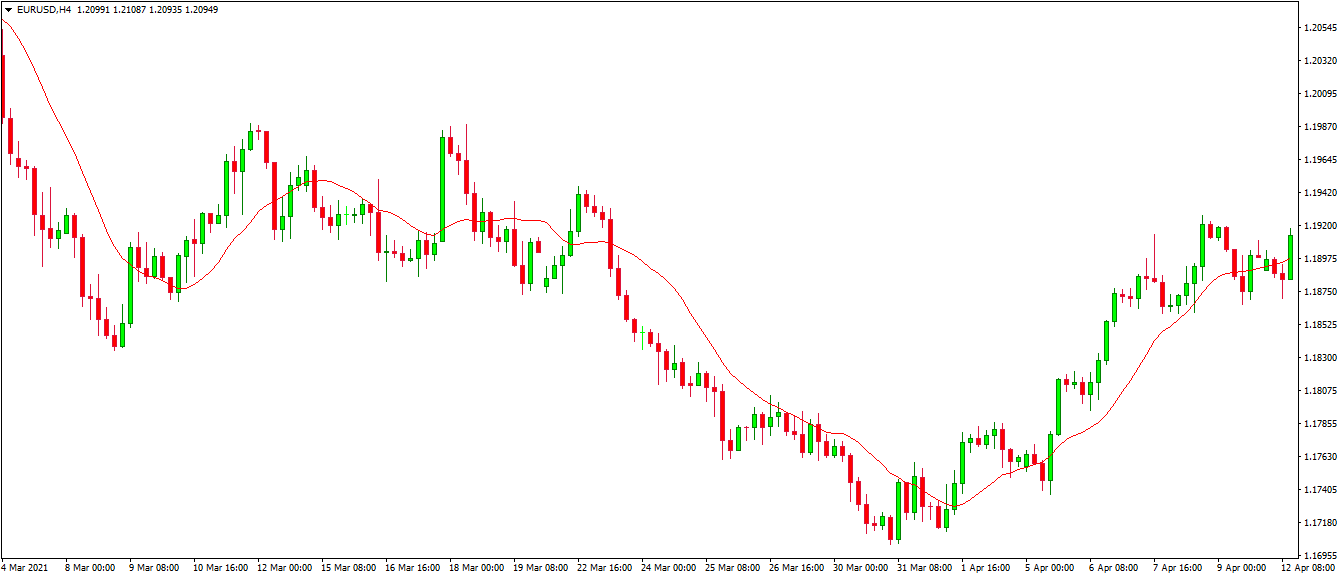
The red line on the chart is a moving average line. Notice how the price constantly fluctuates above and below the moving average line. This creates different signals, which we will discuss later in the article.
Moving Average Calculation
The moving average indicator calculation relies on a pre-determined number of periods on the chart. You can choose how many periods you want the moving average to take into consideration to give you an average.
For example, if you use a 20-period simple moving average on a H1 chart, the indicator will take the last 20 hourly price values and will average them. This way, you will get a moving average point on the chart. The different average points on the chart create the moving line that you saw above.
If you take a 50-periond simple moving average, it will average the last 50 periods on the chart. If you take a 200-period moving average, it will average the last 200 periods on your chart and so on.
As a general guideline, the longer the moving average period, the smoother the moving average line will tend to be. The reason for this is that a single price fluctuation gives a higher deviation on a shorter number of periods, and is less pronounced as the number of periods increases.
Moving Average Price Signals
Traders use moving average indicators to get different trading signals on the chart. They use these signals to set entry and exit points for their trades. Sometimes, moving averages can simply support the trading strategy with an extra layer of confirmation. Here are the most common signals that you will get from a moving average.
Support and Resistance
Every moving average has the power to act as a support or a resistance zone. Since MAs are a representation of price action, they contain a psychological factor that can act as a turning point on the chart.
If the price interacts with a moving average from above, the MA can act as a support. If the price approaches the moving average from below, then we can have a resistance test.
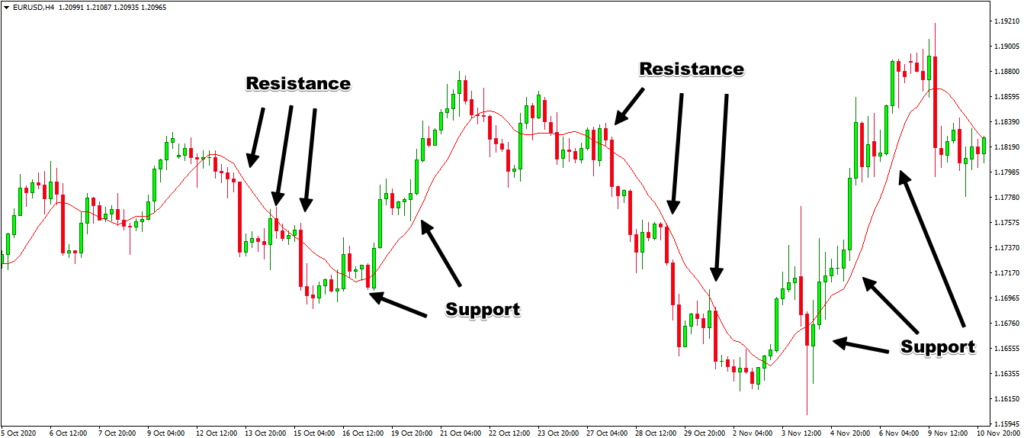
Here is an example of how a moving average can support and resist the price action. These bounces from the MA can work as signals for your trades.
Price Breakouts
If the price slices through a moving average and breaks it, then the price is very likely to continue in the same direction. In some cases, a moving average breakout will lead to the creation of fresh trends.
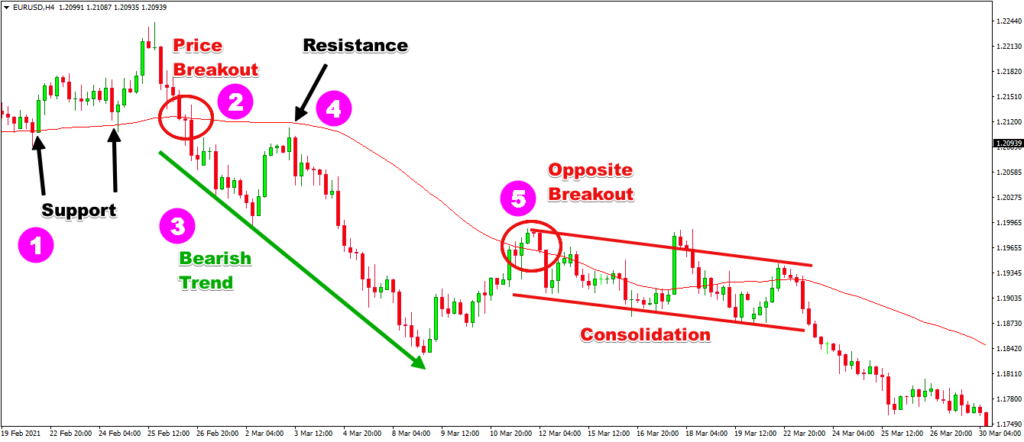
Above we see how a relatively slow moving average (50-period) begins as a support. Suddenly, the price breaks it in the bearish direction. As you can see, a bearish trend forms as a result. In the meantime, the moving average turns into a resistance and pushes the price action even lower. An opposite breakout appears at (5), followed by the end of the trend.
Moving Average Crossovers
You are free to use more than one moving average on your chart. Actually, you are not limited to any number of moving averages. However, to get a moving average crossover, you will need at least two moving averages.
The moving average crossover is a type of signal where a faster moving average crosses a slower moving average. Since a smaller period moving average is more volatile, it will act to crossover the bigger period moving average.
When an MA cross occurs on the chart, this is a signal that the price might be moving in the direction of the crossover. When the faster moving average breaks the slower moving average upward, we have a bullish MA crossover. If the faster moving average breaks the slower moving average downward, then we have a bearish MA crossover.
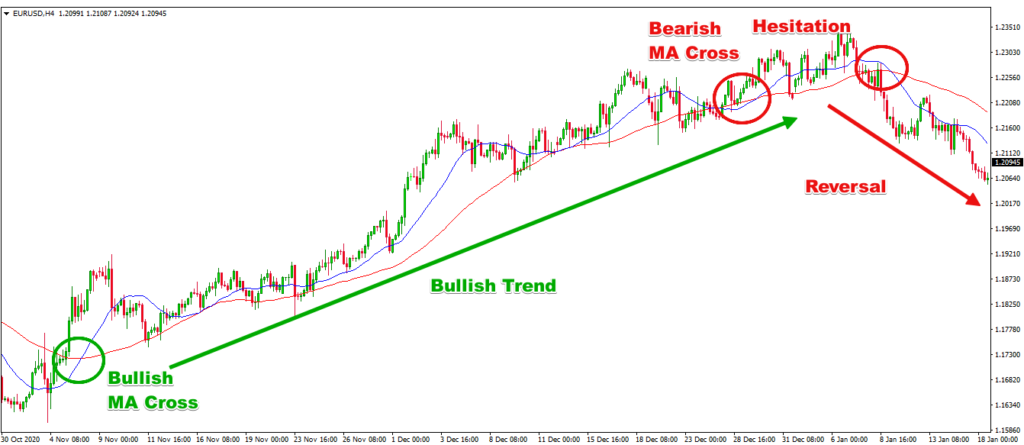
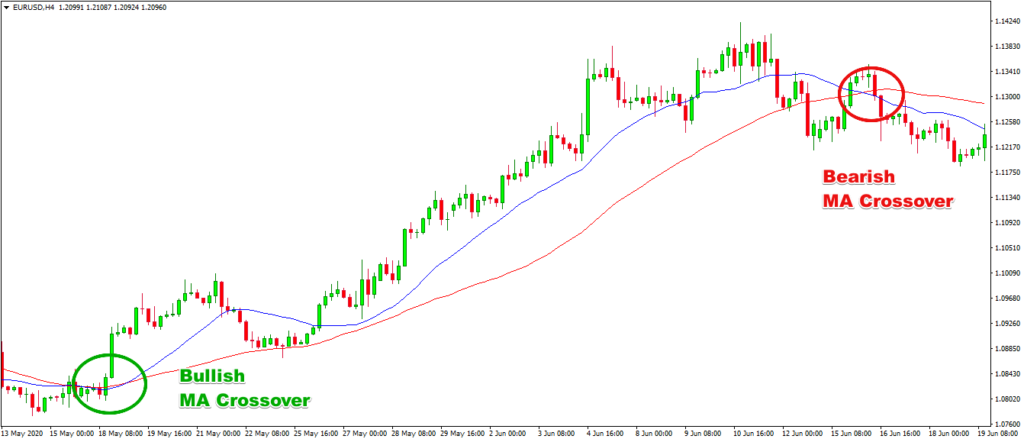
Above you see a chart with two simple moving average indicators – 20-period (blue) and 50-period (red). The smaller one is the more dynamic one due to the smaller amount of periods taken into consideration. This causes the blue MA to be more curved, while the 50-period is smoother. At the beginning of the chart, we see a bullish moving average crossover, which leads to a solid bullish trend.
At the top of the trend, we see an opposite MA crossover (bearish), followed by a price hesitation and a second bearish MA cross. A reversal occurs afterward.
Different Types of Moving Average Indicators
There are several moving average types based on the way they actually average the price action periods. Below are some of the more common ones.
Simple Moving Average (SMA)
The simple moving average (SMA) calculates the mean of the price action periods taken into consideration. That’s it. With every new candle on the chart, the moving average calculates a new mean point on the chart.
Exponential Moving Average (EMA)
The exponential moving average (EMA) works in nearly the same way as the SMA. However, the EMA puts a higher emphasis on more recent periods. This is where the exponential factor comes from.
Volume Weighted Moving Average (VWMA)
The volume weighted moving average (VWMA) works in a similar way to the EMA. But the VWMA puts emphasis to price periods, supported by a higher trading volume.
Displaced Moving Averages
You can shift moving averages forward or backward on the chart, creating displacement. If you displace a moving average by 10 periods into the future, the line you have on the chart will simply move 10 periods to the right. If you displace a moving average in the past, then the line switches to the left.
You can displace any moving average the way you want. Traders perform moving average displacements to read the price action in a better.
You can combine different moving averages on your chart. It is not necessary for all your MAs to be of the same type. You can use one SMA with one EMA, or one EMA with one VWMA, or any other combination.
Entry Signals from Moving Average Crossovers
We will now show you some of the most common crossover setups that traders use.
2 SMA Crossover Indicator
The first example includes the use of the most common scenario – dual simple moving averages.
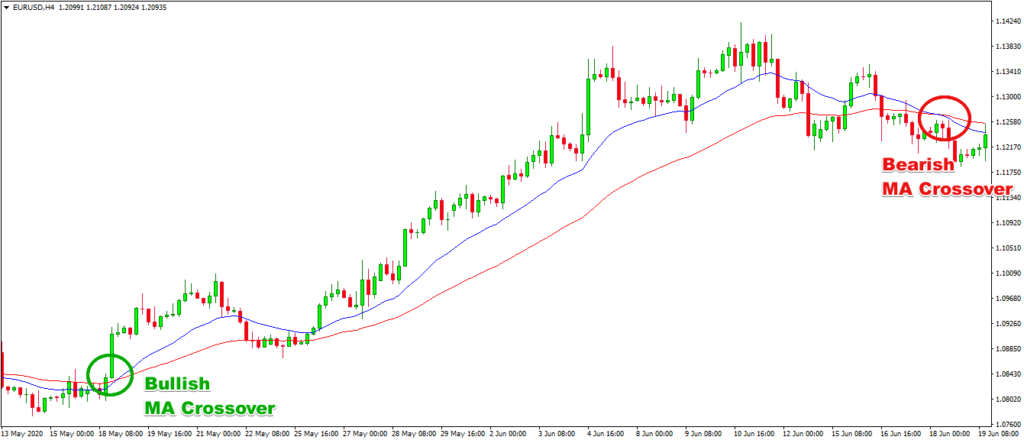
We see the same 20-period and 50-period simple moving average indicator above. We have a bullish SMA crossover, followed by a bullish trend. A bearish SMA cross appears after a horizontal price move and we see a drop afterward.
2 EMA Cross Indicator
Another common scenario is the one that includes two exponential moving average indicators. Let’s see what will happen if we use two exponential moving averages with the same periods on the same chart!
The scenario is nearly the same. However, the bullish EMA cross over comes earlier compared to the SMAs. At the same time, the bearish EMA cross indicator signal appears later with the EMAs compared to the SMAs.
Other Forex MA Cross Strategy
Now let’s approach another moving average crossover example. This time, we will use three simple moving average indicators on the same chart.
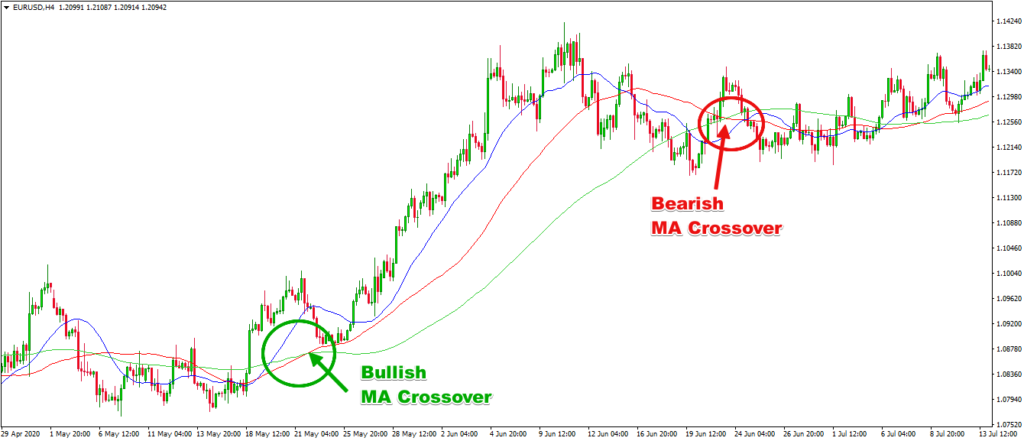
Here are the three simple moving averages:
- Blue: 20-period SMA – fast
- Red: 50-period SMA – slow
- Green: 100-period SMA – slower
The bigger the MA, the smoother it is. In this manner, the faster SMAs are breaking the slower ones.
Although we call it an SMA crossover strategy, the general idea is that the three moving averages line up in a bullish or bearish direction.
In our case, we get a bullish crossover at the moment when the three SMAs line up from top to bottom: fast, slow, and slower. The bearish crossover comes when the three SMAs line up from top to bottom: slower, fast, and slow.
The crossovers here come later than with the dual moving averages. The reason for this is that we will be waiting for another confirmation from the third SMA, which takes extra time. On the other hand, these crossovers are more accurate than the dual moving averages, because they contain an extra confirmation.
Stop Loss with the MA Crossover Indicator
As with every other Forex trading strategy, we always recommend that you use a stop loss order when trading MA crossovers.
If you decide to enter the market on an MA cross indicator, you should put your stop at the other side of the cross.
If the cross is bullish and you open a long trade, the stop loss should go below the bottom created at the time of the price switch.
If the cross is bearish and you open a short trade, you can place your stop above the price top at the time of the reversal.
Here is an example of a stop loss order on a moving average crossover trade:
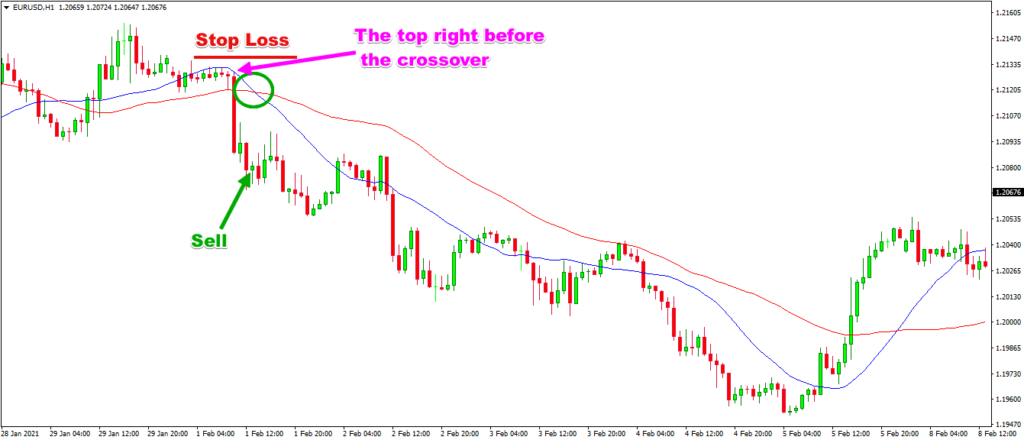
The green circle shows the actual MA crossover. The pink arrow points toward the swing top before the cross. If you believe that this swing top is not adequate, you can use the one before. However, that will require your taking more risk.
Profit Collection for Your MA Forex Crossover Strategy
Notice that we use “profit collection” and not “take profit” as a level. The reason for this is that moving average crossover trading is not providing you a fixed exit point for your trades. You should wait for the opposite crossover to exit your trades or some other exit mechanism.
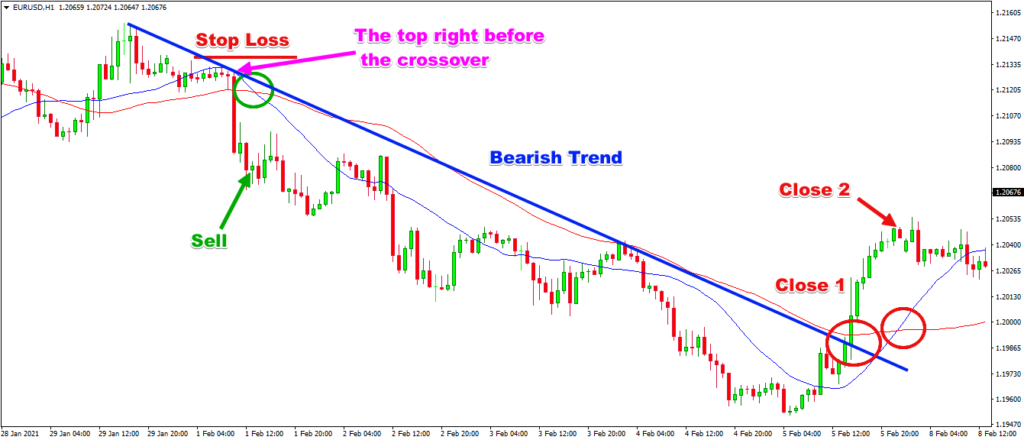
This is the same example from above. However, this time we have outlined the bearish trend that the price action is following.
You can close your trade when the price breaks that trend line or you can wait for the opposite cross. In this case, the trend breakout is sufficient, because the trend is very clear on the chart. You can always wait for the bullish crossover as noted by Close 2, but why would you?
MA Crossover Strategy with Price Action
The first trading strategy we will give as an example involves the moving average crossover combined with price action techniques. The goal here is to enter the market on a MA crossover indicator signal and some other price action signal. Then, you would close your trade on either a strong price action signal or an opposite MA crossover.
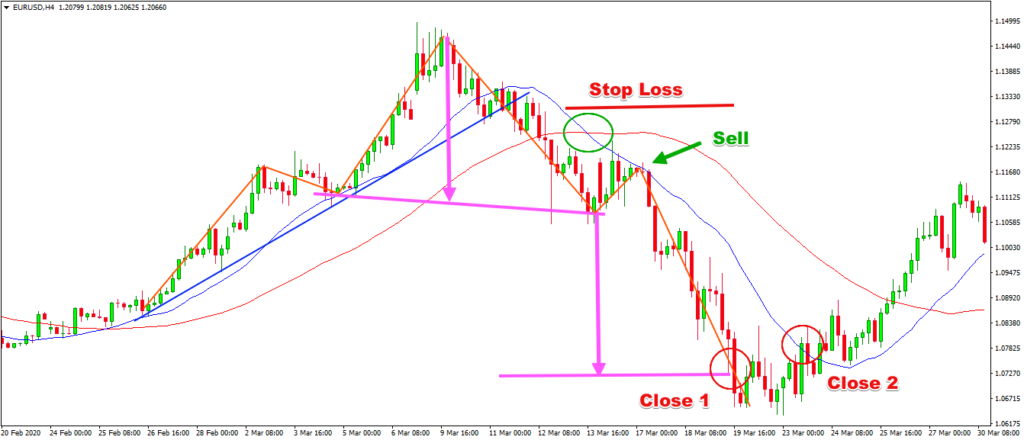
Above you see an H4 chart of the EUR/USD. We have a couple of SMAs on the chart – the 20-period and the 50-period.
The chart starts with a bullish trend (blue straight line), which gets broken and shows reversal intentions shortly after.
This reversal intention gradually forms a Head and Shoulders chart pattern, supported by a bearish SMA crossover. At the time when the price was creating the second shoulder, we saw a bearish bounce from the blue 20-period SMA. This looks like a suitable time to sell.
The good thing here is that we have the Head and Shoulders rule to pursue an eventual target for our trade. We suggest a couple of exits here at close 1 and close 2.
Close 1 – the price completes the Head and Shoulders pattern.
Close 2 – the price action confirms a Double Bottom chart pattern and breaks the 20-period SMA (blue) in the bullish direction.
Moving Average Crossovers with the MACD Indicator
One of the best moving average crossover strategies involves the MACD indicator. MACD works well with MA crossovers, because the MACD involves moving averages in its calculation. We will open trades based on MA crosses combined with an extra signal from the MACD. Then, we will close trades on either an opposite moving average cross or just an opposite MACD signal.
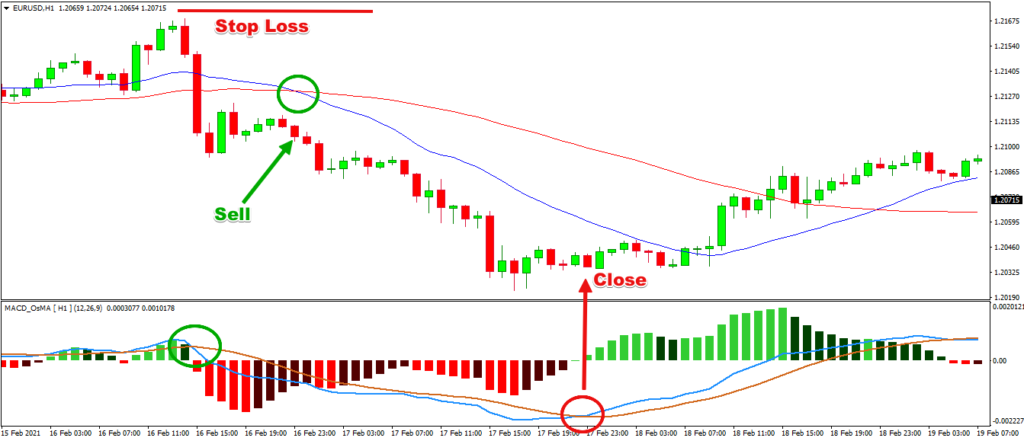
This time, we have a MACD at the bottom of the H1 EUR/USD chart and 20-period and 50-period SMAs.
The first bearish signal we get at the green circle on the MACD indicator, when its two lines cross.
Shortly after, we get a bearish SMA crossover, which confirms the MACD signal. This is a good moment to sell, placing a stop loss order above the last top on the chart.
The EUR/USD starts trending in a bearish direction. Our closing signal comes when the MACD lines interact with each other in the opposite direction.
Conclusion
- Moving averages are among the most common Forex trading indicators.
- MAs are curved lines and can appear above or below the price action.
- A moving average uses a certain fixed period as a user input.
- Signals of the MA indicator:
- Support and Resistance
- Price Breakouts
- Moving Average Crossover
- Bullish MA Cross – a faster MA breaks a slower MA in bullish direction
- Bearish MA Cross – a faster MA breaks a slower MA in bearish direction
- Different Moving Average Indicators:
- Simple Moving Average (SMA) – simply averages the periods
- Exponential Moving Average (EMA) – puts weight on more recent periods
- Volume Weighted Moving Average (VWMA) – puts weight on periods with higher trading volume
- Displaced Moving Averages – shifts the MA a certain number of periods
- MA crossovers can appear in any MA setup
- 2 SMA Crossover Strategy
- 2 Forex EMA Crossover Strategy
- 3 EMA Crossover Strategy
- SMA + VWMA Crossover Strategy
- Other MA Strategies
- Your stop loss order should be placed at the other side of the cross.
- Close your trades based on opposite signals
- Two of the best MA crossover strategies
- MA Crossover + Price Action: Open your trades on MA crosses and price action signals. Put your stop at the opposite side of the moving average crossover. Close your trades based on opposite MA crossover.
- MA Crossover + MACD: Open your trades on MA crossovers, confirmed by a signal from a MACD indicator. Put your stop at the opposite side of the MA cross. Close your trades on either an opposite MA cross, or an opposite MACD signal.