Chart patterns are an integral part of the technical trader’s arsenal. Their effectiveness has been studied and validated. One reason why many traders find chart trading attractive is because these patterns can offer precise entry and exit points based on the rules of each pattern.
Today we will discuss two of the most popular chart patterns used in Spot Forex. This is the Double Top and its reversed equivalent the Double Bottom. We will discuss the structure of these two patterns and the potential they create on the chart. Finally, we will show you how to trade the Double Top and Bottom reversal formations using practical examples.
Double Tops and Double Bottoms
Double Tops and Double Bottoms are reversal chart patterns. They consist of two price swing located approximately on the same level.
These patterns typically appear after a trend move. After the confirmation of the pattern, you expect the trend to be reversed. Let’s now dissect the structure of each of the two patterns:
Double Top Chart Formation
The Double Top technical formation starts with a bullish trend. The trend gets interrupted at some point and the price of the currency pair starts to range. The range consists of two swing tops on the chart. After the creation of the second top, the price action drops and starts a new bearish trend.
The diagram below will help you visualize this process:
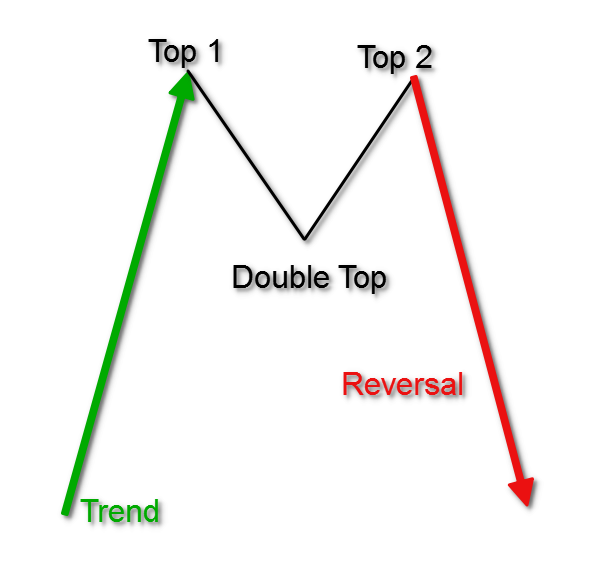
Above you see the structure of the Double Top chart pattern. Notice that the initial trend is bullish but later it gets reversed after the Double Top formation.
Double Bottom Chart Formation
The structure of the Double Bottom technical formation is absolutely the same as the Double Top pattern, but upside down. The Double Bottom chart pattern starts with a bearish trend, which gets interrupted at some point. The price action then enters a range, which creates two bottoms on the chart. After the second bottom, the price breaks the range to start a new bullish trend. Look at the sketch of the Double Bottom chart pattern below:
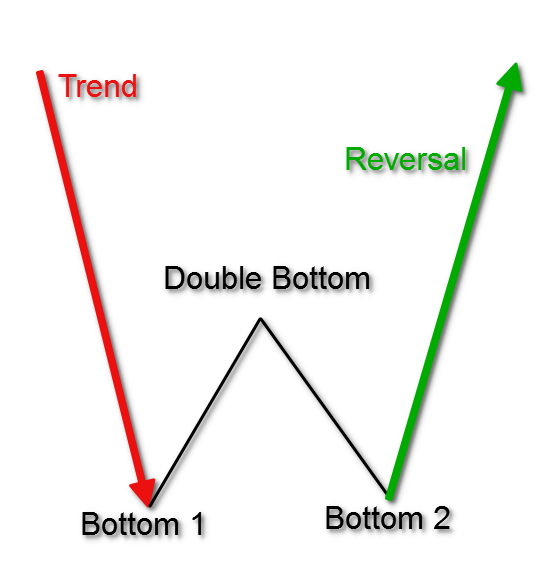
As mentioned, this is pretty much the same situation as the Double Top, but this time the price action starts with a bearish trend, which gets reversed into a fresh bullish move.
Confirmation of Double Tops and Bottoms
Although the pattern is fairly easy to recognize and can be traded using a basic set of rules, you cannot simply jump into a trade whenever you see two bottoms or tops on the chart. To initiate a trade based on this pattern, you should first confirm its validity. There are two details related to the confirmation of the Double Top and the Double Bottom reversal patterns. This includes the Neck Line and the breakout.
Drawing the Neck Line
The Neck Line of the Double Top pattern is the horizontal level at the bottom between the two tops.
Opposite to this, the Neck line of the Double Bottom pattern is the horizontal level at the top between the two bottoms. This is how the neck line looks:
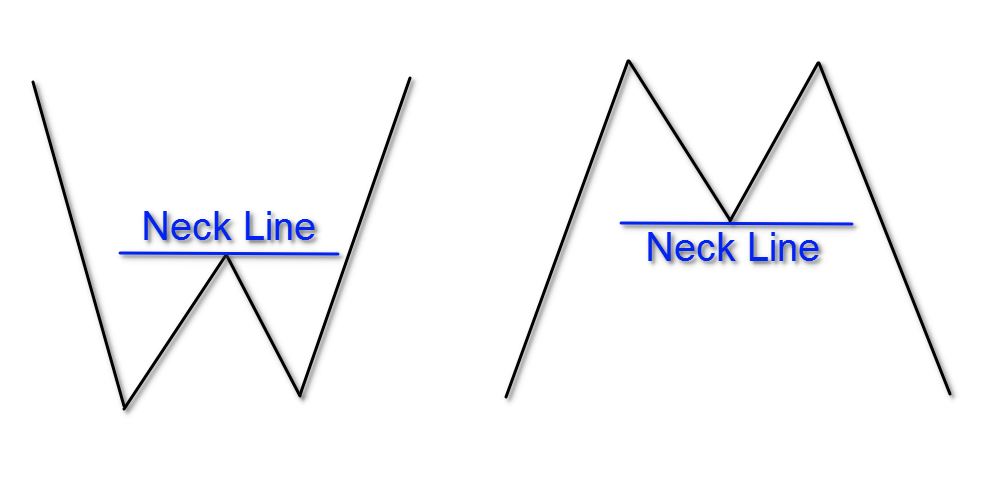
The first thing you need to do when you spot the pattern is to manually add the Neck Line on the chart. It plays the role of a trigger for your trade. Therefore, this level is of a great importance for your pattern.
Neck Line Breakout
The confirmation of the pattern comes when the price action breaks the Neck Line. Closing a candle beyond the Neck Line means that there is a valid breakout of the range, which comes after the initial trend. Since the breakout is opposite to the trend, we confirm the emergence of a new trend.
If you have a Double Top pattern, you will wait for a bearish breakout. If you have a Double Bottom pattern, you will wait for a bullish breakout for your confirmation. Then you would trade the pattern in the direction of the breakout.
Potential of the Double Top and Bottom Reversal Patterns
As we already said, the Double Top and the Double Bottom have a reversal character. In this manner, they are expected to change the direction of the trend, creating a brand-new tendency.
In addition, when you spot the Double Top or Bottom reversal pattern, you can use the structure to extrapolate how far the potential price move could go.
There are two things you need to do in order to identify the minimum potential of your Double Top/Bottom chart pattern. We will discuss this in the next section.
Size of the Double Top and Double Bottom Reversal Patterns
First, you need to measure the size of the pattern. To do so, connect the two tops/bottoms with a single line. Then add a perpendicular line to the line between the two tops/bottoms starting from the Neck Line. This distance is the size of your Double Top or Bottom pattern.
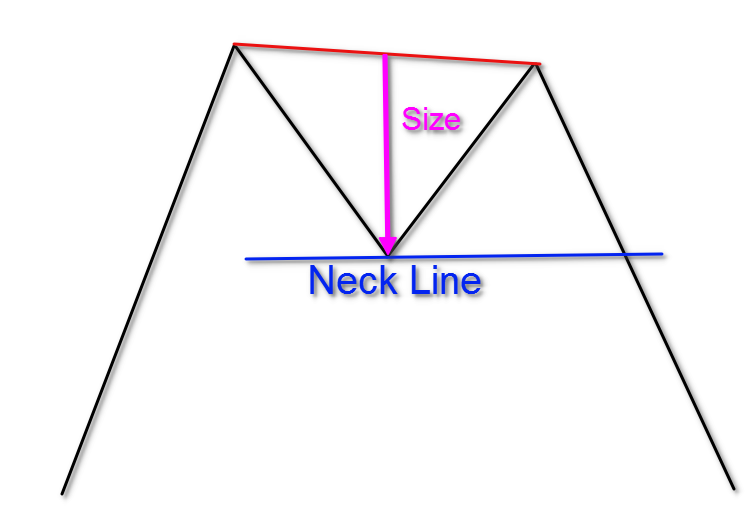
The size of the Double Top pattern is illustrated with the magenta colored arrow on the image above. It works the same way with the Double Bottom pattern, but in reverse.
Projecting the Move
After you measure the size of the pattern, you need to apply this distance starting from the opposite side of the neck line. In other words, your minimum target equals the size of the pattern.
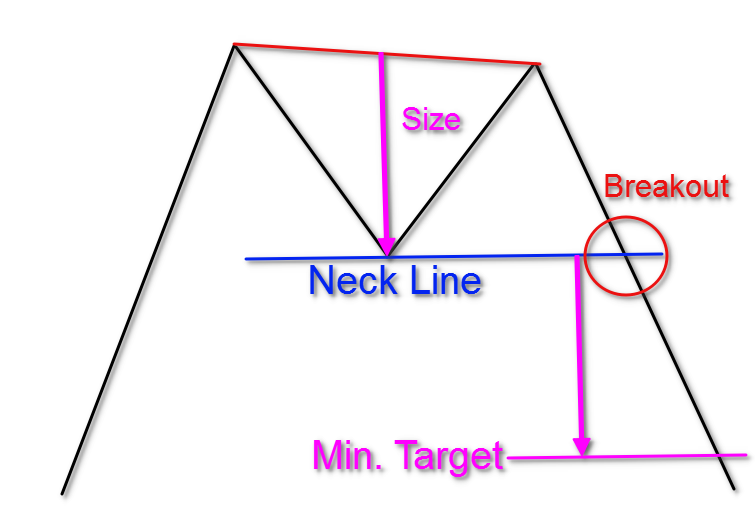
This time we have added a second arrow which is equivalent to the first arrow. So, the first arrow measures the size of the pattern and the second arrow applies this size as a minimum target of the pattern.
Again, the same is in force for the Double Bottom figure, but in a bullish direction.
The 11 Step Process for Trading Double Tops and Bottoms
To trade Double Tops and Bottoms properly, you need to implement some basic trading rules. The following steps will help you identify and trade the Double Top reversal:
Step 1: Trend Identification
The first thing you need in order to identify a Double Top pattern is a bullish trend. You cannot confirm the pattern in the absence of a trend. Although Tops and Bottoms can and do occur when the market is not trending, a valid Double Top/Bottom formation must exist in the context of a trend.
Step 2: Creation of a Top
Each top within a bullish trend could be the beginning of a Double Top pattern. Therefore, you should carefully observe the price action at swing highs on the chart.
Step 3: Trend Interruption
To continue with your analysis, you need to see the price action interrupting its current trend. Typically, this would come in the form of a price retracement that breaks the bullish trendline. It is important to note that this (Step 3) may sometimes come at a later point in the sequence of events.
Step 4: Creation of a Bottom
After the top is created on the chart, the pattern needs to create a bottom. Many times, this bottom could be located on a bullish trend line, but that is not a requirement.
Step 5: Creation of the Second Top
After a bottom has formed, the price action needs to create a second top on the chart. This is often referred to as the retest. The perfect Double Top pattern will have a second top, which is slightly lower than the first top. This indicates that the trend is at least slowing down and likely exhausted.
In many instances the two tops are on the same level, and sometimes the second top could even be slightly higher than the first top. If the second top is higher than the first top, you will typically see a divergence pattern forming as well.
Step 6: Drawing the Neck Line
The sixth step of our trade identification process is to plot the actual neck line of the pattern. To do this you need to reference the swing bottom, which is located between the two tops. Then you would draw a horizontal line at this level. This would be the Double Top Neck Line.
Step 7: Neckline Breakout
The next step is to confirm the validity of the pattern. If the price action closes a candle below the Neck Line, we confirm the validity of the formation.
Step 8: Trade Entry
Since you have a confirmed Double Top pattern on the chart, you now have the go ahead signal to enter a position. For the Double Top, you would open a short (bearish) trade.
Step 9: Stop Loss
You should always secure your open trades with a stop loss order. Although the success rate of these patterns is relatively high, there is never a guarantee that the trade will work in your favor.
The optimal place to put your stop loss order is just above the second top of the Double Top reversal pattern.
Step 10: Size of the Pattern
Now that you are short based on the Double Top pattern, you need to project a possible target. You should measure the size of the pattern as discussed earlier and then apply it downwards starting from the Neck Line. This would be your minimum target.
Step 11: Exit the Trade
You should exit your trade when the price action reaches the minimum target of the Double Top chart pattern per Step 10.
This 11-step process works absolutely the same way with the Double Bottom reversal. However, the rules are applied in the opposite direction.
Double Top and Bottom Trading Example
Now that we have discussed the steps for trading the Double Top, we will shift our attention to an actual price chart which has a Double Top formation. Have a look at the following example:
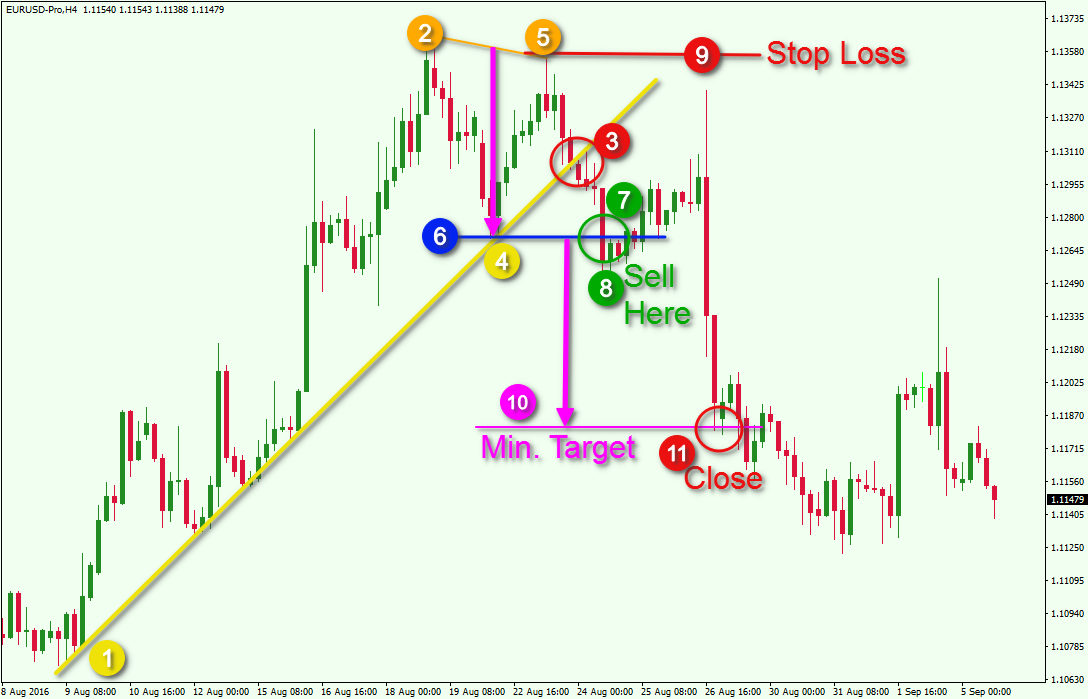
This is the four-hour chart of the EUR/USD currency pair. The image covers the period during August 2016 and shows each of the 11 steps designated with different colors, which will help you connect them to the respective events on the chart.
Step 1: We have the yellow bullish trend on the chart.
Step 2: The price creates the first top.
Step 4: Notice that the next bottom created is on the trend line and not through the trend line. Therefore, the trend is not broken yet and Step 4 appears right after Step 2. Step 3 comes at a later point.
Step 5: The price creates another top, which is slightly lower than the first top on the chart.
Step 3: The price action finally breaks the trend line, which puts Step 3 right after Step 5.
Step 6: We plot the neck line on the bottom between the two tops of the pattern.
Step 7: The price action breaks the blue neck line of the Double Top reversal pattern.
Step 8: Sell the EUR/USD when you identify the breakout and candle close beyond the neck line.
Step 9: Put a stop loss order right above the second top of the pattern.
Step 10: Then you measure and apply the size of the pattern as your minimum target.
Step 11: You close the trade when the price action reaches the minimum target.
Notice that after the break through the Neck line, the price action creates a big bullish correction as a result of high volatility. A bearish candle with a very big upper candlewick is created and it nearly hits our stop. However, our stop loss order is well positioned and it sustains the pressure.
Now let’s take a look at a Double Bottom chart formation and apply the same 11 step process.
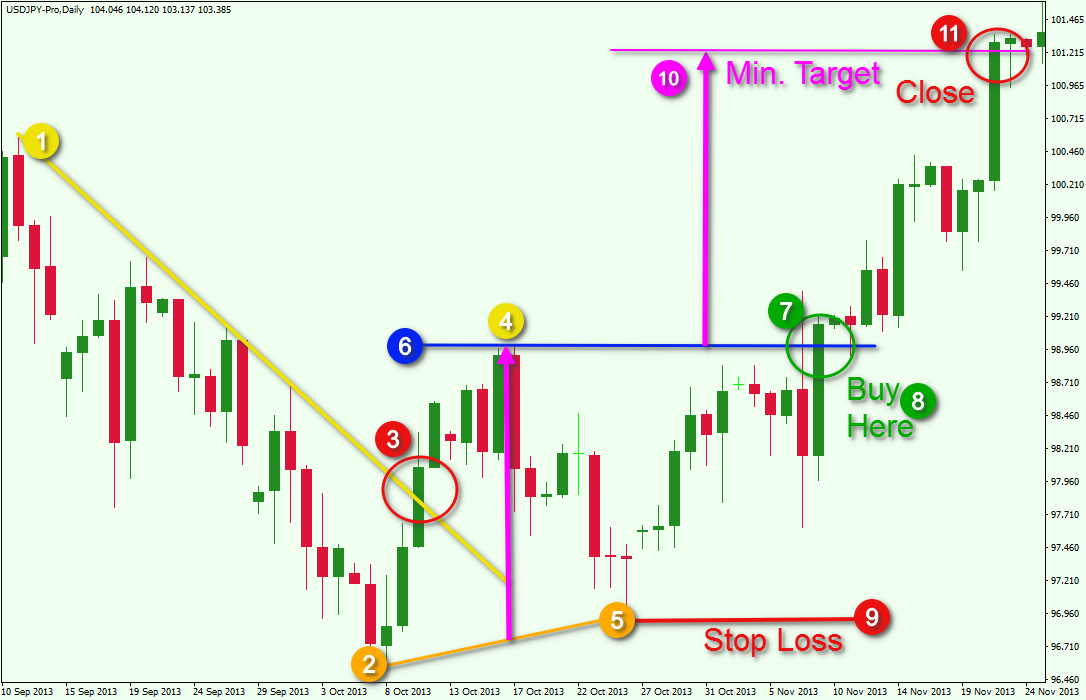
You are now looking at the daily chart of the USD/JPY for Sep – Nov, 2013. The image illustrates the 11 step process you need to follow to trade this Double Bottom. Let’s evaluate each one:
Step 1: We have the yellow bearish trend on the chart.
Step 2: The price creates the first bottom.
Step 3: This time the price action breaks the trend line after creating the first bottom.
Step 4: The price action creates a top afterwards.
Step 5: The second bottom is created after the top.
Step 6: We plot the neck line on the top between the two bottoms of the pattern.
Step 7: The price action breaks the blue neck line of the pattern, creating a neckline breakout.
Step 8: Buy the USD/JPY pair when you identify the breakout and closing candle through the neck line.
Step 9: Place a stop loss order below the second bottom of the pattern.
Step 10: Then you measure and apply the size of the pattern as your minimum target.
Step 11: You close the trade when the price action reaches the minimum target.
Take note that in the two examples we discussed, the trend line breakout appeared at different times in the process. In the first case the price broke the trend after the creation of the second top. In the second case the trend breakout came right after the creation of the first bottom. In both cases the patterns were valid and led to a price move equal to the size of the pattern.
Conclusion
- Double Top and Double Bottom patterns are two of the most prevalent and popular reversal chart patterns.
- These patterns consist of two price extremes located approximately on the same level.
- The Double Top is a mirror image of the Double Bottom pattern:
- The Double Top starts with a bullish trend, which turns into a sideways movement. The range then gets broken downwards and the price action reverses.
- The Double Bottom starts with a bearish trend, which turns into a sideways movement. The range then breaks through the upper level and the price action reverses.
- We need two things in order to confirm the pattern:
- Neck Line – a manually added horizontal line on the bottom between the two tops (for a Double Top) or on the top between the two bottoms (for a Double Bottom)
- Neck Line breakout – a candle closing beyond the Neck Line.
- The trade signal occurs when the price action breaks the neck line:
- Open a short trade if the pattern is Double Top.
- Open a long trade if the pattern is Double Bottom.
- The Double Top/Bottom pattern has a fixed minimum potential. You can project the minimum target by applying the following:
- Size of the Pattern – the distance between the Neck Line and the perpendicular line which connects the two tops/bottoms
- Applying the Size as a Target – The potential of the pattern is equal to its size applied from the Neck Line.
- The 11 Steps for Trading Double Tops (reversed for Double Bottoms):
- Step 1: Trend Identification
- Step 2: Creation of the first Top
- Step 3: Trend Interruption
- Step 4: Creation of a Bottom
- Step 5: Creation of the Second Top
- Step 6: Plotting the Neck Line
- Step 7: Neckline Breakout
- Step 8: Trade Entry at Neckline Breakout
- Step 9: Stop Loss above second Top
- Step 10: Measure Size of the Pattern for a Target
- Step 11: Exit the Trade at Minimum Target Projection