Most traders are familiar with traditional moving average studies such as the simple moving average, exponential moving average, and volume weighted moving average. These are some of the more popular types of moving averages utilized by market technicians. Today we will be introducing a lesser-known, but very effective moving average indicator that is called, DEMA.
What Is The DEMA Technical Indicator?
The double exponential moving average, known as the DEMA indicator was developed by Patrick Mulloy. He introduced the DEMA indicator in the January 1994 issue of the “Technical Analysis of Stocks and Commodities” publication. He was attempting to find a better moving average study which could reduce the lag of traditional moving average indicators and one that would provide more timely entries.
The DEMA indicator is a double exponential moving average indicator which is more responsive to recent price data compared to the traditional exponential moving average study. Since moving averages tend to be lagging indicators, they can generate somewhat delayed trading signals.
The DEMA indicator tries to address this disadvantage inherent within many moving average studies. We can look at a price chart to compare the differences between the different types of moving averages to get better sense of this.
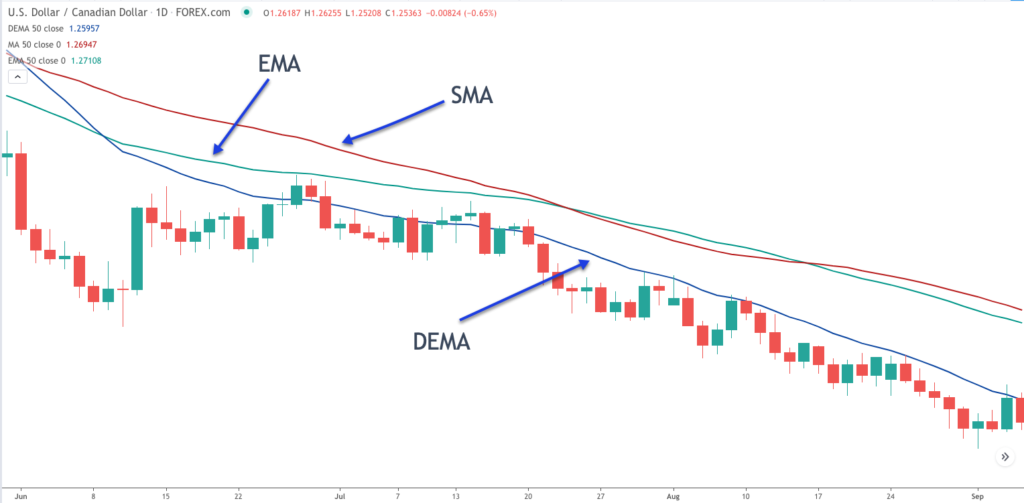
Below you’ll find a price chart with the following moving average overlays – the red line represents the 50 period Simple moving average line, the green line represents the 50 period Exponential moving average line, and the blue line represents the DEMA moving average line.
Notice how the DEMA line hugs the price action better than both the SMA and EMA.
Double Exponential Moving Average Formula
The double exponential moving average has a somewhat complicated formula behind it. Essentially, the DEMA indicator is a combination of single and double exponential moving averages that result in another exponential moving average.
Below you will find the formula for the DEMA indicator:
EMA1 = EMA of price
EMA2 = EMA of EMA1
DEMA = (2 x EMA1) – EMA2
And so, as you can see from the formula above the DEMA takes into account a single EMA, known as EMA one, and then a double smoothed EMA known as EMA2. And then from here, the DEMA can be calculated by subtracting the EMA2 from 2X of EMA1. Thankfully, you do not need to memorize this formula to implement the DEMA technical indicator. Your trading platform will automatically plot the DEMA indicator on your price chart based on your specific input.
The DEMA trading indicator may appear somewhat confusing and complicated to understand, however, its uses are fairly straightforward. That is to say that many of the signals that you get from the DEMA indicator will work similarly to other more traditional moving average studies. For example, traders can utilize the DEMA moving average line to identify trends in the markets, find areas of support and resistance, spot potential breakout opportunities, and perform other technical based analysis. Generally, the DEMA moving average line will provide earlier entry opportunities since it is more sensitive and responsive to recent price action.
DEMA vs TEMA
A common question that arises is the following: What is the difference between the dual exponential moving average, DEMA, and the triple exponential moving average, TEMA? Well, if you thought that the calculation for the DEMA was confusing, then you will certainly find the formula for TEMA to be even more of a challenge.
Essentially, the TEMA utilizes a triple smooth exponential moving average along with the single and double smoothed EMAs. There is no need to get into the exact formula of TEMA, for you to understand that as a triple exponential moving average, it will be even more sensitive to the recent price action then the DEMA.
The TEMA indicator is also the creation of Patrick Mulloy. The TEMA indicator is very well suited for short-term trading due to its more sensitive nature. The DEMA indicator, can also be used for short-term trading, however tends to work better for swing trading opportunities.
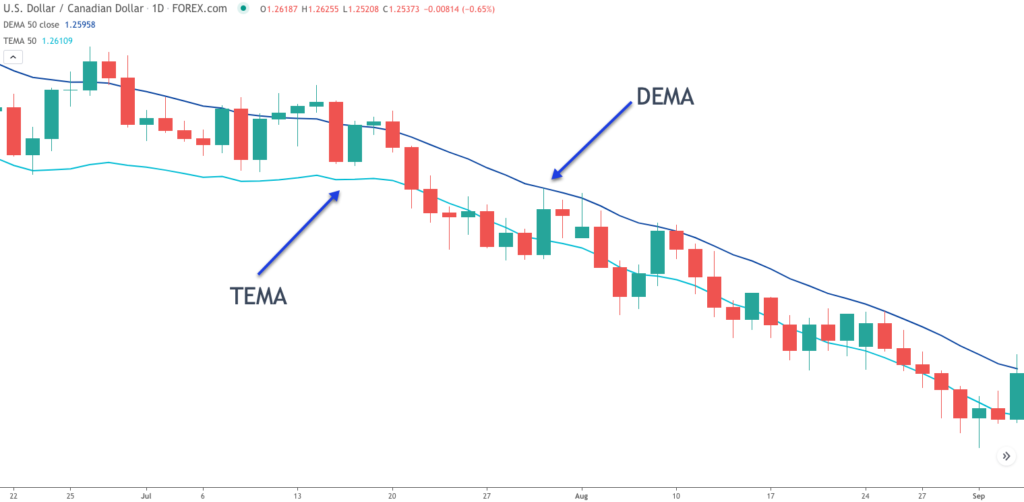
Below you can find a price chart that shows both the DEMA and TEMA indicators plotted on the price chart. The DEMA line is shown in blue and the TEMA line is shown in cyan.
DEMA Signal Types
As we now know, the DEMA indicator is more responsive to recent price action. And as such, it can often provide clues earlier than most other moving average studies. So what types of trading analysis can be performed using the DEMA technical study? Well, let’s take a look at a few of the more important uses of the DEMA indicator.
Trend identification – Trend identification is one of the most important aspects of trading. Without knowing what the current market environment is, it will be difficult to consistently beat the market. Traders need a method for identifying whether the market is in an uptrend, downtrend, or is trading in a sideways, range bound manner. Although you can often glance at a price chart to get an idea of what the general trend of the market is, you want to have a more objective measure for defining the current trend.
The DEMA moving average line does an excellent job at providing that information. When the price is trading above the DEMA line, and the DEMA line is sloping upward, then we can say that the trend is up. Similarly, when the price is trading below the DEMA line, and the DEMA line the sloping downward, then we can say that the trend is down. And finally, when the price is trading sideways, and the DEMA indicator appears relatively flat, then we can say that there is no trend in place, or that there is no clear direction currently in the market.
Support and resistance analysis – There are many types of support and resistance levels in the market. And the two primary classes in which most support and resistance levels fall into include fixed support and resistance, and dynamic support and resistance. Fixed support and resistance represents levels that are static or fixed based on a particular price level. This includes horizontal price levels, Fibonacci levels, pivot points, and more.
The second class of support and resistance levels, which are called dynamic support resistance levels, include trendlines, moving average lines, volatility bands, and more. These dynamic support and resistance levels can change with each new bar that prints on the price chart. Thus the, DEMA indicator, which is a type of moving average study is considered a dynamic support resistance indicator.
The Double Ema indicator can be quite useful in finding levels of support within uptrend, or resistance within a downtrend. That is the same that when prices move away from the DEMA indicator to the upside and then pull back towards the DEMA line, that intersection can often create an area of support. Similarly, when prices move away from the DEMA indicator to the downside and then pull back towards the DEMA line, that interaction can create an area of resistance.
Trade entry mechanism – Technical traders can use the DEMA indicator as an entry signal. There are a few ways that this can be accomplished. The simplest method would be to wait for a price crossover to the upside of the DEMA line from below to signal a long entry. And along the same lines, you could wait for a price crossover to the downside of the DEMA line from above to signal a short entry.
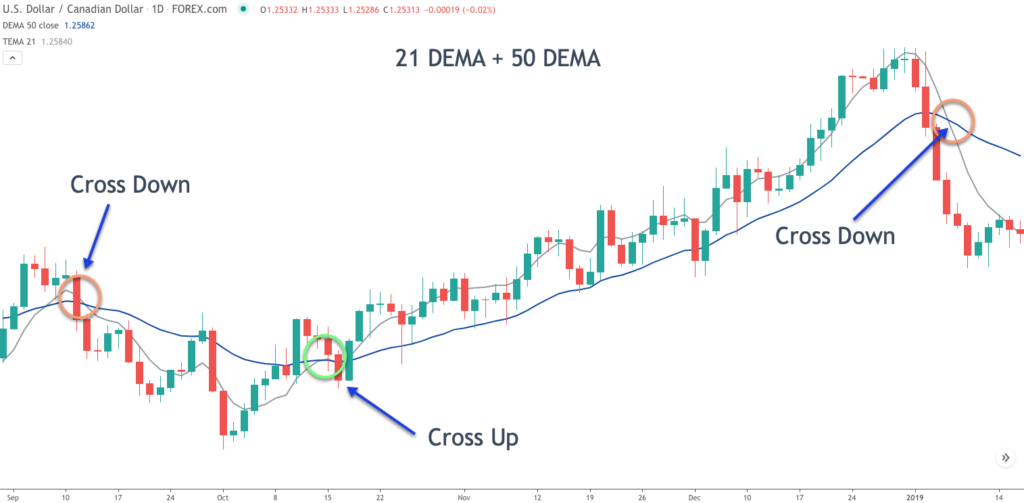
Additionally, some traders prefer to combine two DEMA lines, which consists of one shorter length DEMA line such as the 21 period, with a longer length DEMA line such as the 50 period. Then, they would wait for a crossover of the shorter 21 line above the longer 50 line to signal a long entry. And similarly, they could wait for a crossover of the shorter 21 line below the longer 50 line to signal the short entry.
Below you can find an example of crossover signals of the 21 period DEMA line shown in gray combined with the 50 period DEMA line shown in blue. The two downward crosses are noted within the orange circled area, while the one upward cross is noted within the green circled area.
DEMA Trading Strategy
Now we will attempt to build a trading strategy that incorporates the double exponential moving average as one of its core components. This DEMA strategy will include two technical conditions. The first will be the presence of an ABC price channel. An ABC price channel is essentially a three-legged formation wherein the prices are contained within the price channel. This type of price channel is also referred to as a zigzag pattern in Elliott wave terminology, or AB=CD within the harmonic trading terminology.
Essentially, the structure will resemble a lightning bolt formation, wherein there are two legs that move in the same direction, and one intervening countertrend move. This zigzag pattern is commonly referred to as a corrective structure, and often occurs as a retracement within the context of a larger price trend. The expectation is for prices to move lower following the breakout from a bullish or upward sloping ABC price channel, or for prices to move higher following the breakout from a bearish or downward sloping ABC price channel.
The second technical study that we will incorporate into the strategy is the DEMA. In this case we will be utilizing two different DEMA lines. The first will be the shorter 21 period DEMA line, and the second will be the longer 50 period DEMA line. This DEMA combination provides a good early indication for a potential breakout from the ABC price channel. The strategy tends to work best on the eight hour and daily price charts of major currency pairs such as the EURUSD, GBPUSD, USDJPY, AUDUSD and USDCAD.
So here are the rules for entering and managing a long position:
- A bearish ABC price channel must be present on the price chart.
- The price has broken above and closed above the upper resistance line of the ABC price channel.
- They 21 period DEMA line must cross above the 50 period DEMA line prior to the breakout noted above.
- Enter a market order to buy immediately following the close of the breakout candle.
- The stoploss will be placed just below the low of the breakout candle.
- The exit signal will occur upon the 21 period DEMA line crossing below the 50 period DEMA line.
And here are the rules for entering and managing a short position:
- A bullish ABC price channel must be present on the price chart.
- The price has broken below and closed below the lower support line of the ABC price channel.
- They 21 period DEMA line must cross below the 50 period DEMA line prior to the breakout noted above.
- Enter a market order to sell immediately following the close of the breakout candle.
- The stoploss will be placed just above the high of the breakout candle.
- The exit signal will occur upon the 21 period DEMA line crossing above the 50 period DEMA line.
The strategy seeks to capture an impulsive price move following a corrective phase. Generally, after the breakout signal, price should begin to accelerate as it enters into a new impulsive phase.
DEMA Strategy – Trade Example
Let’s now look at a practical example of the DEMA strategy outlined above. Below you will find the price chart for the USDCAD pair shown on the daily price chart.
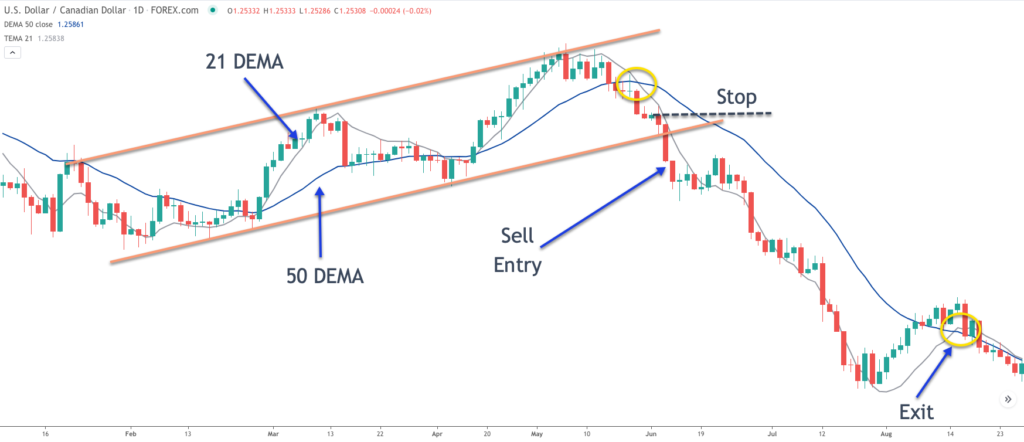
As we can see from the price action on the USDCAD Forex chart above, the prices started near a swing low and then began to move higher in what can be described as a zigzag pattern. Note how the zigzag pattern is comprised of three price legs, with two moving higher, and one intervening those two upward price legs.
The zigzag pattern is often referred to as an ABC pattern as we’ve noted earlier. You can also see how the price action within this ABC pattern is contained within an upward sloping price channel. As such, the initial component of our trade strategy has been confirmed. That is to say that a clearly visible bullish ABC price channel is present on the chart.
Now, we would expect that the price should break below the support line of this channel and begin a new bearish impulse phase. As such, we would wait for a candle to break below and close below this critical support line of the price channel. We can see where this occurred by noting the blue arrow noted as, Sell entry.
The breakout candle was a very strong bearish candle, which can be classified as a Marubozu candle. A Marubozu candle opens at one end of the extreme and closes at the other end of the extreme. In this case, the breakout candle, the Marubozu candle opens near the high, and close near the low of the candle. As such, this breakout bar provided a strong bearish signal.
But, before we enter a short position, we must confirm that the 21 DEMA line has crossed below the 50 DEMA line. This provides us with further confirmation of our short entry signal. As you can see from the yellow circled area near the top of the price chart, there was a bearish cross that occurred prior to the breakout candle.
As such, we can now move into the execution phase for this trade. We would immediately place a market order to sell. The stop loss would be placed just above the high of the breakout candle as is noted by the black dashed line noted as, Stop. Finally, we would exit this position either when our stop loss was hit, or when the reverse DEMA crossover occurs. That is to say we would exit when the shorter 21 DEMA line crosses above the longer 50 DEMA line. You can see where that exit trigger occurred by referring to the lower circled area within the price chart.
Summary
The DEMA moving average indicator is not much unlike the traditional simple moving average line, or the exponential moving average line. The main difference is that the DEMA price indicator is more responsive to the current price action. More so than even the exponential moving average. As a result, the DEMA line will often hug the price action more closely than either the traditional SMA or EMA moving averages. The DEMA indicator is certainly worth consideration, especially for traders that are seeking faster timing signals than can be found with other standard moving average indicators.