In the world of technical trading, identifying chart patterns and price structures has always been one of the most popular ways to analyse and trade the market. These formations give us an insight into the underlying order flow in the market. As traders they help us make decisions on where to buy and sell. The beauty of trading using chart patterns is that they can be identified without the use of technical indicators. Discretionary traders who have spent the necessary time learning these formations will be able to identify these exciting market opportunities.
Over the years, there are a few patterns in particular which have carved out a reputation among technical traders as being the most reliable and effective structures to use. Two of these structures are going to be covered in this article. This includes the rounding top chart pattern and the rounding bottom chart pattern. So, let’s jump right in and take a look at the rounding top chart pattern first. We’ll introduce how you can identify the pattern on your chart, explain what the pattern is revealing about the market direction and walk through how to trade the pattern.
Rounding Top Chart Pattern
The rounding top chart pattern is a bearish reversal pattern. This means that the presence of the pattern indicates there is a likelihood that the market will reverse lower, offering selling opportunities for traders. In this respect, the pattern can be thought of as similar to a head and shoulder pattern. The pattern is identified via the presence of a series of highs which follow an arc: lower highs on the left, slightly higher peaks in the middle, and then lower peaks again on the right.
Rounding Top Chart Example
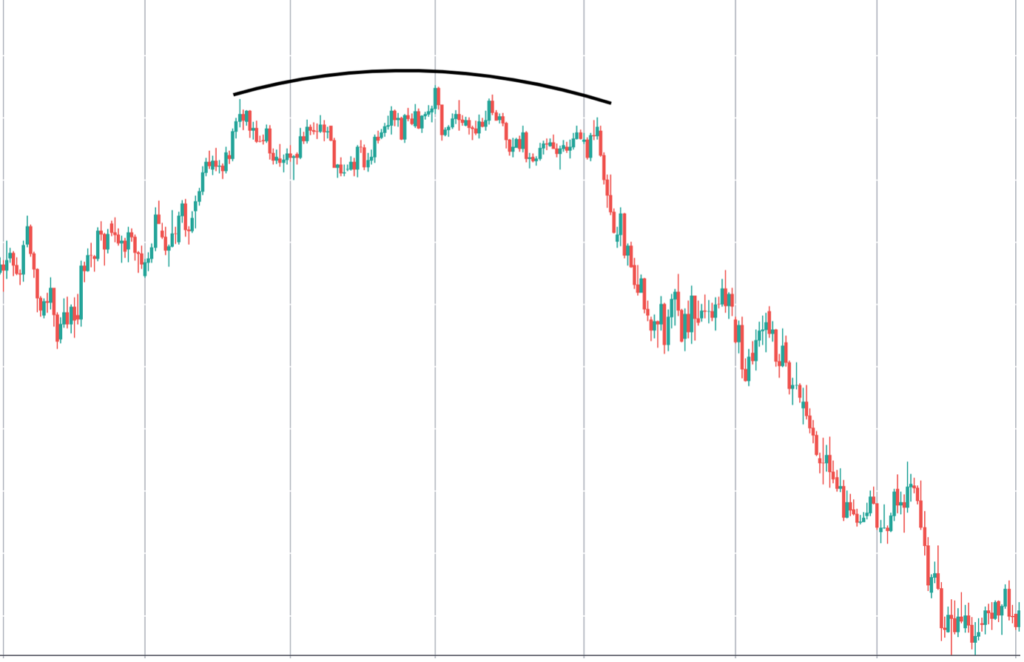
In the image above you can see a great example of a rounding top chart pattern. Price is rising initially before making the first peak on the left. We then see a small correction before price continues higher, rising into the peaks found in the middle of the arc. Price then corrects again before making another attempt to rise. This time however, price is unable to surpass the peaks found in the middle of the arc, forming another lower peak, allowing us to draw in our arc to highlight the pattern.
What Does the Rounding Top Tell Us About the Market?
So, now we know how to identify the rounding top technical formation, you might be asking, why is it important? Well, the beauty of the rounding top chart pattern is that it tells us some important information about the underlying order flow in the market.
If we think about what is happening in the market to create this formation, we know that bulls were in control initially, driving price higher before sellers take price lower. However, price once again meets demand which takes price higher into the centre of the arc. Then the bulls are met with strong selling pressure taking price lower. Price then runs into one final stage of buying but bulls are only able to take price back up partially giving us our lower right-hand peak, before sellers drive price down.
Ok, so now we know how to identify the rounding top reversal pattern. We also understand what the rounding top technical formation is telling us about the underlying order flow. The next question is, how do we trade the pattern?
Trading the Rounding Top Pattern
Based on the information the pattern is giving us, the best way to trade this pattern is to place a sell trade as price reverses lower.
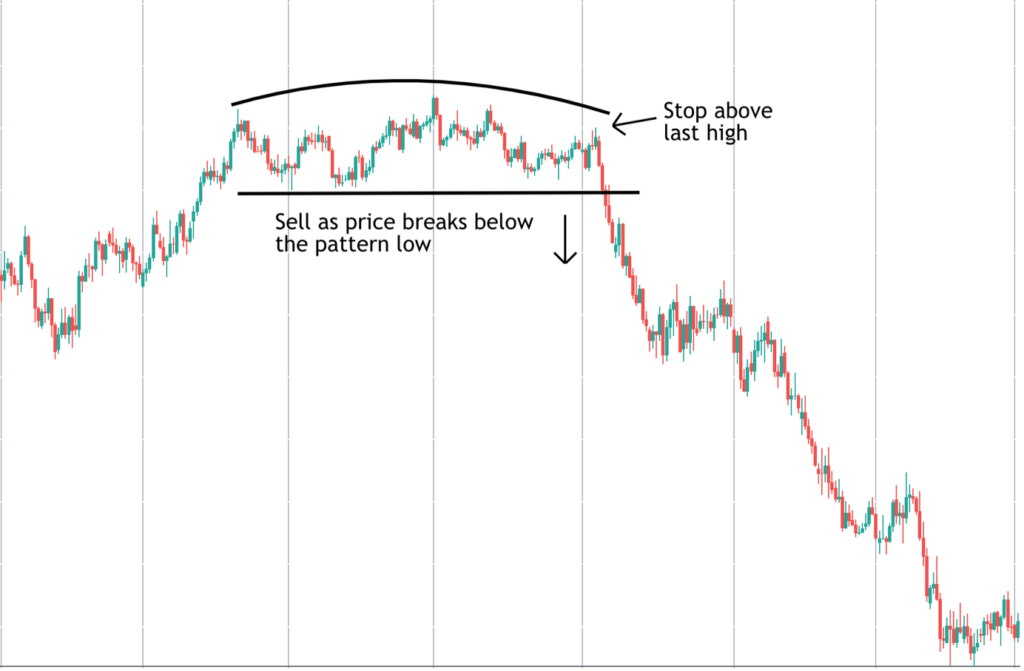
Looking at the example from earlier you can see that we are able to draw in a support line at the lows established after the correction from the first peak. This essentially gives us a trade line. Following the reversal from the final peak in the pattern, we can then sell as price trades below that level. We can also place a protective stop just above the final peak of the pattern.
How To Manage The Trade
In terms of a target, as with all trading methods and strategies, the trader’s focus should always be on achieving an acceptable risk to reward. This means always banking more on a winning trade than you lose on a losing trade.
So, once you have set your stop loss and entered your trade, a good rule of thumb is to set a target which is at least 2 x your stop loss. So, if your stop loss is 100 pips, set a target of at least 200 pips. This will help you achieve more sustainable profitability with your trades in the long run.
Where Best to Trade the Pattern?
Given the nature of the pattern, it is usually best to trade the structure following a price run up where the rally has met resistance (selling pressure). On the other hand, the pattern can also be useful if it forms during the correction during a bearish trend.
Benefits of The Rounding Top Chart Pattern?
The great thing about the rounding top pattern is that once you have learned to identify it, it becomes very easy to spot. So long as you can draw in the arc, and identify a trade line, you have the right view. Another benefit to the pattern is that it can be found and traded in all instruments and asset classes and on any time frame. Let’s now move onto the rounding bottom chart pattern.
The Rounding Bottom Chart Pattern
The rounding bottom chart pattern is simply the inverse of the rounding top chart pattern. The pattern is a bullish reversal pattern. This means that the presence of the pattern identifies the likelihood of a reversal higher and offers buying opportunities to traders. In this respect, the pattern can be thought of as similar to the inverse head and shoulder pattern.
The pattern is identified via the presence of a series of price lows which follow a gentle “U” shape or an inverted arc.
So, there will be initial lows, lower lows in the middle of the pattern and then higher lows on the right-hand side completing the rounding bottom technical formation.
Rounding Bottom Chart Example
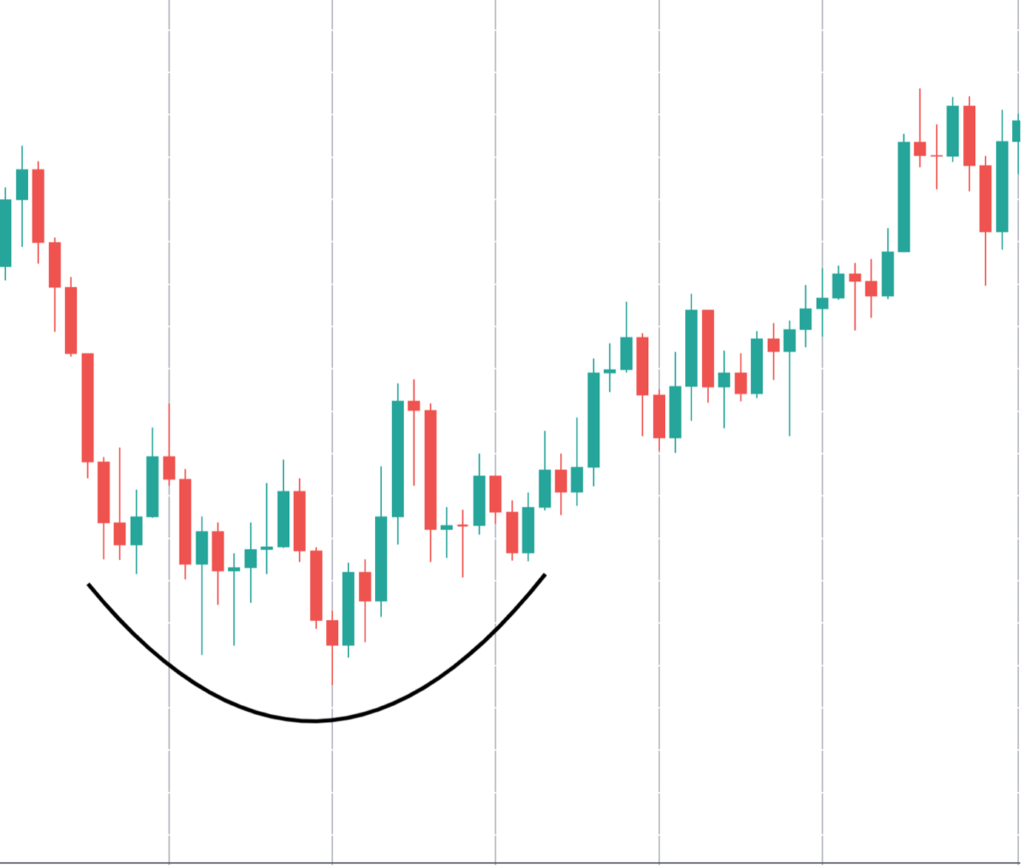
So, in the rounding bottom chart above you can see a great example of a rounding bottom technical formation. We have our initial low on the left. Price then makes a small correction higher before continuing lower into the lowest points found during the middle of the “U” shape. Price then corrects higher again, before once more turning lower. However, this time we put in higher lows which complete the right-hand side of the structure, giving us our rounding bottom chart pattern.
What Does the Rounding Bottom Tell Us About the Market?
The rounding bottom technical formation tells us that there has been a shift in power between sellers and buyers. So, if we think about what is happening in the underlying order flow to create the pattern: sellers are in control initially driving price down to the first lows on the left-hand side.
However, buyers then step in at this point to drive price higher. However, this move higher runs into selling pressure once again and price is driven down firmer to new lows. However, at this point, in the middle of the round bottom, buyers step in to drive price higher once again. This upside move meets selling pressure again, but the pressure is weaker and price is unable to form a new low. At this point we have our higher lows on the right-hand side of the pattern. At this point, the pattern is complete.
Trading the Rounding Bottom Pattern
Ok, so now we know how to identify the pattern and we understand what the pattern is telling us about the underlying order flow in the market the next question is: how do we trade the rounding bottom pattern?
So, remember how the rounding top is a bearish pattern and we look to sell a breakdown as price reverses lower? Well, this time around because the rounding bottom technical formation is a bullish pattern, we will look to buy a rounding bottom breakout higher.
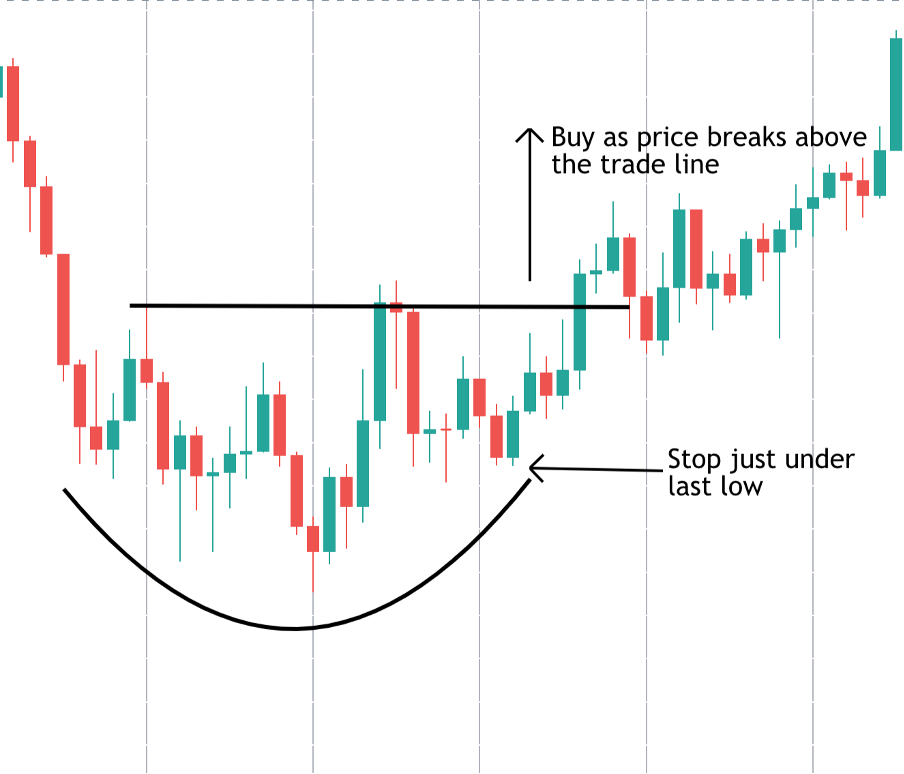
So, if we refer back to the example of a rounding bottom pattern we used earlier, let’s walk through how to trade a rounding bottom reversal. As with the rounding top, we need to establish a trade line. So, if we look at the high that was established following the move up from the first low at the start of the pattern, this gives us our trade line.
So, we want to place a buy trade as price breaks out above the trade line because this confirms the bullish reversal suggested by the pattern. We can then place out protective stop just beneath the last low in the pattern on the right-hand side.
How to Manage the Trade
So, once you have entered your buy trade and placed your protective stop, it is time to think about targets. As we discussed earlier, the best option is to always use a target which is at least 2 or 3 x your stop loss to ensure that you achieve a solid risk to reward ratio.
If we think about the shift in sentiment which is happening as the pattern forms, we can almost think of the market as a coiled spring. So, when the pattern has formed and price eventually breaks above the trade line, we are looking to capture a burst of momentum as the rounding bottom breakout occurs.
So, when managing the trade, you really have two options. The first is to proceed with a set target in place. Or, if you are a longer-term trader who is comfortable with the ebb and flow of holding a longer position, you can look to move your stop to break even as the first target is hit and then keep your position open longer. This will allow you to capture a bigger profit if the move develops into a proper trend reversal.
Where to Trade the Rounding Bottom Pattern?
Due to the nature of the pattern as a bullish reversal pattern, the rounding bottom chart pattern is best traded at the end of a bearish trend. When the trend runs out of steam or runs into support and we can identify a rounding bottom pattern, this alerts us to a shift in market sentiment and the potential for a reversal to occur. Similarly, if we can identify the pattern during the correction in a bullish trend, this can be a great way to get in as the longer-term trend resumes.
Benefits of The Rounding Bottom Pattern?
As with the rounding top chart pattern, the rounding bottom reversal structure can be identified and traded on all instruments and asset classes and on all time frames. So long as you can draw in the “U” shape and identify the trade line, you know you have the correct view and the pattern is there to be traded.
Points to Consider When Trading Rounding Tops and Bottoms
As briefly touched upon at the start of article, the beauty of trading rounding tops and bottoms is that the patterns can only be identified by the naked eye. There are no indicators which plot the pattern for you. As a technical trader you will need to develop the skill in identifying the pattern and picking the trade. The best advise here is simply to practice. If you need to you can print off the examples used above and keep them as a handy guide to measure any potential chart formation you find against it.
With that in mind, here are key tips to keep in mind when identifying the patterns:
- Shallow is better
You will notice that in both the examples used here for rounding tops and bottoms, the price structure is fairly shallow. Even the “U” shape describing the rounding bottom is more of a gentle smile shape than a “U”.
The reason for this is because if we think again about what is taking place in the underlying order flow to create these patterns, it is essentially a war being fought out around a certain price point where power is shifting. With the rounding top, power is shifting from the buyers to the sellers and with the rounding bottom power is shifting from the sellers to the buyers.
Now, due to the way this shift in sentiment takes place, this is why the patterns are comprised of many peaks and lows. A gentle pattern suggests that the market has undergone the proper shift in power between supply and demand and therefore, has a higher likelihood of working. If the pattern is not shallow, and the moves up and down are much bigger (more volatile), this suggests that the price action is too erratic and is not favorable for placing a trade.
- Combing rounding top and rounding bottom patterns with other technical elements
Another key aspect to point out about the patterns is that they can be used in conjunction with other forms of technical analysis in order to bolster the chances of success. Whilst it is perfectly valid to place a trade upon identifying the pattern, traders can incorporate other technical elements such as trend lines, support and resistance and technical indicators. Combing technical elements can be a great way to gain stronger conviction in your trading idea.
- Focus on location of the pattern
Finally, it is worth noting that as with all technical formations and strategies, the set-up is not guaranteed to be successful. It is the job of a good technical analyst and trader to study the markets and identify the best conditions for placing a trade.
As we discussed earlier in the article, there are certain locations which are better for taking a trade than others. As you spend time practicing identifying the patterns and trading them you will learn to identify the best locations and trading conditions for the specific markets you prefer.
Finally, it is worth considering the benefits of trading rounding tops and bottoms over other price structures and patterns.
The Benefits of Trading Rounding Tops and Rounding Bottoms
The main benefits of the rounding top reversal and rounding bottom reversal lie in its ability to catch other traders off guard. To traders who have not learned to identify the structure, it can simply look like a period of consolidation before trend continuation. However, as we have learned, the underlying order flow shift taking place is significant and when the reversal occurs, it can be powerful, offering great opportunities for traders.
As we have seen in the examples, because the changeover in order flow causes demand or supply to become pent up like a coiled spring, as the rounding top breakout or rounding bottom breakout occurs, the moves can find a lot of momentum. Remember, to set your stops and targets and always focus on achieving a good risk to reward profile.