Many traders are familiar with trading price action techniques using horizontal support and resistance lines, but some traders find it difficult to trade using trend lines, and this is rightfully so, since trendline analysis requires a little more discretion on the part of the trader. Trendlines are very useful in helping you determine the trend, and also the strength of that trend as well. Today we are going to take a closer look at this important price action analysis technique.
What are Forex Trendlines
Trendline analysis in Forex is a crucial price action method that helps us first and foremost in trend detection. Trendlines measure the price move of a Forex pair when the price is increasing or decreasing. In this manner, there are two types of trendlines:
1) Bullish Trendlines
We have a bullish trend when the Forex pair is increasing. In this manner, the price of the pair records higher bottoms and higher tops.
The bullish trend line should be located below the price action and it should connect the bottoms of the currency pair. This way the bullish trend line acts as a support for the price action.
2) Bearish Trendlines
The bearish trend has the opposite character of the bullish trend. We use a bearish trendline in order to measure the price action during a price decrease.
In this manner, the bearish trend requires the price to record lower tops and lower bottoms. This indicates that the price is dropping. The bearish trend line should be located above the price action during a price decrease. The bearish trendline plays the role of resistance for the price.
How to Draw a Trendline
In order to draw a trendline (bearish or bullish), you first need to identify a trend. So, let’s have a look at a chart.
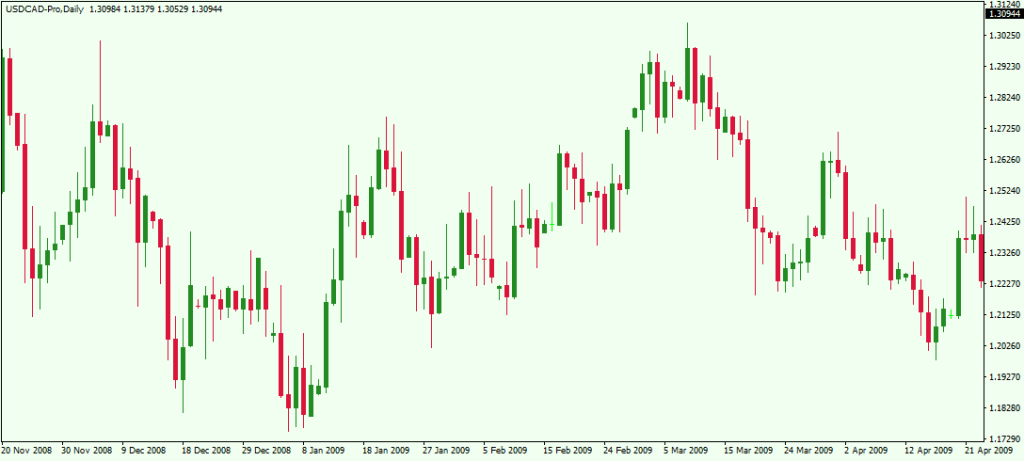 This is the daily chart of the USD/CAD Forex pair. Can you find a trend on the chart? It’s hard to do so visually without the help of a trendline. But once we add our trendline to the chart, you can see that there are at least three minor trends here. Let’s look below.
 This is the same USD/CAD chart, but this time, we have added three trendlines. Two of them are bearish (red), and one of them is bullish (green). Basically, drawing trendlines is not hard, but it can be tricky at times. So let’s get into the details of building trendlines.
In order to gain a better understanding of how to draw trend lines, we must first recognize the composition of the typical candlestick bar. Every Japanese candlestick consists of five elements – body, top of the body, bottom of the body, upper candlewick, and lower candlewick. We need to understand these elements in order to build a proper trendline. So, if you want to build a bullish trendline, you need the spot the lower candlewicks and the candle body bottoms on the chart. Most times you would use the candlewicks to compose the trendline, however, you could use the candle body in instances where short term volatility spikes occur outside the normal range of the sloping trendline. Then, if the price is moving upwards, you connect these with a straight line.
Three Important Rules for Building Trendlines
In order to confirm a trend, you need at least three points lying on the same line!
When drawing trendlines, you must have a minimum of two points. In order to confirm a sloping support or resistance tendency, you need a third confirmation point, lying on the same line as the two previous points. Let me show you this on our USD/CAD chart:
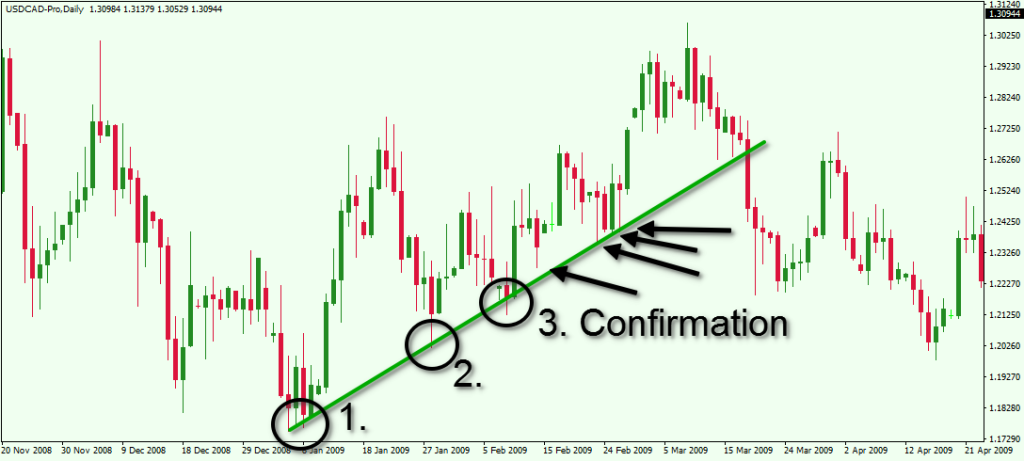 So, our bullish trend starts with the first and a second bottom. The third bottom is the trend confirmation signal. The arrows after the confirmation point out subsequent tests of support, which lay in the area of our trendline.
Never think of the trend as contained within of a single line. The trend is not a line, but an area.
When you build a bullish trendline you should take into consideration the lower candlewicks and the body bottoms. Very often the lower wicks of the candlesticks might go outside the scope of the trendline. However, we know to think of the trendline as an area and not as a single line written in stone. In this manner, if the price action breaks the trendline with its candlewick, this doesn’t mean that the trend is broken. An important point also to keep in mind is that as trendlines mature, there will be more of a tendency for price reactions at the trendline levels, and many times you will see false breakouts around these areas
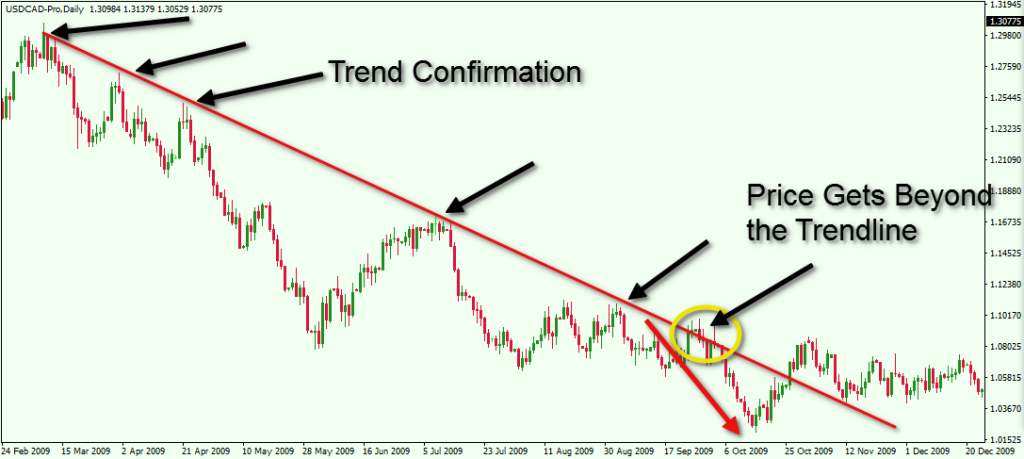 This is another example on the USD/CAD Forex pair. On the image we see a big bearish trend line on the daily USD/CAD chart. The third top on the chart confirms the trend line. The last top of the downtrend goes outside the trendline.
However, we recognize from the price action at this test that most of the price action closed within the trendline area, and there were quite a few wicks around this zone, indicating that price was being rejected as it was trying to break thru. As a result, price records another drop before it eventually breaks the trend on the final attempt.
When drawing trend lines, it’s always best to do it manually by hand rather than relying on a trendline indicator to plot the line for you. There are auto trendline indicators that will draw trendlines for you, but most are not very reliable.
Trading Trendlines
Since we discussed how to identify trends and build trendlines, we can now switch gears and discuss trading with trendlines. So let’s now talk about incorporating a trendline trading strategy.
We’ll start with a few basic rules for trading with trendlines. There are three basic occurrences on the trendline, which could be traded – trending move, correction, and breakout. We will now go through each of these.
Trading the Trending Move
When we confirm a trendline, we can prepare to trade with the trending move. With the trendline confirmation we have a clear area for our position entry point. In this manner, if we confirm a bullish trend, we can trade the next bounce from that trendline, assuming that price action confirms our setup. Have a look at the image below:
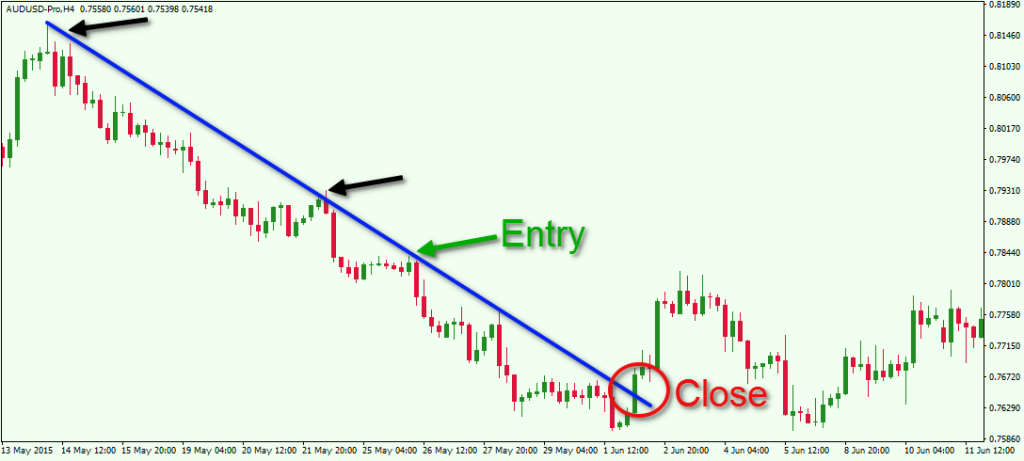 This is the 240 minute chart of the AUD/USD Forex Pair for May – June, 2015. The blue line is a trend line of the bearish price move you see. The three arrows are the three base points, which form the trend. Notice that the third arrow is green. This is so, because it indicates an area of trend confirmation. You could go short the AUD/USD after the green entry arrow marked on the chart. We see a strong bearish candle after price approaches the trendline. This provided a good entry signal.
After the trend gets confirmed (green arrow) the AUD/USD Forex pair creates a trending move downwards. Then we see a new lower bottom and a new correction to the trend. The price interacts with the blue trendline and then bounces downwards again. AUD/USD breaks its previous low, creating a lower bottom.
The next move to the trendline is considered the last one, although there is a tiny 1-period bounce from it. The AUD/USD price breaks the trend afterwards with a strong bullish closing candle. This is a signal that the trend may be over or very likely to stall. In this case the AUD/USD short sellers might want to close their successful trades.
Trading Corrections of Trendlines
Now I will show you how to spot and trade corrections of trending moves. However, I would like to emphasize that counter trend trading is for advanced traders. The reason for this is that it is a risky initiative to trade corrections. But first…
What is a Trend Correction in Forex?
A correction (corrective move) is a move, which comes after an impulsive trending leg and brings the price back to the trendline area. A corrective move should be smaller than the trending move. Also, in most cases, corrections tend to take more time to complete than the trending leg phase. As a result, corrections are definitely riskier and less attractive to trade. In order to demonstrate how to trade corrections in the content of trendlines, we will use a channel for our example. Have a look at the image below:
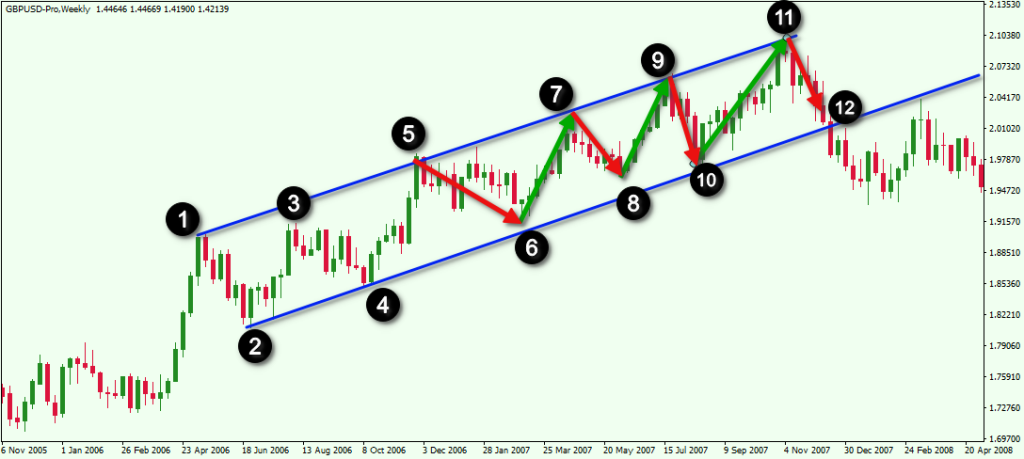 This is the weekly chart of the GBP/USD. Take note of the two bullish parallel trendlines (blue). The black circles with the numbers show you the respective Trend phases. The green arrows show you the trending moves in the channel, while the red lines point out the corrective moves.
When we have a channel, we usually confirm the pattern with the third price move. In other words, we need only two bottoms in case of a bullish trend and not three as described above. The reason for this is that after the third price move we have two bottoms on a bullish line and two tops on another bullish line, which is parallel to the first line. In this manner the pattern gets confirmed.
The first move which could be traded is at #4. You would have connected points one and three on the chart to draw the upper line, then you would draw a parallel line from the bottom of point 2 and extend it out. This is referred to as a parallel trendline and is a popular technique that many traders are not aware of. Most traders would use the confirmation that comes at the point 5 retest as a potential trade setup. .
Notice that the corrections are smaller in terms of price change, as they are contrary to the general trend. A countertrend trader would sell at the tops of the upper trendline with targets near the bottom of the channel. As you can see this strategy is much less desirable than the potential that we have in trading with the trend to the upside.
Trading Trendline Breaks and Reversals
Since we have learned how to trade swings using trending and counter trend approaches, I will now show you how to trade trendline breakouts. For example, If the price is moving along in a directional manner and it demonstrates the tendency of higher highs and high lows we have a bullish trending situation. But as we know, this pattern is likely to stop and reverse at some point. When this happens, the price changes its direction and starts moving in the opposite direction.
Traders should be on the lookout for potential trendline breaks, as this is an attractive way to get in the beginning of a new price move. However, every breach in price through the trendline is not enough to confirm a reversal pattern. As I already said, it is common for the price to go a bit beyond the scope of the trendline, and the trendline should never be treated as an exact line. Essentially, trendline support and resistance should be viewed as a zone rather than as an impenetrable line.
Experienced traders know well that confirming a reversal is not an exact science. I have divided the process into four phases to understand the typical structure of a trendline breakout. The image below will show you the four phases to recognize when trying to confirm a trend reversal using trendlines.
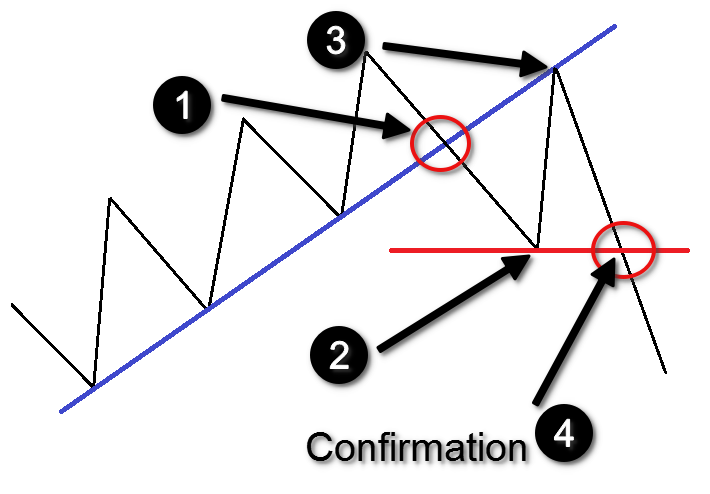 This simple sketch shows the four signs you need in order to confirm a reversal. Let’s go thru this using a bullish trendline example.
A break in the trend occurs. We have a break when the price closes a candle below the trendline.
The price decreases further and creates a bottom, which is lower than the previous price data inside the trendline. We draw a horizontal support line at the swing low, which will be the trigger of our reversal confirmation.
The price then increases and tests the already broken trend as a resistance.
The retest does not have to touch the broken line. The reason for this is that the trendline must be viewed as an area and not as a single line. Furthermore, the price could even increase beyond the already broken trendline area.
The price decreases again and breaks the already established support level (red line). This is the reversal confirmation signal. When you get this fourth signal, you have a strong reason to believe that the price will reverse direction. You could short the currency pair based on strong reversal belief. It is also important to point out that aggressive traders may look to sell at the retest of the trendline. This provides higher profit potential, and experienced price action traders typically prefer this type of entry.
The same indications are in force for a bearish trend, but everything is in the opposite direction. Let’s now see how these four rules apply to our GBP/USD chart we discussed above.
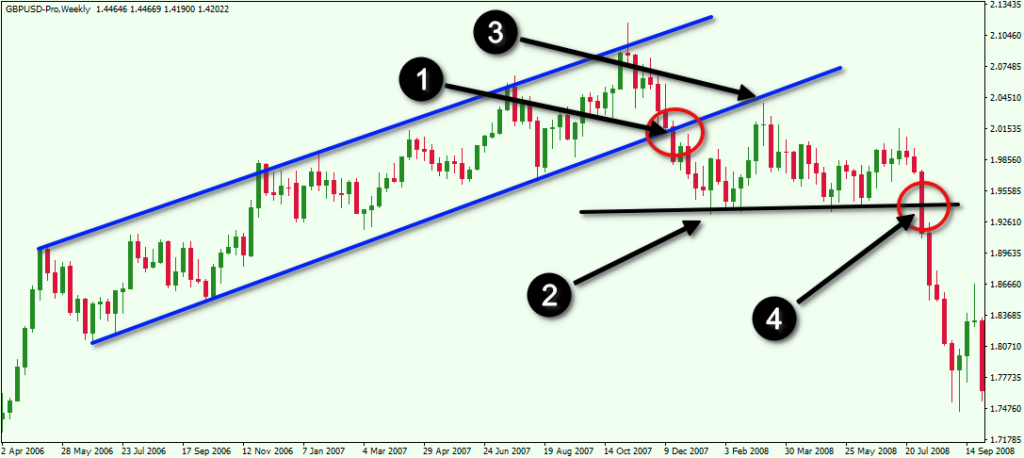 This is the same parallel trendline drawn as a channel on the weekly GBPUSD chart we discussed above. This time, though, we interested in the in the events after the trendline gets broken.
We have the numerated dots indicating the four phases of the reversal process. #1 points to the moment when the price breaks the bullish trend line. Notice the strong red candle that closes outside the upward sloping trendline. This is considered a high momentum breakout to the downside. #2 shows the price decrease below its previous bottom and the swing low that was created. #3 shows the retest of the broken trendline which is now considered resistance. Aggressive traders will look to enter in this area. A good entry point would be after the close of the strong red candle that follows the doji bar at new trendline resistance. And #4 shows the strong breakdown below the swing low.
Notice the strong red bar which closes sharply below the support swing line. This would be a confirmed short opportunity in the GBPUSD. After that, Cable drops significantly over the next a 5-month period.
This type of trendline trading system gives you a clear picture of what is currently happening with the trend of a currency pair.
Conclusion
- Trendlines are a crucial analysis tool for price action traders.
- There are two types of trendline:
- Bearish Trendlines
- Bullish Trendlines
- When you draw a trendline you should take into consideration:
- The candle body bottoms and the lower candlewicks for bullish trends
- The candle body tops and the upper candlewicks for bearish trends
- Remember these three important rules when you analyze potential trends:
- You need at least three points lying on the same line in order to confirm tendency.
- The trendline responds to an area and not to a single line on the chart.
- Typically The older the trend, the wider the trend volatility zone
- There are three main trendline trading strategies that can be used:
- Trading in the direction of Trending Moves
- Trading Corrections of the Trendline
- Trading Trendline Breaks