The Cypher pattern is one of the lesser-known harmonic trading formations. But it is, nevertheless, a powerful trading pattern that you should learn and add to your trading toolkit. Here we will dissect the cypher harmonic pattern in detail, and provide some best practices for trading it in the financial markets.
Cypher Harmonic Pattern
The Cypher pattern is a reversal formation within the harmonic class of patterns. It occurs across various financial markets including forex, futures, stocks, and cryptos. Having said that, it is a less commonly seen structure compared to some other harmonic patterns such as the Gartley, Bat, and Butterfly patterns.
The cypher pattern consists of four separate price legs, with certain clearly defined Fibonacci relationships. We will be discussing each of the important Fibonacci ratios within the cypher pattern as we move deeper into this lesson.
The cypher formation often occurs within a trending phase of the market and appears as a terminal move. That is to say that, upon completion of the formation, there should be a reversal in the market.
So within the context of an uptrend, the cypher pattern makes higher highs and higher lows during its formation. And conversely, within the context of a downtrend the cypher pattern makes lower lows and lower highs during its progression.
Another interesting characteristic of the cypher pattern is that the first three legs within the formation resemble a zigzag or lightning bolt appearance.
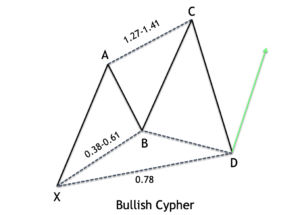
Below you can see an example of the cypher pattern. In this particular case, the structure is considered a bullish variety of the pattern.
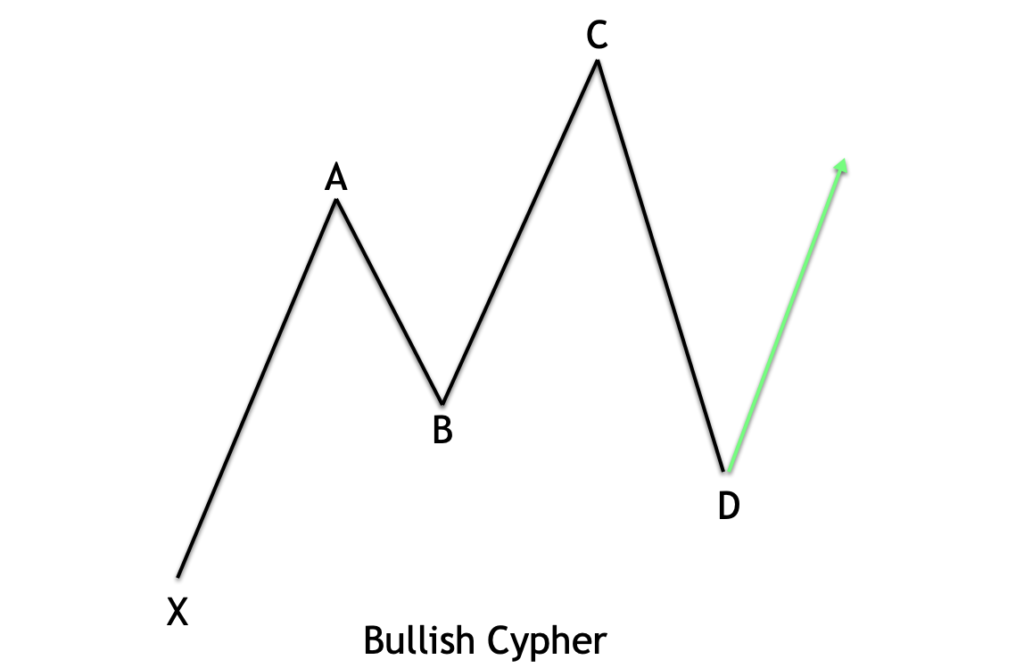
Notice above, we can see that the pattern is a five-point structure, denoted as XABCD. As such, there are a total of four individual legs that make up the pattern. The first leg is the XA leg, the second leg is the AB leg, the third leg is the BC leg, and the final leg is the CD leg. Can you see how the A point and the C point within the bullish cypher structure are making higher highs, and similarly, how the B point is making a higher low? In addition to that, if you take a moment to study the XABC points within the structure, you will be able to recognize that it resembles a zigzag or lightning bolt type of look.
Cypher Pattern Rules
Lt’s now discuss some of the more intricate rules for correctly classifying a valid cypher pattern. The initial leg of the pattern is called the XA leg, and is impulsive in nature. The second leg of the pattern is called the AB leg which retraces a portion of the XA leg. The second leg of the pattern is corrective in nature. The third leg of the pattern is called the BC leg, and extends beyond the extreme of point A within the structure. Finally the CD leg retraces a large portion of the entire move made between point X and C.
Let's now define more precisely the Fibonacci relationships within these different price legs.
The AB leg must retrace the XA leg by at least 38.2%, and it should not exceed 61.8%.
The C point within the structure should be a minimum 127% projection of the XA leg, measured from point B. At the same time, C point should not extend beyond the 141.4% level.
Point D should terminate at or near the 78.6% Fibonacci retracement level of the price move as measured from the start at point X to point C.
Of these rules, the first and last are the most important for the Cypher pattern.
There are two primary Fibonacci tools that will be needed to make these measurements. The first is the Fibonacci retracement tool, and the second is the Fibonacci projection tool. Both of which are available within most charting platforms. Additionally, there are harmonic patterns indicators and software programs that can automatically recognize and label the cypher harmonic pattern on the price chart.
A relevant question that often arises when discussing the various points within the cypher pattern, or any other harmonic pattern for that matter, is the following - should you measure the points using the shadows within the candlestick, or should you only use the closing prices within the candlestick? The answer to this question is that - it depends. That is to say that if the wick within the candlestick appears inordinately large, then I typically opt to use the candle close for measuring the specific point. On the other hand, if the wick within the candlestick is of a relatively normal size, then I will opt to use the wick in the measuring process.
Bullish Cypher Pattern
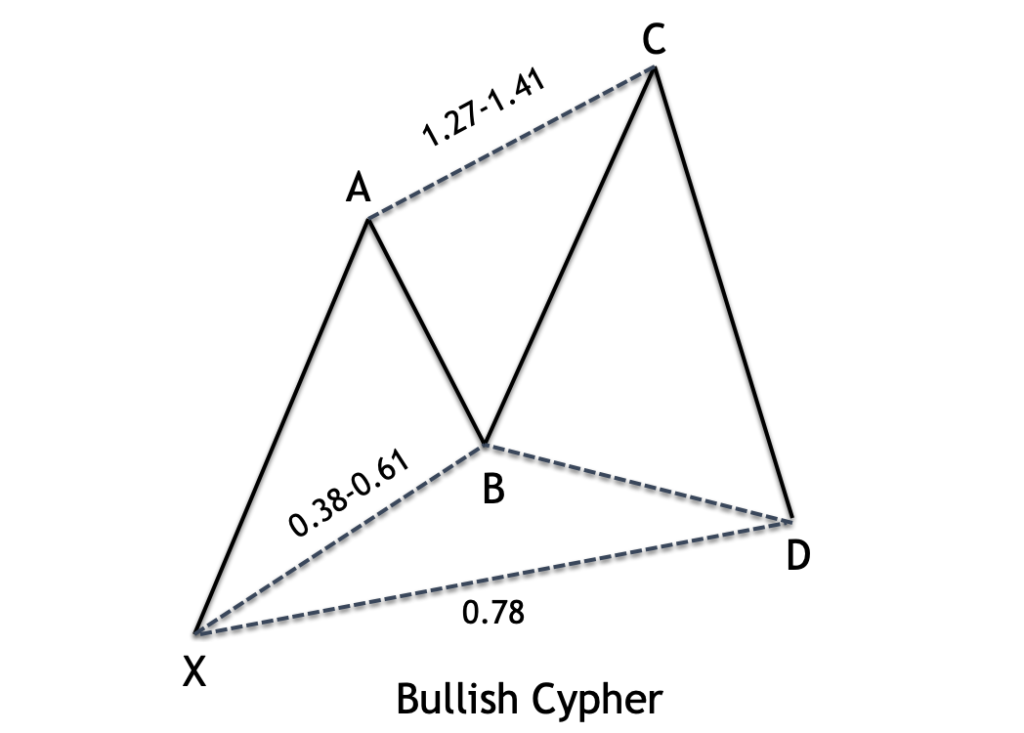
Let's now take a closer look at the characteristics of the bullish variety of Cypher pattern by referring to the image below.
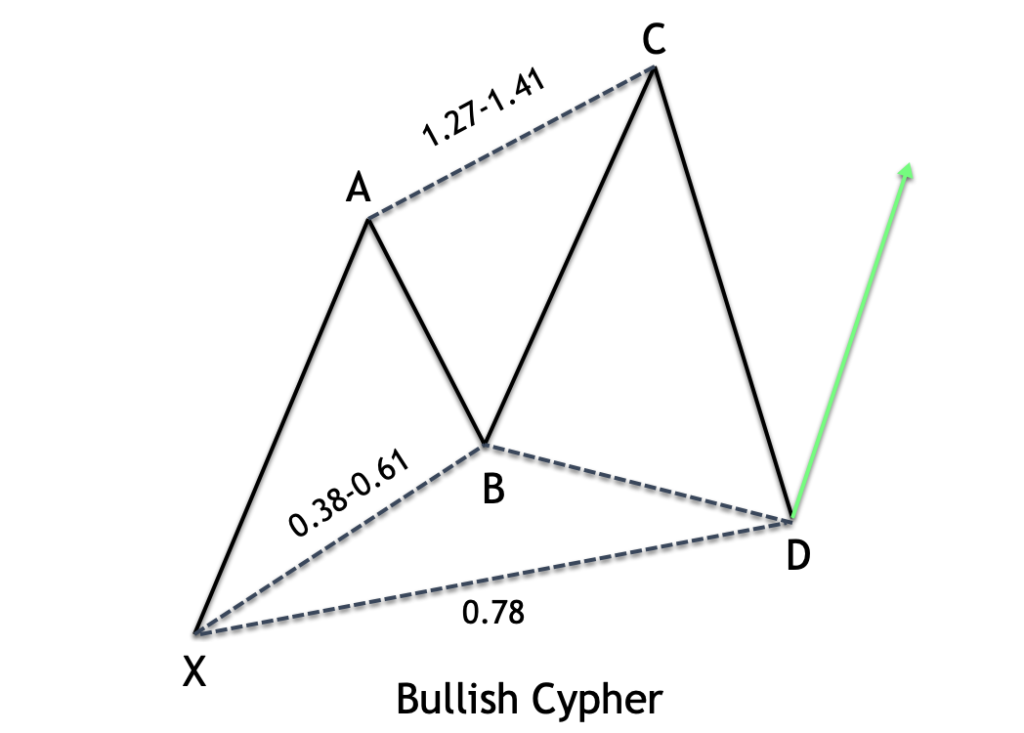
The initial leg, the XA leg, rallies higher from the starting point at X.
The AB leg moves lower to retrace the XA leg. This retracement should bring prices to between the 38.2 to 61.8 percent level of the XA leg.
The BC leg moves higher and takes out the swing high at point A, and terminating between the 127.2 and 141.4 projection of the initial XA leg.
The CD leg moves lower and terminates near the 78.6% retracement level of the price move from point X to point C.
Upon the price reaching the 78.6% retracement level at point D, the bullish Cypher pattern is considered complete, and a price rise is expected.
Bearish Cypher Pattern
And now for the characteristics of the bearish variety of Cypher pattern, let's turn our attention to the illustration below.
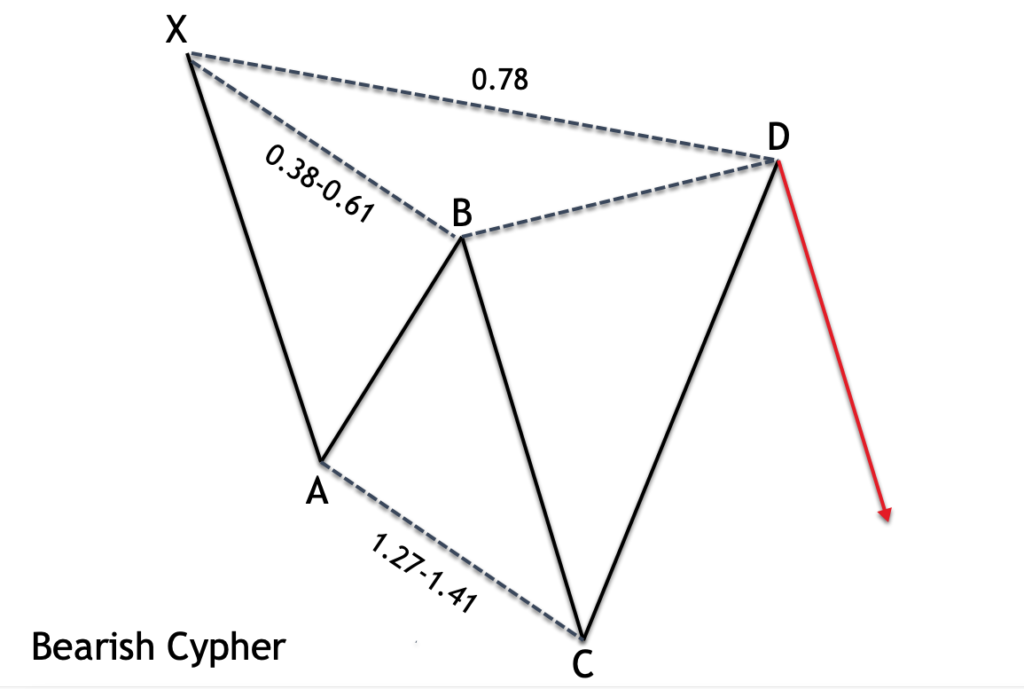
The initial leg, the XA leg, declines from the starting point at X.
The AB leg moves higher to retrace the XA leg. This retracement should bring prices to between the 38.2 to 61.8 percent level of the XA leg.
The BC leg moves lower and takes out the swing low at point A, and terminates between the 127.2 and 141.4 projection of the initial XA leg.
The CD leg moves higher and terminates near the 78.6% retracement level of the price move from point X to point C.
Upon the price reaching the 78.6% retracement level at point D, the bearish Cypher pattern is considered complete, and a price decline is expected.
Cypher Chart Pattern vs Shark Chart Pattern
Some traders that utilize harmonic patterns in the market get confused between the cypher pattern, which we been discussing in this article, and the shark pattern, which is another similar harmonic pattern. We will try to defuse some points of confusion between these two related structures.
Below you can see a side-by-side comparison of the cypher pattern and the shark pattern.
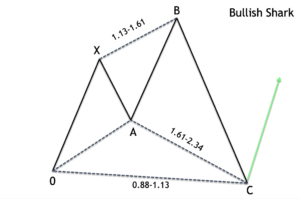
Though there are similarities between these two patterns there are a few key differences that traders should keep in mind.
Firstly, the cypher pattern is denoted as XABCD, while this shark pattern is denoted as 0XABC.
The second leg within the cypher pattern must retrace within a specific Fibonacci range of the initial leg. There is no such requirement for the shark pattern.
The second swing high within the cypher pattern should terminate within the 127 to 141% level of the XA leg. For a shark pattern however, this termination range is quite a bit wider, specifically between the 113 and 161.8% level.
The final leg within the cypher pattern will terminate near the 78.6% retracement of the prior move measured from point X to point C. The shark pattern on the other hand will terminate between the 88 and 113% of the price move as measured from point 0 to point B.
As you can see that visually the cypher pattern and shark pattern have many similarities. But, from the conventional labeling perspective, and the Fibonacci ratio requirements, they are quite a bit different.
Cypher Trading Strategy
We’ll now move on to building a strategy based on the cypher pattern. Once you've gone through the process of scanning the market for a potential structure that resembles the cypher pattern, you'll want to validate the most important Fibonacci relationships within the structure before proceeding further.
And again just to recap the three primary conditions for the cypher pattern are listed below:
The AB leg must retrace the XA leg by at least 38.2%, and it should not exceed 61.8%.
The C point within the structure should be a minimum 127% of the XA leg, measured from point B. At the same time, the C point should not extend beyond the 141.4% level.
Point D should terminate at or near the 78.6% Fibonacci retracement level of the price move as measured from the start at point X to point C.
Once we’ve validated the cypher trading pattern, we can prepare for a potential trade near its completion point.
Here are the rules for a long position within the bullish cypher trading pattern.
- Enter a limit order to buy at the 78.6% retracement level of the XC leg. This is known as the D point.
- Place a stop loss order below the X point.
- We will use a two tiered take profit target strategy. The initial target will be set just below of the A point swing high, and the second and final target will be set just below of the C point swing high.
Here are the rules for a short position within the bearish cypher trading pattern.
- Enter a limit order to sell at the 78.6% retracement level of the XC leg. This is known as the D point.
- Place a stop loss order above the X point.
- We will use a two tiered take profit target strategy. The initial target will be set just above of the A point swing low, and the second and final target will be set just above of the C point swing low.
Bullish Cypher Trade Example
We’ll now go through an actual trade example of a bullish Cypher pattern in the Forex market. For this example, we will be referring to the 240 minute chart of the Australian dollar to US dollar currency pair.
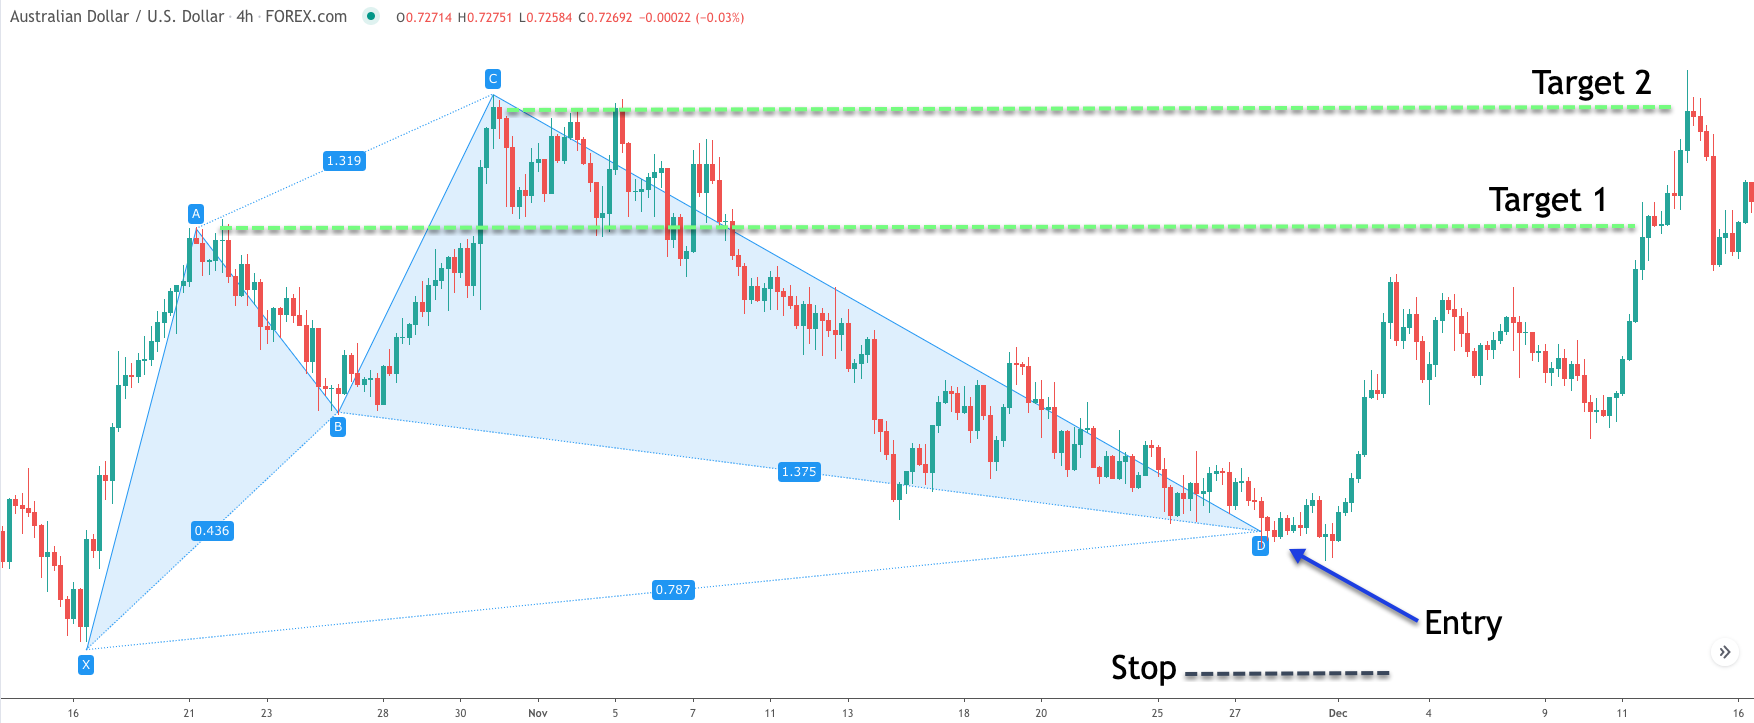
On the chart above, you can see the cypher pattern outlined within the light blue shaded area. Notice the sharp move higher starting from the low at point X and ending at point A, which completes the initial XA leg of this pattern. Next there is a price retracement of the XA leg. This occurs during the AB leg and point B terminates at the 44% retracement level. As such, the AB retracement is within the preferred Fibonacci range for the cypher pattern.
After the completion of point B, prices began to move higher once again within the BC leg. Notice how during the progress of this leg, the price breaks above the swing A high point. This is a requirement of the cypher pattern. After the BC leg completes, prices began to move lower in the final leg of the move, known as the CD leg.
We know that one of the most important Fibonacci relationships within the cypher pattern is for point D to terminate at or near the 78% retracement of the price move measured from the start of X to the end of C. In fact, based on our cypher trading rules, we would initiate a long position at the 78% retracement level. You can see that entry level labelled on the price chart.
As soon as our buy entry order was executed, we would shift our focus to the placement of the stoploss. The stoploss would be placed just below the swing low of point X. This level is marked on the price chart with the black dashed line below the entry point. After making a slightly lower price move following the entry point, the price began to rise quickly. And fortunately on this particular trade, we were in no real jeopardy of having our stoploss triggered.
This cypher strategy calls for a two-tiered take profit level. The first target, denoted on the price chart as target 1 would be set at the swing high of point A within the cypher pattern. And the second target denoted on the price chart is target 2, would be set at the swing high of point C within the cypher pattern.
Both of which are clearly shown with the green dashed lines above the entry point. Target 1 was reached fairly easily, followed by target 2 which was also triggered. And as a result, we would have realized a profit on this trade.
Bearish Cypher Trade Example
Let's now illustrate the bearish variety of the Cypher pattern. Below you will see the price chart for the Euro to Canadian dollar currency cross pair based on the daily timeframe.
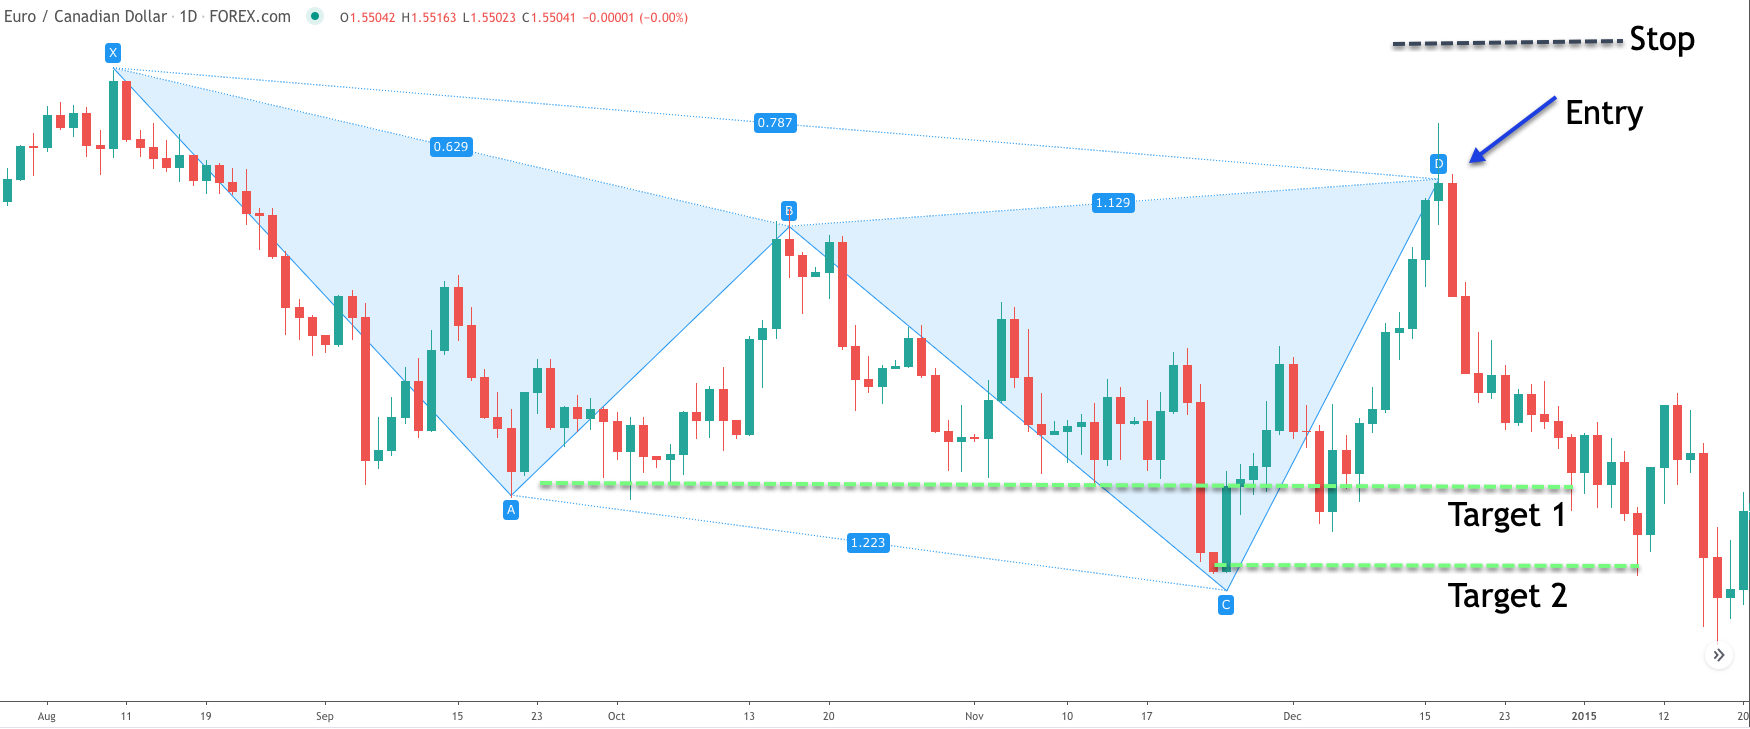
The bearish Cypher forex pattern has been outlined and shown within the light blue shaded area. Starting from point X, the price of the EURCAD begins to decline sharply. The selling pressure continues until it reaches the swing low at point A. This entire move is denoted as the XA leg.
From the swing low at point A, the price begins to retrace higher. Ultimately, the AB leg retraces the XA leg by 62%. As such, it is just slightly outside the ideal maximum retracement level of 61.8%. But nevertheless, it is close enough to consider it a viable cypher pattern.
Once point B completes, prices resume the downward trajectory, taking out the swing low at point A. Once this BC leg ends, the final leg within the bearish cypher pattern, the CD leg, begins to move higher, as it retraces the entire move down starting from the swing high at point X to the swing low at point C. Our sell entry would occur upon the CD leg making a 78% retracement of this aforementioned X to C price move.
If you refer to the price chart, you can see where that sell entry signal would have triggered. You will also notice that following the sell entry, the prices did continue to move slightly higher, before rejecting back down, and forming a shooting star candlestick. This further bolsters our level of confidence for a potential short trade opportunity.
The stop loss would be placed above the swing high of the X point as is illustrated by the black dashed line above the entry. And finally, you can see the two target levels marked on the price chart, which correspond to the swing low of point A, and the swing low of point C. Soon after our sell entry order was triggered, prices began to move lower quite sharply, ultimately triggering both of our target levels and resulting in a profitable trade.
Summary
The cypher pattern is a more advanced harmonic structure, and one that some traders are not entirely familiar with. The pattern has a high probability of success and offers a solid risk to reward profile when traded correctly. As with most other harmonic patterns, it's important to be fairly stringent when it comes to validating the pattern. Although we want to leave some leeway with regards to the ideal Fibonacci ratios within the pattern, we do not want to be too lenient in its validation.
The reason being is that those cypher structures that are closest to the ideal fib ratios, will often have a better probability of success than those with weaker fib relationships. Another point of interest that is worth mentioning is that cypher pattern trading will perform better when traded on higher time frames such as the four hour and above.